Log entries by program:
| Program name | Lines | %Lines | Size | %Size |
|---|---|---|---|---|
| inn | 16714 | 90.3% | 1.4 MB | 85.0% |
| innd | 1148 | 6.2% | 168.6 KB | 10.3% |
| innfeed | 628 | 3.4% | 72.2 KB | 4.4% |
| controlchan | 23 | 0.1% | 4.5 KB | 0.3% |
| nnrpd | 4 | 0.0% | 0.4 KB | 0.0% |
| pgpverify | 2 | 0.0% | 0.2 KB | 0.0% |
| TOTAL: 6 | 18519 | 100.0% | 1.6 MB | 100.0% |
History cache:
| Reason | Count | %Count |
|---|---|---|
| Do not exist | 16271 | 97.7% |
| Negative hits | 323 | 1.9% |
| Positive hits | 38 | 0.2% |
| Cache misses | 16 | 0.1% |
| TOTAL: 4 | 16648 | 100.0% |
INND timer:
| Code region | Time | Pct | Invoked | Min(ms) | Avg(ms) | Max(ms) |
|---|---|---|---|---|---|---|
| article cancel | 00:00:00.009 | 0.0% | 62 | 0.000 | 0.145 | 1.000 |
| article cleanup | 00:00:00.082 | 0.0% | 16280 | 0.000 | 0.005 | 0.028 |
| article logging | 00:00:00.445 | 0.0% | 16655 | 0.000 | 0.027 | 0.067 |
| article parse | 00:00:00.237 | 0.0% | 17810 | 0.000 | 0.013 | 0.044 |
| article write | 00:00:03.128 | 0.0% | 16060 | 0.059 | 0.195 | 3.143 |
| artlog/artcncl | 00:00:00.000 | 0.0% | 62 | 0.000 | 0.000 | 0.000 |
| data move | 00:00:00.010 | 0.0% | 19621 | 0.000 | 0.001 | 0.014 |
| hisgrep/artcncl | 00:00:00.000 | 0.0% | 54 | 0.000 | 0.000 | 0.000 |
| hishave/artcncl | 00:00:00.000 | 0.0% | 62 | 0.000 | 0.000 | 0.000 |
| history grep | 00:00:00.000 | 0.0% | 0 | 0.000 | 0.000 | 0.000 |
| history lookup | 00:00:00.073 | 0.0% | 16606 | 0.000 | 0.004 | 0.035 |
| history sync | 00:00:00.023 | 0.0% | 412 | 0.000 | 0.056 | 0.667 |
| history write | 00:00:00.541 | 0.0% | 16280 | 0.000 | 0.033 | 0.356 |
| hiswrite/artcncl | 00:00:00.000 | 0.0% | 8 | 0.000 | 0.000 | 0.000 |
| idle | 24:00:46.934 | 100.0% | 18424 | 1649.036 | 4692.083 | 13047.478 |
| nntp read | 00:00:00.525 | 0.0% | 18096 | 0.000 | 0.029 | 0.091 |
| overview write | 00:00:00.967 | 0.0% | 16060 | 0.000 | 0.060 | 0.367 |
| perl filter | 00:00:10.343 | 0.0% | 16280 | 0.496 | 0.635 | 0.845 |
| python filter | 00:00:00.000 | 0.0% | 0 | 0.000 | 0.000 | 0.000 |
| site send | 00:00:00.873 | 0.0% | 16062 | 0.000 | 0.054 | 0.169 |
| TOTAL: 24:01:08.189 | 24:01:04.190 | 100.0% | - | - | - | - |
INNfeed timer:
| Code region | Time | Pct | Invoked | Min(ms) | Avg(ms) | Max(ms) |
|---|---|---|---|---|---|---|
| article new | 00:00:00.036 | 0.0% | 16040 | 0.000 | 0.002 | 0.040 |
| article prepare | 00:00:00.007 | 0.0% | 64160 | 0.000 | 0.000 | 0.004 |
| article read | 00:00:00.629 | 0.0% | 16040 | 0.000 | 0.039 | 0.640 |
| backlog stats | 00:00:00.025 | 0.0% | 52716 | 0.000 | 0.000 | 0.006 |
| callbacks | 00:00:00.000 | 0.0% | 0 | 0.000 | 0.000 | 0.000 |
| data read | 00:00:00.268 | 0.0% | 32195 | 0.000 | 0.008 | 0.028 |
| data write | 00:00:00.376 | 0.0% | 16210 | 0.000 | 0.023 | 0.080 |
| idle | 23:57:07.739 | 100.0% | 52716 | 845.360 | 1635.703 | 4656.085 |
| status file | 00:00:00.054 | 0.0% | 166 | 0.000 | 0.325 | 1.000 |
| TOTAL: 23:57:09.894 | 23:57:09.134 | 100.0% | - | - | - | - |
nnrpd timer:
| Code region | Time | Pct | Invoked | Min(ms) | Avg(ms) | Max(ms) |
|---|---|---|---|---|---|---|
| idle | 00:00:09.684 | 97.5% | 1 | 9684.000 | 9684.000 | 9684.000 |
| newnews | 00:00:00.000 | 0.0% | 0 | 0.000 | 0.000 | 0.000 |
| nntpwrite | 00:00:00.000 | 0.0% | 2 | 0.000 | 0.000 | 0.000 |
| TOTAL: 00:00:09.934 | 00:00:09.684 | 97.5% | - | - | - | - |
Control commands to INND:
| Command | Number |
|---|---|
| L | 1 |
| flush | 2 |
| flushlogs | 2 |
| go | 2 |
| logmode | 2 |
| mode | 149 |
| name | 2 |
| pause | 2 |
| paused | 2 |
| reload | 2 |
| reserve | 2 |
| TOTAL: 11 | 168 |
Control Channel:
| Sender | newgroup | rmgroup | Other | Bad PGP | DoIt | OK |
|---|---|---|---|---|---|---|
| control@usenet.org.uk | 0 | 0 | 0 | 1 | 0 | 0 |
| moderator@dana.de | 0 | 0 | 1 | 1 | 0 | 1 |
| TOTAL | 0 | 0 | 1 | 2 | 0 | 1 |
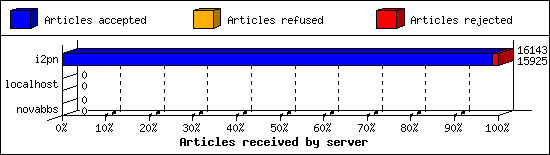
Incoming Feeds (INN):
| Server | Connects | Offered | Taken | Refused | Reject | %Accpt | Elapsed | |
|---|---|---|---|---|---|---|---|---|
| 1 | i2pn | 8 | 16143 | 15925 | 0 | 218 | 98% | 24:19:19 |
| 2 | novabbs | 2 | 0 | 0 | 0 | 0 | 0% | 00:19:05 |
| 3 | localhost | 25 | 0 | 0 | 0 | 0 | 0% | 00:00:00 |
| TOTAL: 3 | 35 | 16143 | 15925 | 0 | 218 | 98% | 24:38:24 | |
Incoming Volume (INN):
| Server | AcceptVol | DupVol | RejVol | TotalVol | %Acc | Vol/Art | |
|---|---|---|---|---|---|---|---|
| 1 | i2pn | 42.7 MB | 0.0 KB | 582.3 KB | 43.2 MB | 98% | 2.7 KB |
| 2 | novabbs | 0.0 KB | 0.0 KB | 0.0 KB | 0.0 KB | 0% | 0 |
| 3 | localhost | 0.0 KB | 0.0 KB | 0.0 KB | 0.0 KB | 0% | 0 |
| TOTAL: 3 | 42.7 MB | 0.0 KB | 582.3 KB | 43.2 MB | 98% | 2.7 KB | |

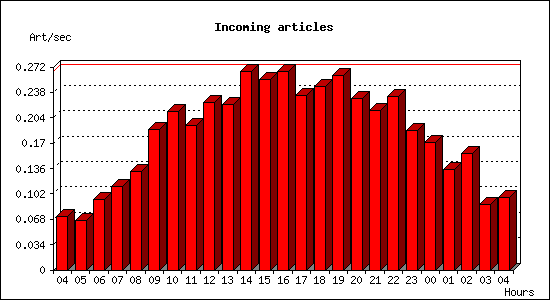
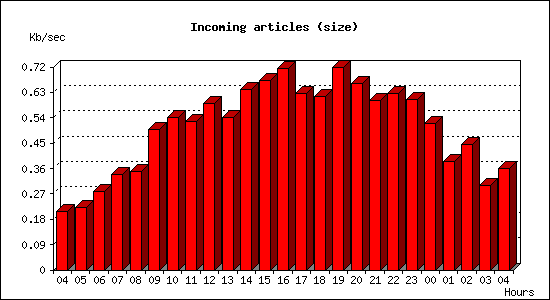
Incoming articles:
| Date | Articles | %Arts | Art/sec | Size | %Size | KB/sec |
|---|---|---|---|---|---|---|
| Jan 5 04:15:01 - 04:59:59 | 193 | 1.2% | 0.07 | 557.2 KB | 1.3% | 0.21 |
| Jan 5 05:00:00 - 05:59:59 | 237 | 1.5% | 0.07 | 798.9 KB | 1.8% | 0.22 |
| Jan 5 06:00:00 - 06:59:59 | 342 | 2.1% | 0.10 | 1004.5 KB | 2.3% | 0.28 |
| Jan 5 07:00:00 - 07:59:59 | 402 | 2.5% | 0.11 | 1.2 MB | 2.8% | 0.34 |
| Jan 5 08:00:00 - 08:59:59 | 473 | 2.9% | 0.13 | 1.2 MB | 2.8% | 0.35 |
| Jan 5 09:00:00 - 09:59:59 | 676 | 4.2% | 0.19 | 1.8 MB | 4.1% | 0.50 |
| Jan 5 10:00:00 - 10:59:59 | 766 | 4.8% | 0.21 | 1.9 MB | 4.4% | 0.54 |
| Jan 5 11:00:00 - 11:59:59 | 695 | 4.3% | 0.19 | 1.9 MB | 4.3% | 0.53 |
| Jan 5 12:00:00 - 12:59:59 | 809 | 5.0% | 0.22 | 2.1 MB | 4.8% | 0.59 |
| Jan 5 13:00:00 - 13:59:59 | 797 | 5.0% | 0.22 | 1.9 MB | 4.4% | 0.54 |
| Jan 5 14:00:00 - 14:59:59 | 959 | 6.0% | 0.27 | 2.3 MB | 5.2% | 0.64 |
| Jan 5 15:00:00 - 15:59:59 | 917 | 5.7% | 0.25 | 2.4 MB | 5.5% | 0.67 |
| Jan 5 16:00:00 - 16:59:59 | 958 | 6.0% | 0.27 | 2.5 MB | 5.8% | 0.71 |
| Jan 5 17:00:00 - 17:59:59 | 842 | 5.2% | 0.23 | 2.2 MB | 5.1% | 0.63 |
| Jan 5 18:00:00 - 18:59:59 | 887 | 5.5% | 0.25 | 2.2 MB | 5.0% | 0.62 |
| Jan 5 19:00:00 - 19:59:59 | 936 | 5.8% | 0.26 | 2.5 MB | 5.9% | 0.72 |
| Jan 5 20:00:00 - 20:59:59 | 829 | 5.2% | 0.23 | 2.3 MB | 5.4% | 0.66 |
| Jan 5 21:00:00 - 21:59:59 | 769 | 4.8% | 0.21 | 2.1 MB | 4.9% | 0.60 |
| Jan 5 22:00:00 - 22:59:59 | 836 | 5.2% | 0.23 | 2.2 MB | 5.1% | 0.63 |
| Jan 5 23:00:00 - 23:59:59 | 671 | 4.2% | 0.19 | 2.1 MB | 4.9% | 0.61 |
| Jan 6 00:00:00 - 00:59:59 | 613 | 3.8% | 0.17 | 1.8 MB | 4.2% | 0.52 |
| Jan 6 01:00:00 - 01:59:59 | 485 | 3.0% | 0.13 | 1.4 MB | 3.1% | 0.39 |
| Jan 6 02:00:00 - 02:59:59 | 564 | 3.5% | 0.16 | 1.6 MB | 3.6% | 0.44 |
| Jan 6 03:00:00 - 03:59:59 | 314 | 2.0% | 0.09 | 1.1 MB | 2.4% | 0.30 |
| Jan 6 04:00:00 - 04:15:01 | 87 | 0.5% | 0.10 | 324.4 KB | 0.7% | 0.36 |
| TOTAL: 24:00:00 | 16057 | 100.0% | 0.19 | 43.1 MB | 100.0% | 0.51 |
Sites sending bad articles:
| Server | Total | Group | Dist | Duplic | Unapp | TooOld | Site | Line | Other | |
|---|---|---|---|---|---|---|---|---|---|---|
| 1 | i2pn | 595 | 25 | 0 | 0 | 0 | 0 | 0 | 0 | 570 |
| TOTAL: 1 | 595 | 25 | 0 | 0 | 0 | 0 | 0 | 0 | 570 | |
Unwanted newsgroups [Top 20]:
| Newsgroup | Count |
|---|---|
| free.it.religioni.scientology | 8 |
| borland.public.test | 2 |
| alt.politics.scorched-earth | 2 |
| alt.philosophy | 2 |
| bit.listserv.catholic | 2 |
| alt.christian.religion | 1 |
| alt.poetry | 1 |
| alt.history | 1 |
| alt.religion.christian.catholic | 1 |
| alt.arts.poetry | 1 |
| alt.fun.with.tob | 1 |
| alt.2600.hackers | 1 |
| alt.pub.cafe-bob | 1 |
| alt.religion | 1 |
| TOTAL: 14 | 25 |
INND Perl filter [Top 20]:
| Reason | Count |
|---|---|
| unwanted post sub5 | 143 |
| unwanted post path1 | 33 |
| unwanted post sub6 | 9 |
| unwanted post path3 | 5 |
| unwanted post sub7 | 3 |
| unwanted post sub1 | 1 |
| EMP (phl) | 1 |
| TOTAL: 7 | 195 |
Miscellaneous innd statistics [Top 10]:
| Event | Server | Number |
|---|---|---|
| Including strange strings | ||
| i2pn | 375 | |
| TOTAL: 1 | 375 | |
| TOTAL: 1 | 375 | |
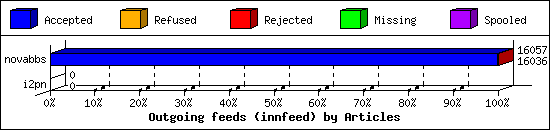
Outgoing Feeds (innfeed) by Articles:
| Server | Offered | Taken | Refused | Reject | Miss | Spool | %Took | Elapsed | |
|---|---|---|---|---|---|---|---|---|---|
| 1 | novabbs | 16058 | 16036 | 0 | 21 | 0 | 0 | 99% | 23:59:57 |
| 2 | i2pn | 0 | 0 | 0 | 0 | 0 | 0 | 0% | 00:10:00 |
| TOTAL: 2 | 16058 | 16036 | 0 | 21 | 0 | 0 | 99% | 24:09:57 | |
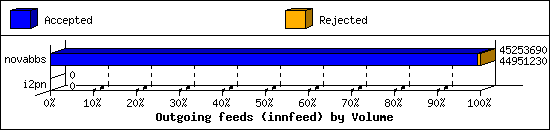
Outgoing Feeds (innfeed) by Volume:
| Server | AcceptVol | RejectVol | TotalVol | Volume/sec | Vol/Art | Elapsed | |
|---|---|---|---|---|---|---|---|
| 1 | novabbs | 42.9 MB | 295.4 KB | 43.2 MB | 0.5 KB/s | 2.8 KB | 23:59:57 |
| 2 | i2pn | 0.0 KB | 0.0 KB | 0.0 KB | 0.0 KB/s | 0 | 00:10:00 |
| TOTAL: 2 | 42.9 MB | 295.4 KB | 43.2 MB | 0.5 KB/s | 2.8 KB | 24:09:57 | |
NNRP readership statistics:
| System | Conn | Arts | Size | Groups | Post | Rej | Elapsed | |
|---|---|---|---|---|---|---|---|---|
| 1 | 104.131.137.66 | 1 | 0 | 0.0 KB | 0 | 0 | 0 | 00:00:09 |
| TOTAL: 1 | 1 | 0 | 0.0 KB | 0 | 0 | 0 | 00:00:09 | |
NNRP readership statistics (by domain):
| System | Conn | Arts | Size | Groups | Post | Rej | Elapsed | |
|---|---|---|---|---|---|---|---|---|
| 1 | unresolved | 1 | 0 | 0.0 KB | 0 | 0 | 0 | 00:00:09 |
| TOTAL: 1 | 1 | 0 | 0.0 KB | 0 | 0 | 0 | 00:00:09 | |
NNRP total resource statistics [Top 20]:
| System | User(ms) | System(ms) | Idle(ms) | Elapsed |
|---|---|---|---|---|
| 104.131.137.66 | 0.044 | 0.016 | 0.000 | 00:00:09 |
| TOTAL: 1 | 0.044 | 0.016 | 0.000 | 00:00:09 |
