
Log entries by program:
| Program name | Lines | %Lines | Size | %Size |
|---|---|---|---|---|
| inn | 19070 | 90.7% | 1.6 MB | 85.9% |
| innd | 1272 | 6.0% | 185.5 KB | 10.0% |
| innfeed | 661 | 3.1% | 72.4 KB | 3.9% |
| nnrpd | 25 | 0.1% | 2.5 KB | 0.1% |
| controlchan | 1 | 0.0% | 0.1 KB | 0.0% |
| TOTAL: 5 | 21029 | 100.0% | 1.8 MB | 100.0% |
History cache:
| Reason | Count | %Count |
|---|---|---|
| Do not exist | 18486 | 96.6% |
| Negative hits | 575 | 3.0% |
| Positive hits | 55 | 0.3% |
| Cache misses | 15 | 0.1% |
| TOTAL: 4 | 19131 | 100.0% |
INND timer:
| Code region | Time | Pct | Invoked | Min(ms) | Avg(ms) | Max(ms) |
|---|---|---|---|---|---|---|
| article cancel | 00:00:00.014 | 0.0% | 89 | 0.000 | 0.157 | 1.000 |
| article cleanup | 00:00:00.090 | 0.0% | 18488 | 0.000 | 0.005 | 0.024 |
| article logging | 00:00:00.513 | 0.0% | 18991 | 0.000 | 0.027 | 0.098 |
| article parse | 00:00:00.280 | 0.0% | 20600 | 0.000 | 0.014 | 0.041 |
| article write | 00:00:02.739 | 0.0% | 18165 | 0.045 | 0.151 | 0.333 |
| artlog/artcncl | 00:00:00.001 | 0.0% | 89 | 0.000 | 0.011 | 1.000 |
| data move | 00:00:00.011 | 0.0% | 23414 | 0.000 | 0.000 | 0.009 |
| hisgrep/artcncl | 00:00:00.002 | 0.0% | 70 | 0.000 | 0.029 | 0.143 |
| hishave/artcncl | 00:00:00.000 | 0.0% | 89 | 0.000 | 0.000 | 0.000 |
| history grep | 00:00:00.000 | 0.0% | 0 | 0.000 | 0.000 | 0.000 |
| history lookup | 00:00:00.068 | 0.0% | 19071 | 0.000 | 0.004 | 0.024 |
| history sync | 00:00:00.009 | 0.0% | 309 | 0.000 | 0.029 | 0.500 |
| history write | 00:00:00.591 | 0.0% | 18488 | 0.000 | 0.032 | 0.134 |
| hiswrite/artcncl | 00:00:00.000 | 0.0% | 19 | 0.000 | 0.000 | 0.000 |
| idle | 24:00:02.060 | 100.0% | 21436 | 2157.968 | 4030.699 | 10346.931 |
| nntp read | 00:00:00.589 | 0.0% | 21204 | 0.000 | 0.028 | 0.071 |
| overview write | 00:00:01.135 | 0.0% | 18165 | 0.000 | 0.062 | 0.182 |
| perl filter | 00:00:11.552 | 0.0% | 18488 | 0.463 | 0.625 | 0.860 |
| python filter | 00:00:00.000 | 0.0% | 0 | 0.000 | 0.000 | 0.000 |
| site send | 00:00:00.933 | 0.0% | 18165 | 0.000 | 0.051 | 0.113 |
| TOTAL: 24:00:23.754 | 24:00:20.587 | 100.0% | - | - | - | - |
INNfeed timer:
| Code region | Time | Pct | Invoked | Min(ms) | Avg(ms) | Max(ms) |
|---|---|---|---|---|---|---|
| article new | 00:00:00.039 | 0.0% | 18153 | 0.000 | 0.002 | 0.023 |
| article prepare | 00:00:00.007 | 0.0% | 72584 | 0.000 | 0.000 | 0.002 |
| article read | 00:00:00.679 | 0.0% | 18146 | 0.000 | 0.037 | 0.431 |
| backlog stats | 00:00:00.021 | 0.0% | 59823 | 0.000 | 0.000 | 0.005 |
| callbacks | 00:00:00.000 | 0.0% | 0 | 0.000 | 0.000 | 0.000 |
| data read | 00:00:00.306 | 0.0% | 36823 | 0.000 | 0.008 | 0.025 |
| data write | 00:00:00.383 | 0.0% | 18694 | 0.000 | 0.020 | 0.062 |
| idle | 23:58:08.015 | 100.0% | 59823 | 865.811 | 1442.389 | 3600.862 |
| status file | 00:00:00.067 | 0.0% | 197 | 0.000 | 0.340 | 1.000 |
| TOTAL: 23:58:10.340 | 23:58:09.517 | 100.0% | - | - | - | - |
nnrpd timer:
| Code region | Time | Pct | Invoked | Min(ms) | Avg(ms) | Max(ms) |
|---|---|---|---|---|---|---|
| idle | 00:00:05.583 | 58.6% | 7 | 88.000 | 797.571 | 3192.000 |
| newnews | 00:00:00.000 | 0.0% | 0 | 0.000 | 0.000 | 0.000 |
| nntpwrite | 00:00:00.000 | 0.0% | 18 | 0.000 | 0.000 | 0.000 |
| TOTAL: 00:00:09.528 | 00:00:05.583 | 58.6% | - | - | - | - |
Control commands to INND:
| Command | Number |
|---|---|
| L | 1 |
| flush | 2 |
| flushlogs | 2 |
| go | 2 |
| logmode | 2 |
| mode | 149 |
| name | 2 |
| pause | 2 |
| paused | 2 |
| reload | 2 |
| reserve | 2 |
| TOTAL: 11 | 168 |
Incoming Feeds (INN):
| Server | Connects | Offered | Taken | Refused | Reject | %Accpt | Elapsed | |
|---|---|---|---|---|---|---|---|---|
| 1 | i2pn | 7 | 18401 | 18082 | 0 | 319 | 98% | 24:33:15 |
| 2 | localhost | 25 | 0 | 0 | 0 | 0 | 0% | 00:00:00 |
| 3 | novabbs | 6 | 0 | 0 | 0 | 0 | 0% | 00:57:16 |
| TOTAL: 3 | 38 | 18401 | 18082 | 0 | 319 | 98% | 25:30:31 | |
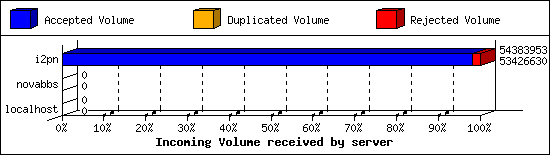
Incoming Volume (INN):
| Server | AcceptVol | DupVol | RejVol | TotalVol | %Acc | Vol/Art | |
|---|---|---|---|---|---|---|---|
| 1 | i2pn | 51.0 MB | 0.0 KB | 934.9 KB | 51.9 MB | 98% | 2.9 KB |
| 2 | localhost | 0.0 KB | 0.0 KB | 0.0 KB | 0.0 KB | 0% | 0 |
| 3 | novabbs | 0.0 KB | 0.0 KB | 0.0 KB | 0.0 KB | 0% | 0 |
| TOTAL: 3 | 51.0 MB | 0.0 KB | 934.9 KB | 51.9 MB | 98% | 2.9 KB | |
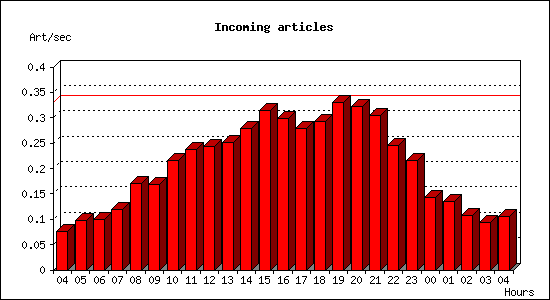
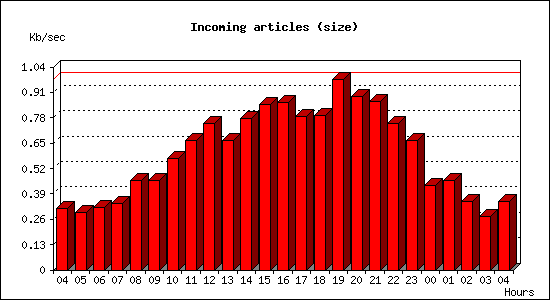
Incoming articles:
| Date | Articles | %Arts | Art/sec | Size | %Size | KB/sec |
|---|---|---|---|---|---|---|
| Jan 7 04:15:02 - 04:59:59 | 206 | 1.1% | 0.08 | 845.2 KB | 1.6% | 0.31 |
| Jan 7 05:00:00 - 05:59:59 | 350 | 1.9% | 0.10 | 1.0 MB | 2.0% | 0.30 |
| Jan 7 06:00:00 - 06:59:59 | 355 | 2.0% | 0.10 | 1.1 MB | 2.2% | 0.32 |
| Jan 7 07:00:00 - 07:59:59 | 432 | 2.4% | 0.12 | 1.2 MB | 2.3% | 0.34 |
| Jan 7 08:00:00 - 08:59:59 | 615 | 3.4% | 0.17 | 1.6 MB | 3.1% | 0.46 |
| Jan 7 09:00:00 - 09:59:59 | 607 | 3.3% | 0.17 | 1.6 MB | 3.1% | 0.46 |
| Jan 7 10:00:00 - 10:59:59 | 779 | 4.3% | 0.22 | 2.0 MB | 3.9% | 0.57 |
| Jan 7 11:00:00 - 11:59:59 | 853 | 4.7% | 0.24 | 2.3 MB | 4.5% | 0.66 |
| Jan 7 12:00:00 - 12:59:59 | 878 | 4.8% | 0.24 | 2.6 MB | 5.2% | 0.75 |
| Jan 7 13:00:00 - 13:59:59 | 902 | 5.0% | 0.25 | 2.3 MB | 4.6% | 0.66 |
| Jan 7 14:00:00 - 14:59:59 | 1004 | 5.5% | 0.28 | 2.7 MB | 5.3% | 0.78 |
| Jan 7 15:00:00 - 15:59:59 | 1129 | 6.2% | 0.31 | 3.0 MB | 5.8% | 0.85 |
| Jan 7 16:00:00 - 16:59:59 | 1077 | 5.9% | 0.30 | 3.0 MB | 5.9% | 0.86 |
| Jan 7 17:00:00 - 17:59:59 | 1007 | 5.5% | 0.28 | 2.8 MB | 5.4% | 0.79 |
| Jan 7 18:00:00 - 18:59:59 | 1050 | 5.8% | 0.29 | 2.8 MB | 5.4% | 0.79 |
| Jan 7 19:00:00 - 19:59:59 | 1189 | 6.5% | 0.33 | 3.4 MB | 6.7% | 0.98 |
| Jan 7 20:00:00 - 20:59:59 | 1157 | 6.4% | 0.32 | 3.1 MB | 6.1% | 0.89 |
| Jan 7 21:00:00 - 21:59:59 | 1095 | 6.0% | 0.30 | 3.0 MB | 5.9% | 0.86 |
| Jan 7 22:00:00 - 22:59:59 | 880 | 4.8% | 0.24 | 2.6 MB | 5.2% | 0.75 |
| Jan 7 23:00:00 - 23:59:59 | 780 | 4.3% | 0.22 | 2.3 MB | 4.5% | 0.66 |
| Jan 8 00:00:00 - 00:59:59 | 511 | 2.8% | 0.14 | 1.5 MB | 3.0% | 0.43 |
| Jan 8 01:00:00 - 01:59:59 | 484 | 2.7% | 0.13 | 1.6 MB | 3.1% | 0.46 |
| Jan 8 02:00:00 - 02:59:59 | 384 | 2.1% | 0.11 | 1.2 MB | 2.4% | 0.35 |
| Jan 8 03:00:00 - 03:59:59 | 339 | 1.9% | 0.09 | 982.2 KB | 1.9% | 0.27 |
| Jan 8 04:00:00 - 04:15:01 | 95 | 0.5% | 0.11 | 317.1 KB | 0.6% | 0.35 |
| TOTAL: 23:59:59 | 18158 | 100.0% | 0.21 | 51.2 MB | 100.0% | 0.61 |
Sites sending bad articles:
| Server | Total | Group | Dist | Duplic | Unapp | TooOld | Site | Line | Other | |
|---|---|---|---|---|---|---|---|---|---|---|
| 1 | i2pn | 823 | 28 | 0 | 0 | 0 | 0 | 0 | 0 | 795 |
| TOTAL: 1 | 823 | 28 | 0 | 0 | 0 | 0 | 0 | 0 | 795 | |
Unwanted newsgroups [Top 20]:
| Newsgroup | Count |
|---|---|
| gmane.comp.gis.openstreetmap.josm.devel | 6 |
| alt.philosophy | 3 |
| alt.christian.bible | 3 |
| alt.2600.hackers | 2 |
| alt.christian.religion | 2 |
| alt.computer.workshop | 2 |
| borland.public.test | 1 |
| alt.religion | 1 |
| free.it.religioni.scientology | 1 |
| alt.support.chronic.pain | 1 |
| alt.history | 1 |
| alt.religion.christian.catholic | 1 |
| bit.listserv.catholic | 1 |
| alt.christnet.christnews | 1 |
| alt.fun.with.tob | 1 |
| alt.pub.cafe-bob | 1 |
| TOTAL: 16 | 28 |
INND Perl filter [Top 20]:
| Reason | Count |
|---|---|
| unwanted post sub5 | 154 |
| unwanted post path1 | 99 |
| unwanted post sub6 | 30 |
| unwanted post sub1 | 5 |
| unwanted post sub7 | 4 |
| unwanted post path3 | 2 |
| TOTAL: 6 | 294 |
Miscellaneous innd statistics [Top 10]:
| Event | Server | Number |
|---|---|---|
| Including strange strings | ||
| i2pn | 501 | |
| TOTAL: 1 | 501 | |
| TOTAL: 1 | 501 | |
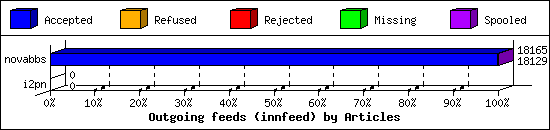
Outgoing Feeds (innfeed) by Articles:
| Server | Offered | Taken | Refused | Reject | Miss | Spool | %Took | Elapsed | |
|---|---|---|---|---|---|---|---|---|---|
| 1 | novabbs | 18161 | 18129 | 0 | 29 | 0 | 7 | 99% | 23:59:44 |
| 2 | i2pn | 0 | 0 | 0 | 0 | 0 | 0 | 0% | 00:10:00 |
| TOTAL: 2 | 18161 | 18129 | 0 | 29 | 0 | 7 | 99% | 24:09:44 | |
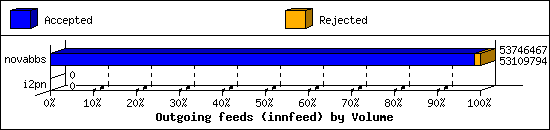
Outgoing Feeds (innfeed) by Volume:
| Server | AcceptVol | RejectVol | TotalVol | Volume/sec | Vol/Art | Elapsed | |
|---|---|---|---|---|---|---|---|
| 1 | novabbs | 50.6 MB | 621.8 KB | 51.3 MB | 0.6 KB/s | 2.9 KB | 23:59:44 |
| 2 | i2pn | 0.0 KB | 0.0 KB | 0.0 KB | 0.0 KB/s | 0 | 00:10:00 |
| TOTAL: 2 | 50.6 MB | 621.8 KB | 51.3 MB | 0.6 KB/s | 2.9 KB | 24:09:44 | |
NNRP readership statistics:
| System | Conn | Arts | Size | Groups | Post | Rej | Elapsed | |
|---|---|---|---|---|---|---|---|---|
| 1 | min-do-in-11-07-28769-e-prod.binaryedge.ninja | 1 | 0 | 0.0 KB | 0 | 0 | 0 | 00:00:01 |
| 2 | 164.52.24.176 | 3 | 0 | 0.0 KB | 0 | 0 | 0 | 00:00:07 |
| TOTAL: 2 | 4 | 0 | 0.0 KB | 0 | 0 | 0 | 00:00:09 | |
NNRP readership statistics (by domain):
| System | Conn | Arts | Size | Groups | Post | Rej | Elapsed | |
|---|---|---|---|---|---|---|---|---|
| 1 | *.binaryedge.ninja | 1 | 0 | 0.0 KB | 0 | 0 | 0 | 00:00:01 |
| 2 | unresolved | 3 | 0 | 0.0 KB | 0 | 0 | 0 | 00:00:07 |
| TOTAL: 2 | 4 | 0 | 0.0 KB | 0 | 0 | 0 | 00:00:09 | |
NNRP total resource statistics [Top 20]:
| System | User(ms) | System(ms) | Idle(ms) | Elapsed |
|---|---|---|---|---|
| 164.52.24.176 | 0.128 | 0.024 | 0.000 | 00:00:07 |
| min-do-in-11-07-28769-e-prod.binaryedge.ninja | 0.052 | 0.004 | 0.000 | 00:00:01 |
| TOTAL: 2 | 0.180 | 0.028 | 0.000 | 00:00:09 |
NNRP unrecognized commands (by host):
| System | Conn |
|---|---|
| 164.52.24.176 | 2 |
| TOTAL: 1 | 2 |
NNRP unrecognized commands (by command):
| Command | Count |
|---|---|
| #026#003#001#001"#001 | 1 |
| À/À+À'À#À#023À | 1 |
| TOTAL: 2 | 2 |
NNRP client timeouts [Top 20]:
| System | Conn | Peer |
|---|---|---|
| 164.52.24.176 | 2 | 3 |
| TOTAL: 1 | 2 | 3 |
