
Log entries by program:
| Program name | Lines | %Lines | Size | %Size |
|---|---|---|---|---|
| inn | 19872 | 91.7% | 1.6 MB | 87.1% |
| innd | 1138 | 5.2% | 171.5 KB | 9.1% |
| innfeed | 660 | 3.0% | 71.9 KB | 3.8% |
| nnrpd | 7 | 0.0% | 0.8 KB | 0.0% |
| controlchan | 1 | 0.0% | 0.0 KB | 0.0% |
| TOTAL: 5 | 21678 | 100.0% | 1.8 MB | 100.0% |
History cache:
| Reason | Count | %Count |
|---|---|---|
| Do not exist | 19465 | 98.0% |
| Negative hits | 305 | 1.5% |
| Positive hits | 55 | 0.3% |
| Cache misses | 45 | 0.2% |
| TOTAL: 4 | 19870 | 100.0% |
INND timer:
| Code region | Time | Pct | Invoked | Min(ms) | Avg(ms) | Max(ms) |
|---|---|---|---|---|---|---|
| article cancel | 00:00:00.044 | 0.0% | 126 | 0.000 | 0.349 | 13.000 |
| article cleanup | 00:00:00.096 | 0.0% | 19450 | 0.000 | 0.005 | 0.029 |
| article logging | 00:00:00.546 | 0.0% | 19743 | 0.000 | 0.028 | 0.068 |
| article parse | 00:00:00.277 | 0.0% | 21259 | 0.000 | 0.013 | 0.049 |
| article write | 00:00:02.772 | 0.0% | 19294 | 0.022 | 0.144 | 0.463 |
| artlog/artcncl | 00:00:00.001 | 0.0% | 125 | 0.000 | 0.008 | 0.032 |
| artlog/artwrite | 00:00:00.000 | 0.0% | 5 | 0.000 | 0.000 | 0.000 |
| data move | 00:00:00.013 | 0.0% | 23323 | 0.000 | 0.001 | 0.010 |
| hisgrep/artcncl | 00:00:00.002 | 0.0% | 100 | 0.000 | 0.020 | 1.000 |
| hishave/artcncl | 00:00:00.000 | 0.0% | 126 | 0.000 | 0.000 | 0.000 |
| history grep | 00:00:00.000 | 0.0% | 0 | 0.000 | 0.000 | 0.000 |
| history lookup | 00:00:00.078 | 0.0% | 19764 | 0.000 | 0.004 | 0.042 |
| history sync | 00:00:00.012 | 0.0% | 306 | 0.000 | 0.039 | 0.500 |
| history write | 00:00:00.615 | 0.0% | 19445 | 0.000 | 0.032 | 0.160 |
| hiswrite/artcncl | 00:00:00.000 | 0.0% | 26 | 0.000 | 0.000 | 0.000 |
| idle | 24:00:01.508 | 100.0% | 21701 | 572.549 | 3981.453 | 600086.000 |
| nntp read | 00:00:00.569 | 0.0% | 21471 | 0.000 | 0.027 | 0.071 |
| overview write | 00:00:01.077 | 0.0% | 19289 | 0.010 | 0.056 | 0.269 |
| perl filter | 00:00:11.662 | 0.0% | 19450 | 0.445 | 0.600 | 0.764 |
| python filter | 00:00:00.000 | 0.0% | 0 | 0.000 | 0.000 | 0.000 |
| site send | 00:00:00.913 | 0.0% | 19289 | 0.000 | 0.047 | 0.112 |
| TOTAL: 24:00:23.064 | 24:00:20.185 | 100.0% | - | - | - | - |
INNfeed timer:
| Code region | Time | Pct | Invoked | Min(ms) | Avg(ms) | Max(ms) |
|---|---|---|---|---|---|---|
| article new | 00:00:00.035 | 0.0% | 19291 | 0.000 | 0.002 | 0.017 |
| article prepare | 00:00:00.011 | 0.0% | 77116 | 0.000 | 0.000 | 0.004 |
| article read | 00:00:00.735 | 0.0% | 19279 | 0.000 | 0.038 | 0.426 |
| backlog stats | 00:00:00.023 | 0.0% | 62488 | 0.000 | 0.000 | 0.004 |
| callbacks | 00:00:00.000 | 0.0% | 0 | 0.000 | 0.000 | 0.000 |
| data read | 00:00:00.295 | 0.0% | 38664 | 0.000 | 0.008 | 0.034 |
| data write | 00:00:00.444 | 0.0% | 19573 | 0.000 | 0.023 | 0.071 |
| idle | 23:57:48.864 | 100.0% | 62488 | 246.274 | 1380.567 | 22270.778 |
| status file | 00:00:00.289 | 0.0% | 185 | 0.000 | 1.562 | 38.500 |
| TOTAL: 23:57:51.579 | 23:57:50.696 | 100.0% | - | - | - | - |
nnrpd timer:
| Code region | Time | Pct | Invoked | Min(ms) | Avg(ms) | Max(ms) |
|---|---|---|---|---|---|---|
| idle | 00:00:00.000 | 0.0% | 2 | 0.000 | 0.000 | 0.000 |
| newnews | 00:00:00.000 | 0.0% | 0 | 0.000 | 0.000 | 0.000 |
| nntpwrite | 00:00:00.000 | 0.0% | 11 | 0.000 | 0.000 | 0.000 |
| TOTAL: 00:00:05.545 | 00:00:00.000 | 0.0% | - | - | - | - |
Control commands to INND:
| Command | Number |
|---|---|
| L | 1 |
| flush | 2 |
| flushlogs | 2 |
| go | 2 |
| logmode | 2 |
| mode | 149 |
| name | 2 |
| pause | 2 |
| paused | 2 |
| reload | 2 |
| reserve | 2 |
| TOTAL: 11 | 168 |
Incoming Feeds (INN):
| Server | Connects | Offered | Taken | Refused | Reject | %Accpt | Elapsed | |
|---|---|---|---|---|---|---|---|---|
| 1 | i2pn | 13 | 19323 | 19162 | 0 | 161 | 99% | 24:12:28 |
| 2 | novabbs | 2 | 0 | 0 | 0 | 0 | 0% | 00:19:05 |
| 3 | localhost | 25 | 0 | 0 | 0 | 0 | 0% | 00:00:00 |
| TOTAL: 3 | 40 | 19323 | 19162 | 0 | 161 | 99% | 24:31:33 | |
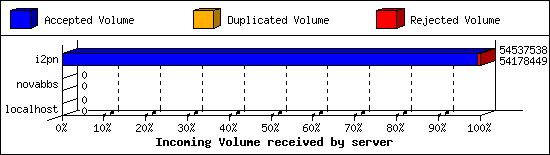
Incoming Volume (INN):
| Server | AcceptVol | DupVol | RejVol | TotalVol | %Acc | Vol/Art | |
|---|---|---|---|---|---|---|---|
| 1 | i2pn | 51.7 MB | 0.0 KB | 350.7 KB | 52.0 MB | 99% | 2.8 KB |
| 2 | novabbs | 0.0 KB | 0.0 KB | 0.0 KB | 0.0 KB | 0% | 0 |
| 3 | localhost | 0.0 KB | 0.0 KB | 0.0 KB | 0.0 KB | 0% | 0 |
| TOTAL: 3 | 51.7 MB | 0.0 KB | 350.7 KB | 52.0 MB | 99% | 2.8 KB | |
Incoming articles:
| Date | Articles | %Arts | Art/sec | Size | %Size | KB/sec |
|---|---|---|---|---|---|---|
| Jan 9 04:15:01 - 04:59:59 | 284 | 1.5% | 0.11 | 845.4 KB | 1.6% | 0.31 |
| Jan 9 05:00:00 - 05:59:59 | 376 | 1.9% | 0.10 | 1.1 MB | 2.1% | 0.31 |
| Jan 9 06:00:00 - 06:59:59 | 456 | 2.4% | 0.13 | 1.3 MB | 2.5% | 0.37 |
| Jan 9 07:00:00 - 07:59:59 | 609 | 3.2% | 0.17 | 1.6 MB | 3.0% | 0.45 |
| Jan 9 08:00:00 - 08:59:59 | 1317 | 6.8% | 0.37 | 3.5 MB | 6.7% | 0.99 |
| Jan 9 09:00:00 - 09:59:59 | 857 | 4.4% | 0.24 | 2.2 MB | 4.3% | 0.63 |
| Jan 9 10:00:00 - 10:59:59 | 834 | 4.3% | 0.23 | 2.3 MB | 4.4% | 0.65 |
| Jan 9 11:00:00 - 11:59:59 | 934 | 4.8% | 0.26 | 2.5 MB | 4.7% | 0.70 |
| Jan 9 12:00:00 - 12:59:59 | 778 | 4.0% | 0.22 | 1.9 MB | 3.6% | 0.53 |
| Jan 9 13:00:00 - 13:59:59 | 884 | 4.6% | 0.25 | 2.1 MB | 4.1% | 0.60 |
| Jan 9 14:00:00 - 14:59:59 | 869 | 4.5% | 0.24 | 2.3 MB | 4.4% | 0.66 |
| Jan 9 15:00:00 - 15:59:59 | 1064 | 5.5% | 0.30 | 2.8 MB | 5.4% | 0.79 |
| Jan 9 16:00:00 - 16:59:59 | 1172 | 6.1% | 0.33 | 3.2 MB | 6.1% | 0.91 |
| Jan 9 17:00:00 - 17:59:59 | 1115 | 5.8% | 0.31 | 2.9 MB | 5.7% | 0.84 |
| Jan 9 18:00:00 - 18:59:59 | 1176 | 6.1% | 0.33 | 3.2 MB | 6.1% | 0.90 |
| Jan 9 19:00:00 - 19:59:59 | 1106 | 5.7% | 0.31 | 2.9 MB | 5.5% | 0.81 |
| Jan 9 20:00:00 - 20:59:59 | 972 | 5.0% | 0.27 | 2.5 MB | 4.9% | 0.72 |
| Jan 9 21:00:00 - 21:59:59 | 949 | 4.9% | 0.26 | 2.7 MB | 5.2% | 0.76 |
| Jan 9 22:00:00 - 22:59:59 | 637 | 3.3% | 0.18 | 1.8 MB | 3.5% | 0.52 |
| Jan 9 23:00:00 - 23:59:59 | 894 | 4.6% | 0.25 | 2.7 MB | 5.2% | 0.76 |
| Jan 10 00:00:00 - 00:59:59 | 556 | 2.9% | 0.15 | 1.6 MB | 3.1% | 0.46 |
| Jan 10 01:00:00 - 01:59:59 | 554 | 2.9% | 0.15 | 1.6 MB | 3.1% | 0.46 |
| Jan 10 02:00:00 - 02:59:59 | 478 | 2.5% | 0.13 | 1.4 MB | 2.8% | 0.41 |
| Jan 10 03:00:00 - 03:59:59 | 333 | 1.7% | 0.09 | 949.2 KB | 1.8% | 0.26 |
| Jan 10 04:00:00 - 04:15:01 | 84 | 0.4% | 0.09 | 213.1 KB | 0.4% | 0.24 |
| TOTAL: 24:00:00 | 19288 | 100.0% | 0.22 | 52.0 MB | 100.0% | 0.62 |


Sites sending bad articles:
| Server | Total | Group | Dist | Duplic | Unapp | TooOld | Site | Line | Other | |
|---|---|---|---|---|---|---|---|---|---|---|
| 1 | i2pn | 459 | 16 | 0 | 0 | 0 | 0 | 0 | 0 | 443 |
| TOTAL: 1 | 459 | 16 | 0 | 0 | 0 | 0 | 0 | 0 | 443 | |
Unwanted newsgroups [Top 20]:
| Newsgroup | Count |
|---|---|
| alt.support.chronic.pain | 2 |
| alt.religion.christian.jesus-connect | 2 |
| alt.2600.debate.winged-personifications | 2 |
| alt.philosophy | 2 |
| alt.politics.republican | 1 |
| alt.christian.bible | 1 |
| alt.rasap | 1 |
| alt.travel.marketplace | 1 |
| alt.christnet.religion | 1 |
| alt.fun.with.tob | 1 |
| lada.hard | 1 |
| alt.fetish.feet | 1 |
| TOTAL: 12 | 16 |
INND Perl filter [Top 20]:
| Reason | Count |
|---|---|
| unwanted post sub5 | 95 |
| unwanted post path1 | 24 |
| unwanted post sub6 | 19 |
| unwanted post path3 | 2 |
| TOTAL: 4 | 140 |
Miscellaneous innd statistics [Top 10]:
| Event | Server | Number |
|---|---|---|
| Including strange strings | ||
| i2pn | 298 | |
| TOTAL: 1 | 298 | |
| TOTAL: 1 | 298 | |
Outgoing Feeds (innfeed) by Articles:
| Server | Offered | Taken | Refused | Reject | Miss | Spool | %Took | Elapsed | |
|---|---|---|---|---|---|---|---|---|---|
| 1 | novabbs | 19291 | 19269 | 0 | 19 | 0 | 12 | 99% | 23:09:23 |
| 2 | i2pn | 0 | 0 | 0 | 0 | 0 | 0 | 0% | 00:10:00 |
| TOTAL: 2 | 19291 | 19269 | 0 | 19 | 0 | 12 | 99% | 23:19:23 | |

Outgoing Feeds (innfeed) by Volume:
| Server | AcceptVol | RejectVol | TotalVol | Volume/sec | Vol/Art | Elapsed | |
|---|---|---|---|---|---|---|---|
| 1 | novabbs | 51.8 MB | 245.3 KB | 52.0 MB | 0.6 KB/s | 2.8 KB | 23:09:23 |
| 2 | i2pn | 0.0 KB | 0.0 KB | 0.0 KB | 0.0 KB/s | 0 | 00:10:00 |
| TOTAL: 2 | 51.8 MB | 245.3 KB | 52.0 MB | 0.6 KB/s | 2.8 KB | 23:19:23 | |

NNRP readership statistics:
| System | Conn | Arts | Size | Groups | Post | Rej | Elapsed | |
|---|---|---|---|---|---|---|---|---|
| 1 | scan-141.security.ipip.net | 1 | 0 | 0.0 KB | 0 | 0 | 0 | 00:00:05 |
| TOTAL: 1 | 1 | 0 | 0.0 KB | 0 | 0 | 0 | 00:00:05 | |
NNRP readership statistics (by domain):
| System | Conn | Arts | Size | Groups | Post | Rej | Elapsed | |
|---|---|---|---|---|---|---|---|---|
| 1 | *.security.ipip.net | 1 | 0 | 0.0 KB | 0 | 0 | 0 | 00:00:05 |
| TOTAL: 1 | 1 | 0 | 0.0 KB | 0 | 0 | 0 | 00:00:05 | |
NNRP total resource statistics [Top 20]:
| System | User(ms) | System(ms) | Idle(ms) | Elapsed |
|---|---|---|---|---|
| scan-141.security.ipip.net | 0.044 | 0.008 | 0.000 | 00:00:05 |
| TOTAL: 1 | 0.044 | 0.008 | 0.000 | 00:00:05 |
NNRP unrecognized commands (by host):
| System | Conn |
|---|---|
| scan-141.security.ipip.net | 4 |
| TOTAL: 1 | 4 |
NNRP unrecognized commands (by command):
| Command | Count |
|---|---|
| GET / HTTP/1.1 | 1 |
| Connection: close | 1 |
| Host: 157.230.63.40:119 | 1 |
| User-Agent: HTTP Banner Detection (https... | 1 |
| TOTAL: 4 | 4 |
