Log entries by program:
| Program name | Lines | %Lines | Size | %Size |
|---|---|---|---|---|
| inn | 19139 | 91.3% | 1.6 MB | 86.5% |
| innd | 1174 | 5.6% | 182.3 KB | 9.9% |
| innfeed | 642 | 3.1% | 64.7 KB | 3.5% |
| nnrpd | 11 | 0.1% | 1.2 KB | 0.1% |
| controlchan | 1 | 0.0% | 0.1 KB | 0.0% |
| TOTAL: 5 | 20967 | 100.0% | 1.8 MB | 100.0% |
History cache:
| Reason | Count | %Count |
|---|---|---|
| Do not exist | 18723 | 98.5% |
| Negative hits | 248 | 1.3% |
| Cache misses | 18 | 0.1% |
| Positive hits | 17 | 0.1% |
| TOTAL: 4 | 19006 | 100.0% |
INND timer:
| Code region | Time | Pct | Invoked | Min(ms) | Avg(ms) | Max(ms) |
|---|---|---|---|---|---|---|
| article cancel | 00:00:00.012 | 0.0% | 43 | 0.000 | 0.279 | 1.000 |
| article cleanup | 00:00:00.102 | 0.0% | 18717 | 0.000 | 0.005 | 0.048 |
| article logging | 00:00:00.519 | 0.0% | 19045 | 0.000 | 0.027 | 0.071 |
| article parse | 00:00:00.242 | 0.0% | 20928 | 0.000 | 0.012 | 0.037 |
| article write | 00:00:02.864 | 0.0% | 18498 | 0.069 | 0.155 | 1.809 |
| artlog/artcncl | 00:00:00.000 | 0.0% | 43 | 0.000 | 0.000 | 0.000 |
| artlog/artwrite | 00:00:00.000 | 0.0% | 6 | 0.000 | 0.000 | 0.000 |
| data move | 00:00:00.011 | 0.0% | 23433 | 0.000 | 0.000 | 0.014 |
| hisgrep/artcncl | 00:00:00.002 | 0.0% | 35 | 0.000 | 0.057 | 0.500 |
| hishave/artcncl | 00:00:00.000 | 0.0% | 43 | 0.000 | 0.000 | 0.000 |
| history grep | 00:00:00.000 | 0.0% | 0 | 0.000 | 0.000 | 0.000 |
| history lookup | 00:00:00.070 | 0.0% | 18966 | 0.000 | 0.004 | 0.031 |
| history sync | 00:00:00.014 | 0.0% | 307 | 0.000 | 0.046 | 0.667 |
| history write | 00:00:00.563 | 0.0% | 18711 | 0.000 | 0.030 | 0.085 |
| hiswrite/artcncl | 00:00:00.000 | 0.0% | 8 | 0.000 | 0.000 | 0.000 |
| idle | 23:50:01.847 | 100.0% | 21414 | 2246.835 | 4006.811 | 11112.093 |
| nntp read | 00:00:00.549 | 0.0% | 21191 | 0.000 | 0.026 | 0.075 |
| overview write | 00:00:01.137 | 0.0% | 18492 | 0.000 | 0.061 | 0.239 |
| perl filter | 00:00:11.513 | 0.0% | 18717 | 0.416 | 0.615 | 1.109 |
| python filter | 00:00:00.000 | 0.0% | 0 | 0.000 | 0.000 | 0.000 |
| site send | 00:00:00.473 | 0.0% | 18492 | 0.000 | 0.026 | 0.080 |
| TOTAL: 23:50:23.013 | 23:50:19.918 | 100.0% | - | - | - | - |
INNfeed timer:
| Code region | Time | Pct | Invoked | Min(ms) | Avg(ms) | Max(ms) |
|---|---|---|---|---|---|---|
| article new | 00:00:00.036 | 0.0% | 18529 | 0.000 | 0.002 | 0.019 |
| article prepare | 00:00:00.013 | 0.0% | 74116 | 0.000 | 0.000 | 0.003 |
| article read | 00:00:00.768 | 0.0% | 18529 | 0.000 | 0.041 | 0.571 |
| backlog stats | 00:00:00.017 | 0.0% | 60508 | 0.000 | 0.000 | 0.004 |
| callbacks | 00:00:00.000 | 0.0% | 0 | 0.000 | 0.000 | 0.000 |
| data read | 00:00:00.270 | 0.0% | 37345 | 0.000 | 0.007 | 0.025 |
| data write | 00:00:00.374 | 0.0% | 18854 | 0.000 | 0.020 | 0.065 |
| idle | 23:58:14.373 | 100.0% | 60508 | 830.107 | 1426.165 | 3403.933 |
| status file | 00:00:00.050 | 0.0% | 171 | 0.000 | 0.292 | 1.000 |
| TOTAL: 23:58:16.841 | 23:58:15.901 | 100.0% | - | - | - | - |
nnrpd timer:
| Code region | Time | Pct | Invoked | Min(ms) | Avg(ms) | Max(ms) |
|---|---|---|---|---|---|---|
| idle | 00:00:00.683 | 45.1% | 4 | 79.000 | 170.750 | 262.500 |
| newnews | 00:00:00.000 | 0.0% | 0 | 0.000 | 0.000 | 0.000 |
| nntpwrite | 00:00:00.000 | 0.0% | 44 | 0.000 | 0.000 | 0.000 |
| TOTAL: 00:00:01.513 | 00:00:00.683 | 45.1% | - | - | - | - |
Control commands to INND:
| Command | Number |
|---|---|
| L | 1 |
| flush | 2 |
| flushlogs | 2 |
| go | 2 |
| logmode | 2 |
| mode | 148 |
| name | 2 |
| pause | 2 |
| paused | 2 |
| reload | 2 |
| reserve | 2 |
| TOTAL: 11 | 167 |
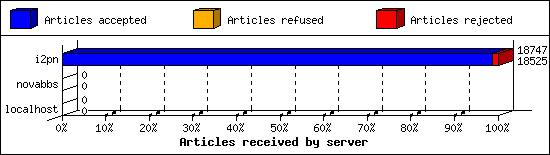
Incoming Feeds (INN):
| Server | Connects | Offered | Taken | Refused | Reject | %Accpt | Elapsed | |
|---|---|---|---|---|---|---|---|---|
| 1 | i2pn | 7 | 18747 | 18525 | 0 | 222 | 98% | 24:36:27 |
| 2 | novabbs | 2 | 0 | 0 | 0 | 0 | 0% | 00:19:05 |
| 3 | localhost | 25 | 0 | 0 | 0 | 0 | 0% | 00:00:00 |
| TOTAL: 3 | 34 | 18747 | 18525 | 0 | 222 | 98% | 24:55:32 | |
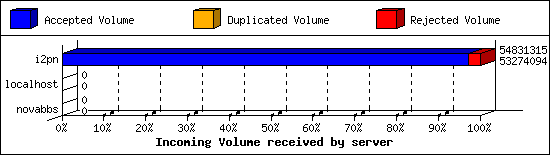
Incoming Volume (INN):
| Server | AcceptVol | DupVol | RejVol | TotalVol | %Acc | Vol/Art | |
|---|---|---|---|---|---|---|---|
| 1 | i2pn | 50.8 MB | 0.0 KB | 1.5 MB | 52.3 MB | 97% | 2.9 KB |
| 2 | novabbs | 0.0 KB | 0.0 KB | 0.0 KB | 0.0 KB | 0% | 0 |
| 3 | localhost | 0.0 KB | 0.0 KB | 0.0 KB | 0.0 KB | 0% | 0 |
| TOTAL: 3 | 50.8 MB | 0.0 KB | 1.5 MB | 52.3 MB | 97% | 2.9 KB | |
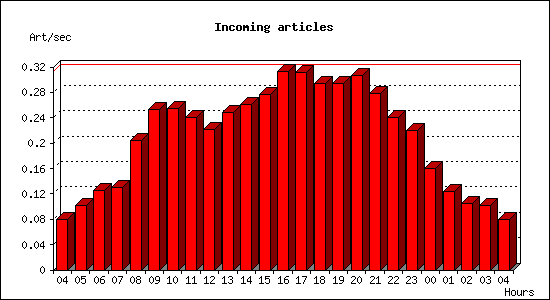
Incoming articles:
| Date | Articles | %Arts | Art/sec | Size | %Size | KB/sec |
|---|---|---|---|---|---|---|
| Jan 10 04:15:01 - 04:59:59 | 216 | 1.2% | 0.08 | 652.6 KB | 1.3% | 0.24 |
| Jan 10 05:00:00 - 05:59:59 | 366 | 2.0% | 0.10 | 1.2 MB | 2.3% | 0.33 |
| Jan 10 06:00:00 - 06:59:59 | 452 | 2.4% | 0.13 | 1.2 MB | 2.3% | 0.34 |
| Jan 10 07:00:00 - 07:59:59 | 469 | 2.5% | 0.13 | 1.3 MB | 2.6% | 0.37 |
| Jan 10 08:00:00 - 08:59:59 | 734 | 4.0% | 0.20 | 1.7 MB | 3.4% | 0.49 |
| Jan 10 09:00:00 - 09:59:59 | 913 | 4.9% | 0.25 | 2.3 MB | 4.6% | 0.67 |
| Jan 10 10:00:00 - 10:59:59 | 918 | 5.0% | 0.26 | 2.3 MB | 4.5% | 0.65 |
| Jan 10 11:00:00 - 11:59:59 | 866 | 4.7% | 0.24 | 2.0 MB | 4.0% | 0.58 |
| Jan 10 12:00:00 - 12:59:59 | 800 | 4.3% | 0.22 | 2.1 MB | 4.1% | 0.59 |
| Jan 10 13:00:00 - 13:59:59 | 894 | 4.8% | 0.25 | 2.2 MB | 4.3% | 0.62 |
| Jan 10 14:00:00 - 14:59:59 | 939 | 5.1% | 0.26 | 2.3 MB | 4.6% | 0.67 |
| Jan 10 15:00:00 - 15:59:59 | 998 | 5.4% | 0.28 | 2.7 MB | 5.4% | 0.78 |
| Jan 10 16:00:00 - 16:59:59 | 1127 | 6.1% | 0.31 | 3.0 MB | 5.9% | 0.85 |
| Jan 10 17:00:00 - 17:59:59 | 1121 | 6.0% | 0.31 | 2.9 MB | 5.7% | 0.82 |
| Jan 10 18:00:00 - 18:59:59 | 1060 | 5.7% | 0.29 | 2.8 MB | 5.4% | 0.78 |
| Jan 10 19:00:00 - 19:59:59 | 1057 | 5.7% | 0.29 | 2.9 MB | 5.8% | 0.83 |
| Jan 10 20:00:00 - 20:59:59 | 1106 | 6.0% | 0.31 | 3.3 MB | 6.5% | 0.94 |
| Jan 10 21:00:00 - 21:59:59 | 1003 | 5.4% | 0.28 | 3.2 MB | 6.2% | 0.90 |
| Jan 10 22:00:00 - 22:59:59 | 864 | 4.7% | 0.24 | 2.6 MB | 5.1% | 0.74 |
| Jan 10 23:00:00 - 23:59:59 | 789 | 4.3% | 0.22 | 2.5 MB | 4.9% | 0.71 |
| Jan 11 00:00:00 - 00:59:59 | 576 | 3.1% | 0.16 | 1.7 MB | 3.4% | 0.49 |
| Jan 11 01:00:00 - 01:59:59 | 448 | 2.4% | 0.12 | 1.6 MB | 3.1% | 0.45 |
| Jan 11 02:00:00 - 02:59:59 | 380 | 2.1% | 0.11 | 1.0 MB | 2.0% | 0.29 |
| Jan 11 03:00:00 - 03:59:59 | 368 | 2.0% | 0.10 | 1.2 MB | 2.4% | 0.35 |
| Jan 11 04:00:00 - 04:15:01 | 72 | 0.4% | 0.08 | 276.1 KB | 0.5% | 0.31 |
| TOTAL: 24:00:00 | 18536 | 100.0% | 0.21 | 50.9 MB | 100.0% | 0.60 |

Sites sending bad articles:
| Server | Total | Group | Dist | Duplic | Unapp | TooOld | Site | Line | Other | |
|---|---|---|---|---|---|---|---|---|---|---|
| 1 | i2pn | 560 | 16 | 0 | 0 | 0 | 0 | 0 | 0 | 544 |
| TOTAL: 1 | 560 | 16 | 0 | 0 | 0 | 0 | 0 | 0 | 544 | |
Unwanted newsgroups [Top 20]:
| Newsgroup | Count |
|---|---|
| alt.philosophy | 4 |
| alt.christian.bible | 3 |
| alt.slack.goathead | 3 |
| alt.sex.stories.erotic | 1 |
| alt.2600.debate.winged-personifications | 1 |
| alt.politics.republican | 1 |
| alt.sex.erotica.market | 1 |
| alt.fun.with.tob | 1 |
| alt.religion.christian.romman-catholic | 1 |
| TOTAL: 9 | 16 |
INND Perl filter [Top 20]:
| Reason | Count |
|---|---|
| unwanted post sub5 | 93 |
| unwanted post path1 | 92 |
| unwanted post sub6 | 17 |
| unwanted post sub1 | 1 |
| unwanted post path3 | 1 |
| TOTAL: 5 | 204 |
Miscellaneous innd statistics [Top 10]:
| Event | Server | Number |
|---|---|---|
| Including strange strings | ||
| i2pn | 334 | |
| TOTAL: 1 | 334 | |
| TOTAL: 1 | 334 | |
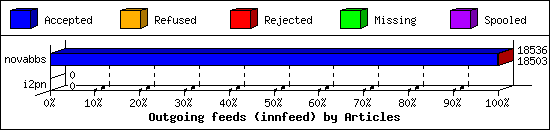
Outgoing Feeds (innfeed) by Articles:
| Server | Offered | Taken | Refused | Reject | Miss | Spool | %Took | Elapsed | |
|---|---|---|---|---|---|---|---|---|---|
| 1 | novabbs | 18538 | 18503 | 0 | 33 | 0 | 0 | 99% | 23:59:49 |
| 2 | i2pn | 0 | 0 | 0 | 0 | 0 | 0 | 0% | 00:10:00 |
| TOTAL: 2 | 18538 | 18503 | 0 | 33 | 0 | 0 | 99% | 24:09:49 | |
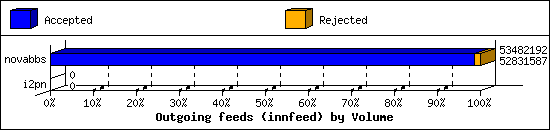
Outgoing Feeds (innfeed) by Volume:
| Server | AcceptVol | RejectVol | TotalVol | Volume/sec | Vol/Art | Elapsed | |
|---|---|---|---|---|---|---|---|
| 1 | novabbs | 50.4 MB | 635.4 KB | 51.0 MB | 0.6 KB/s | 2.8 KB | 23:59:49 |
| 2 | i2pn | 0.0 KB | 0.0 KB | 0.0 KB | 0.0 KB/s | 0 | 00:10:00 |
| TOTAL: 2 | 50.4 MB | 635.4 KB | 51.0 MB | 0.6 KB/s | 2.8 KB | 24:09:49 | |
NNRP readership statistics:
| System | Conn | Arts | Size | Groups | Post | Rej | Elapsed | |
|---|---|---|---|---|---|---|---|---|
| 1 | 125.64.94.197 | 1 | 0 | 0.0 KB | 0 | 0 | 0 | 00:00:00 |
| 2 | scan-141.security.ipip.net | 1 | 0 | 0.0 KB | 0 | 0 | 0 | 00:00:00 |
| TOTAL: 2 | 2 | 0 | 0.0 KB | 0 | 0 | 0 | 00:00:01 | |
NNRP readership statistics (by domain):
| System | Conn | Arts | Size | Groups | Post | Rej | Elapsed | |
|---|---|---|---|---|---|---|---|---|
| 1 | *.security.ipip.net | 1 | 0 | 0.0 KB | 0 | 0 | 0 | 00:00:00 |
| 2 | unresolved | 1 | 0 | 0.0 KB | 0 | 0 | 0 | 00:00:00 |
| TOTAL: 2 | 2 | 0 | 0.0 KB | 0 | 0 | 0 | 00:00:01 | |
NNRP total resource statistics [Top 20]:
| System | User(ms) | System(ms) | Idle(ms) | Elapsed |
|---|---|---|---|---|
| 125.64.94.197 | 0.040 | 0.008 | 0.000 | 00:00:00 |
| scan-141.security.ipip.net | 0.040 | 0.008 | 0.000 | 00:00:00 |
| TOTAL: 2 | 0.080 | 0.016 | 0.000 | 00:00:01 |
NNRP unrecognized commands (by host):
| System | Conn |
|---|---|
| scan-141.security.ipip.net | 4 |
| TOTAL: 1 | 4 |
NNRP unrecognized commands (by command):
| Command | Count |
|---|---|
| User-Agent: HTTP Banner Detection (https... | 1 |
| GET / HTTP/1.1 | 1 |
| Connection: close | 1 |
| Host: 157.230.63.40:119 | 1 |
| TOTAL: 4 | 4 |
