Log entries by program:
| Program name | Lines | %Lines | Size | %Size |
|---|---|---|---|---|
| inn | 18978 | 90.9% | 1.5 MB | 85.9% |
| innd | 1242 | 6.0% | 176.0 KB | 9.6% |
| innfeed | 634 | 3.0% | 80.9 KB | 4.4% |
| nnrpd | 12 | 0.1% | 1.2 KB | 0.1% |
| controlchan | 1 | 0.0% | 0.1 KB | 0.0% |
| TOTAL: 5 | 20867 | 100.0% | 1.8 MB | 100.0% |
History cache:
| Reason | Count | %Count |
|---|---|---|
| Do not exist | 18494 | 98.8% |
| Negative hits | 163 | 0.9% |
| Positive hits | 45 | 0.2% |
| Cache misses | 9 | 0.0% |
| TOTAL: 4 | 18711 | 100.0% |
INND timer:
| Code region | Time | Pct | Invoked | Min(ms) | Avg(ms) | Max(ms) |
|---|---|---|---|---|---|---|
| article cancel | 00:00:00.009 | 0.0% | 59 | 0.000 | 0.153 | 1.000 |
| article cleanup | 00:00:00.107 | 0.0% | 18538 | 0.000 | 0.006 | 0.032 |
| article logging | 00:00:00.502 | 0.0% | 18884 | 0.000 | 0.027 | 0.080 |
| article parse | 00:00:00.262 | 0.0% | 20375 | 0.000 | 0.013 | 0.052 |
| article write | 00:00:03.450 | 0.0% | 18267 | 0.051 | 0.189 | 2.482 |
| artlog/artcncl | 00:00:00.001 | 0.0% | 59 | 0.000 | 0.017 | 0.500 |
| artlog/artwrite | 00:00:00.000 | 0.0% | 10 | 0.000 | 0.000 | 0.000 |
| data move | 00:00:00.010 | 0.0% | 22435 | 0.000 | 0.000 | 0.010 |
| hisgrep/artcncl | 00:00:00.001 | 0.0% | 48 | 0.000 | 0.021 | 0.500 |
| hishave/artcncl | 00:00:00.000 | 0.0% | 59 | 0.000 | 0.000 | 0.000 |
| history grep | 00:00:00.000 | 0.0% | 0 | 0.000 | 0.000 | 0.000 |
| history lookup | 00:00:00.067 | 0.0% | 18750 | 0.000 | 0.004 | 0.025 |
| history sync | 00:00:00.010 | 0.0% | 302 | 0.000 | 0.033 | 1.000 |
| history write | 00:00:00.569 | 0.0% | 18522 | 0.000 | 0.031 | 0.084 |
| hiswrite/artcncl | 00:00:00.000 | 0.0% | 11 | 0.000 | 0.000 | 0.000 |
| idle | 24:00:00.922 | 100.0% | 20819 | 1868.729 | 4150.100 | 10171.424 |
| nntp read | 00:00:00.536 | 0.0% | 20599 | 0.000 | 0.026 | 0.061 |
| overview write | 00:00:01.293 | 0.0% | 18257 | 0.012 | 0.071 | 1.166 |
| perl filter | 00:00:11.840 | 0.0% | 18532 | 0.500 | 0.639 | 0.925 |
| python filter | 00:00:00.000 | 0.0% | 0 | 0.000 | 0.000 | 0.000 |
| site send | 00:00:00.624 | 0.0% | 18257 | 0.000 | 0.034 | 0.097 |
| TOTAL: 24:00:23.218 | 24:00:20.203 | 100.0% | - | - | - | - |
INNfeed timer:
| Code region | Time | Pct | Invoked | Min(ms) | Avg(ms) | Max(ms) |
|---|---|---|---|---|---|---|
| article new | 00:00:00.022 | 0.0% | 18257 | 0.000 | 0.001 | 0.018 |
| article prepare | 00:00:00.007 | 0.0% | 73028 | 0.000 | 0.000 | 0.003 |
| article read | 00:00:00.940 | 0.0% | 18257 | 0.000 | 0.051 | 0.961 |
| backlog stats | 00:00:00.016 | 0.0% | 59700 | 0.000 | 0.000 | 0.004 |
| callbacks | 00:00:00.000 | 0.0% | 0 | 0.000 | 0.000 | 0.000 |
| data read | 00:00:00.242 | 0.0% | 36803 | 0.000 | 0.007 | 0.028 |
| data write | 00:00:00.410 | 0.0% | 18590 | 0.000 | 0.022 | 0.054 |
| idle | 23:56:17.543 | 100.0% | 59700 | 832.228 | 1443.510 | 3141.580 |
| status file | 00:00:00.047 | 0.0% | 170 | 0.000 | 0.276 | 1.000 |
| TOTAL: 23:56:20.093 | 23:56:19.227 | 100.0% | - | - | - | - |
nnrpd timer:
| Code region | Time | Pct | Invoked | Min(ms) | Avg(ms) | Max(ms) |
|---|---|---|---|---|---|---|
| idle | 00:00:00.897 | 68.5% | 3 | 110.500 | 299.000 | 676.000 |
| newnews | 00:00:00.000 | 0.0% | 0 | 0.000 | 0.000 | 0.000 |
| nntpwrite | 00:00:00.001 | 0.1% | 15 | 0.000 | 0.067 | 0.500 |
| TOTAL: 00:00:01.310 | 00:00:00.898 | 68.5% | - | - | - | - |
Control commands to INND:
| Command | Number |
|---|---|
| L | 1 |
| flush | 2 |
| flushlogs | 2 |
| go | 2 |
| logmode | 2 |
| mode | 148 |
| name | 2 |
| pause | 2 |
| paused | 2 |
| reload | 2 |
| reserve | 2 |
| TOTAL: 11 | 167 |
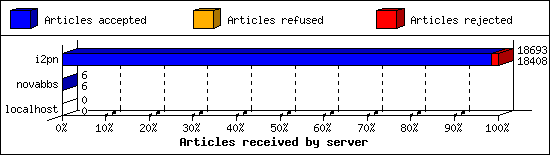
Incoming Feeds (INN):
| Server | Connects | Offered | Taken | Refused | Reject | %Accpt | Elapsed | |
|---|---|---|---|---|---|---|---|---|
| 1 | i2pn | 8 | 18693 | 18408 | 0 | 285 | 98% | 25:10:57 |
| 2 | novabbs | 5 | 6 | 6 | 0 | 0 | 100% | 00:48:10 |
| 3 | localhost | 25 | 0 | 0 | 0 | 0 | 0% | 00:00:00 |
| TOTAL: 3 | 38 | 18699 | 18414 | 0 | 285 | 98% | 25:59:07 | |
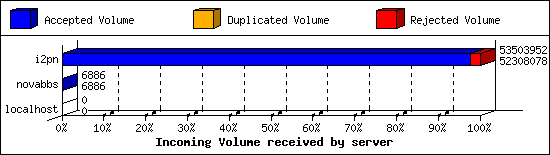
Incoming Volume (INN):
| Server | AcceptVol | DupVol | RejVol | TotalVol | %Acc | Vol/Art | |
|---|---|---|---|---|---|---|---|
| 1 | i2pn | 49.9 MB | 6.8 KB | 1.1 MB | 51.0 MB | 97% | 2.8 KB |
| 2 | novabbs | 6.7 KB | 0.0 KB | 0.0 KB | 6.7 KB | 100% | 1.1 KB |
| 3 | localhost | 0.0 KB | 0.0 KB | 0.0 KB | 0.0 KB | 0% | 0 |
| TOTAL: 3 | 49.9 MB | 6.8 KB | 1.1 MB | 51.0 MB | 97% | 2.8 KB | |
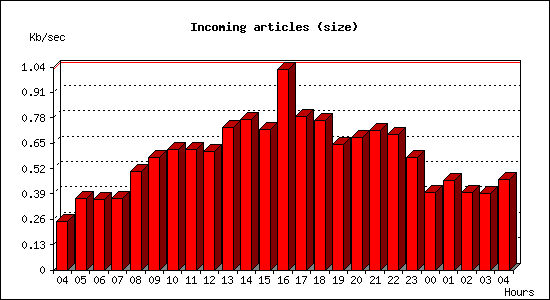
Incoming articles:
| Date | Articles | %Arts | Art/sec | Size | %Size | KB/sec |
|---|---|---|---|---|---|---|
| Jan 11 04:15:01 - 04:59:59 | 230 | 1.3% | 0.09 | 670.8 KB | 1.3% | 0.25 |
| Jan 11 05:00:00 - 05:59:59 | 451 | 2.5% | 0.13 | 1.3 MB | 2.6% | 0.37 |
| Jan 11 06:00:00 - 06:59:59 | 504 | 2.8% | 0.14 | 1.3 MB | 2.6% | 0.36 |
| Jan 11 07:00:00 - 07:59:59 | 526 | 2.9% | 0.15 | 1.3 MB | 2.6% | 0.36 |
| Jan 11 08:00:00 - 08:59:59 | 683 | 3.7% | 0.19 | 1.8 MB | 3.6% | 0.50 |
| Jan 11 09:00:00 - 09:59:59 | 783 | 4.3% | 0.22 | 2.0 MB | 4.1% | 0.58 |
| Jan 11 10:00:00 - 10:59:59 | 827 | 4.5% | 0.23 | 2.2 MB | 4.4% | 0.62 |
| Jan 11 11:00:00 - 11:59:59 | 864 | 4.7% | 0.24 | 2.2 MB | 4.4% | 0.62 |
| Jan 11 12:00:00 - 12:59:59 | 896 | 4.9% | 0.25 | 2.1 MB | 4.3% | 0.61 |
| Jan 11 13:00:00 - 13:59:59 | 1013 | 5.5% | 0.28 | 2.6 MB | 5.2% | 0.73 |
| Jan 11 14:00:00 - 14:59:59 | 1081 | 5.9% | 0.30 | 2.7 MB | 5.5% | 0.77 |
| Jan 11 15:00:00 - 15:59:59 | 1054 | 5.8% | 0.29 | 2.5 MB | 5.1% | 0.72 |
| Jan 11 16:00:00 - 16:59:59 | 1265 | 6.9% | 0.35 | 3.6 MB | 7.3% | 1.03 |
| Jan 11 17:00:00 - 17:59:59 | 1061 | 5.8% | 0.29 | 2.8 MB | 5.6% | 0.78 |
| Jan 11 18:00:00 - 18:59:59 | 1002 | 5.5% | 0.28 | 2.7 MB | 5.4% | 0.77 |
| Jan 11 19:00:00 - 19:59:59 | 865 | 4.7% | 0.24 | 2.3 MB | 4.6% | 0.64 |
| Jan 11 20:00:00 - 20:59:59 | 836 | 4.6% | 0.23 | 2.4 MB | 4.8% | 0.68 |
| Jan 11 21:00:00 - 21:59:59 | 882 | 4.8% | 0.24 | 2.5 MB | 5.1% | 0.71 |
| Jan 11 22:00:00 - 22:59:59 | 818 | 4.5% | 0.23 | 2.4 MB | 4.9% | 0.69 |
| Jan 11 23:00:00 - 23:59:59 | 686 | 3.8% | 0.19 | 2.0 MB | 4.1% | 0.58 |
| Jan 12 00:00:00 - 00:59:59 | 526 | 2.9% | 0.15 | 1.4 MB | 2.8% | 0.40 |
| Jan 12 01:00:00 - 01:59:59 | 506 | 2.8% | 0.14 | 1.6 MB | 3.3% | 0.46 |
| Jan 12 02:00:00 - 02:59:59 | 423 | 2.3% | 0.12 | 1.4 MB | 2.8% | 0.40 |
| Jan 12 03:00:00 - 03:59:59 | 393 | 2.2% | 0.11 | 1.4 MB | 2.8% | 0.39 |
| Jan 12 04:00:00 - 04:15:02 | 102 | 0.6% | 0.11 | 417.0 KB | 0.8% | 0.46 |
| TOTAL: 24:00:01 | 18277 | 100.0% | 0.21 | 49.4 MB | 100.0% | 0.59 |

Sites sending bad articles:
| Server | Total | Group | Dist | Duplic | Unapp | TooOld | Site | Line | Other | |
|---|---|---|---|---|---|---|---|---|---|---|
| 1 | i2pn | 642 | 24 | 0 | 6 | 0 | 0 | 0 | 0 | 612 |
| TOTAL: 1 | 642 | 24 | 0 | 6 | 0 | 0 | 0 | 0 | 612 | |
Unwanted newsgroups [Top 20]:
| Newsgroup | Count |
|---|---|
| alt.slack.goathead | 5 |
| alt.philosophy | 5 |
| alt.sex.pictu | 3 |
| abg.test | 3 |
| alt.sex.erotica.female | 2 |
| alt.christnet.public | 1 |
| alt.politics.republican | 1 |
| alt.magick.folk | 1 |
| alt.religion.christian.romman-catholic | 1 |
| alt.fun.with.tob | 1 |
| alt.rasap | 1 |
| TOTAL: 11 | 24 |
INND Perl filter [Top 20]:
| Reason | Count |
|---|---|
| unwanted post sub5 | 154 |
| unwanted post path1 | 70 |
| unwanted post path3 | 8 |
| unwanted post sub6 | 8 |
| EMP (phl) | 1 |
| TOTAL: 5 | 241 |
Miscellaneous innd statistics [Top 10]:
| Event | Server | Number |
|---|---|---|
| Including strange strings | ||
| i2pn | 361 | |
| TOTAL: 1 | 361 | |
| TOTAL: 1 | 361 | |
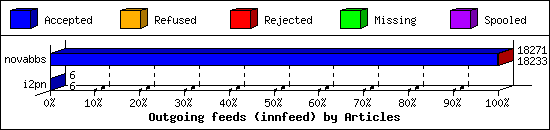
Outgoing Feeds (innfeed) by Articles:
| Server | Offered | Taken | Refused | Reject | Miss | Spool | %Took | Elapsed | |
|---|---|---|---|---|---|---|---|---|---|
| 1 | novabbs | 18273 | 18233 | 0 | 38 | 0 | 0 | 99% | 23:59:29 |
| 2 | i2pn | 6 | 6 | 0 | 0 | 0 | 0 | 100% | 00:20:00 |
| TOTAL: 2 | 18279 | 18239 | 0 | 38 | 0 | 0 | 99% | 24:19:29 | |
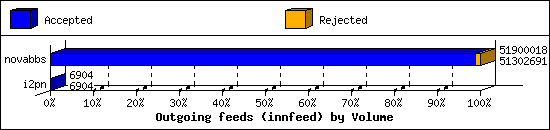
Outgoing Feeds (innfeed) by Volume:
| Server | AcceptVol | RejectVol | TotalVol | Volume/sec | Vol/Art | Elapsed | |
|---|---|---|---|---|---|---|---|
| 1 | novabbs | 48.9 MB | 583.3 KB | 49.5 MB | 0.6 KB/s | 2.8 KB | 23:59:29 |
| 2 | i2pn | 6.7 KB | 0.0 KB | 6.7 KB | 0.0 KB/s | 1.1 KB | 00:20:00 |
| TOTAL: 2 | 48.9 MB | 583.3 KB | 49.5 MB | 0.6 KB/s | 2.8 KB | 24:19:29 | |
NNRP readership statistics:
| System | Conn | Arts | Size | Groups | Post | Rej | Elapsed | |
|---|---|---|---|---|---|---|---|---|
| 1 | 122.228.19.79 | 1 | 0 | 0.0 KB | 0 | 0 | 0 | 00:00:00 |
| 2 | dojo.census.shodan.io | 1 | 0 | 0.0 KB | 0 | 0 | 0 | 00:00:00 |
| TOTAL: 2 | 2 | 0 | 0.0 KB | 0 | 0 | 0 | 00:00:01 | |
NNRP readership statistics (by domain):
| System | Conn | Arts | Size | Groups | Post | Rej | Elapsed | |
|---|---|---|---|---|---|---|---|---|
| 1 | unresolved | 1 | 0 | 0.0 KB | 0 | 0 | 0 | 00:00:00 |
| 2 | *.census.shodan.io | 1 | 0 | 0.0 KB | 0 | 0 | 0 | 00:00:00 |
| TOTAL: 2 | 2 | 0 | 0.0 KB | 0 | 0 | 0 | 00:00:01 | |
NNRP total resource statistics [Top 20]:
| System | User(ms) | System(ms) | Idle(ms) | Elapsed |
|---|---|---|---|---|
| dojo.census.shodan.io | 0.064 | 0.004 | 0.000 | 00:00:00 |
| 122.228.19.79 | 0.044 | 0.016 | 0.000 | 00:00:00 |
| TOTAL: 2 | 0.108 | 0.020 | 0.000 | 00:00:01 |
NNRP unrecognized commands (by host):
| System | Conn |
|---|---|
| 122.228.19.79 | 5 |
| TOTAL: 1 | 5 |
NNRP unrecognized commands (by command):
| Command | Count |
|---|---|
| GET / HTTP/1.1 | 1 |
| User-Agent: Mozilla/5.0 (Macintosh; Inte... | 1 |
| Connection: keep-alive | 1 |
| Accept: */* | 1 |
| Host: 157.230.63.40:119 | 1 |
| TOTAL: 5 | 5 |
