Log entries by program:
| Program name | Lines | %Lines | Size | %Size |
|---|---|---|---|---|
| inn | 16967 | 89.6% | 1.4 MB | 84.5% |
| innd | 1192 | 6.3% | 170.4 KB | 10.2% |
| innfeed | 769 | 4.1% | 88.9 KB | 5.3% |
| nnrpd | 3 | 0.0% | 0.3 KB | 0.0% |
| controlchan | 2 | 0.0% | 0.2 KB | 0.0% |
| TOTAL: 5 | 18933 | 100.0% | 1.6 MB | 100.0% |
History cache:
| Reason | Count | %Count |
|---|---|---|
| Do not exist | 16407 | 97.7% |
| Negative hits | 328 | 2.0% |
| Positive hits | 42 | 0.3% |
| Cache misses | 21 | 0.1% |
| TOTAL: 4 | 16798 | 100.0% |
INND timer:
| Code region | Time | Pct | Invoked | Min(ms) | Avg(ms) | Max(ms) |
|---|---|---|---|---|---|---|
| article cancel | 00:00:00.038 | 0.0% | 72 | 0.000 | 0.528 | 15.500 |
| article cleanup | 00:00:00.076 | 0.0% | 16455 | 0.000 | 0.005 | 0.032 |
| article logging | 00:00:00.443 | 0.0% | 16693 | 0.000 | 0.027 | 0.088 |
| article parse | 00:00:00.258 | 0.0% | 17897 | 0.000 | 0.014 | 0.059 |
| article write | 00:00:02.405 | 0.0% | 16286 | 0.027 | 0.148 | 0.250 |
| artlog/artcncl | 00:00:00.000 | 0.0% | 72 | 0.000 | 0.000 | 0.000 |
| artlog/artwrite | 00:00:00.000 | 0.0% | 7 | 0.000 | 0.000 | 0.000 |
| data move | 00:00:00.007 | 0.0% | 19751 | 0.000 | 0.000 | 0.010 |
| hisgrep/artcncl | 00:00:00.001 | 0.0% | 63 | 0.000 | 0.016 | 0.333 |
| hishave/artcncl | 00:00:00.000 | 0.0% | 72 | 0.000 | 0.000 | 0.000 |
| history grep | 00:00:00.000 | 0.0% | 0 | 0.000 | 0.000 | 0.000 |
| history lookup | 00:00:00.064 | 0.0% | 16788 | 0.000 | 0.004 | 0.026 |
| history sync | 00:00:00.014 | 0.0% | 411 | 0.000 | 0.034 | 0.500 |
| history write | 00:00:00.501 | 0.0% | 16448 | 0.000 | 0.030 | 0.077 |
| hiswrite/artcncl | 00:00:00.000 | 0.0% | 9 | 0.000 | 0.000 | 0.000 |
| idle | 23:50:44.483 | 100.0% | 18605 | 1857.978 | 4614.054 | 18771.469 |
| nntp read | 00:00:00.484 | 0.0% | 18272 | 0.000 | 0.026 | 0.072 |
| overview write | 00:00:01.082 | 0.0% | 16279 | 0.000 | 0.066 | 0.497 |
| perl filter | 00:00:10.400 | 0.0% | 16455 | 0.513 | 0.632 | 0.803 |
| python filter | 00:00:00.000 | 0.0% | 0 | 0.000 | 0.000 | 0.000 |
| site send | 00:00:00.731 | 0.0% | 16279 | 0.000 | 0.045 | 0.096 |
| TOTAL: 23:51:03.834 | 23:51:00.987 | 100.0% | - | - | - | - |
INNfeed timer:
| Code region | Time | Pct | Invoked | Min(ms) | Avg(ms) | Max(ms) |
|---|---|---|---|---|---|---|
| article new | 00:00:00.033 | 0.0% | 16335 | 0.000 | 0.002 | 0.026 |
| article prepare | 00:00:00.006 | 0.0% | 65240 | 0.000 | 0.000 | 0.002 |
| article read | 00:00:00.652 | 0.0% | 16310 | 0.000 | 0.040 | 0.449 |
| backlog stats | 00:00:00.023 | 0.0% | 54941 | 0.000 | 0.000 | 0.007 |
| callbacks | 00:00:00.000 | 0.0% | 0 | 0.000 | 0.000 | 0.000 |
| data read | 00:00:00.242 | 0.0% | 33477 | 0.000 | 0.007 | 0.027 |
| data write | 00:00:00.318 | 0.0% | 17180 | 0.000 | 0.019 | 0.056 |
| idle | 23:49:56.495 | 100.0% | 54941 | 759.852 | 1561.611 | 5890.775 |
| status file | 00:00:00.096 | 0.0% | 240 | 0.000 | 0.400 | 2.000 |
| TOTAL: 23:49:58.667 | 23:49:57.865 | 100.0% | - | - | - | - |
nnrpd timer:
| Code region | Time | Pct | Invoked | Min(ms) | Avg(ms) | Max(ms) |
|---|---|---|---|---|---|---|
| idle | 00:00:04.860 | 74.2% | 1 | 4860.000 | 4860.000 | 4860.000 |
| newnews | 00:00:00.000 | 0.0% | 0 | 0.000 | 0.000 | 0.000 |
| nntpwrite | 00:00:00.000 | 0.0% | 3 | 0.000 | 0.000 | 0.000 |
| TOTAL: 00:00:06.552 | 00:00:04.860 | 74.2% | - | - | - | - |
Control commands to INND:
| Command | Number |
|---|---|
| L | 1 |
| flush | 2 |
| flushlogs | 2 |
| go | 2 |
| logmode | 2 |
| mode | 150 |
| name | 2 |
| pause | 2 |
| paused | 2 |
| reload | 2 |
| reserve | 2 |
| shutdown | 3 |
| TOTAL: 12 | 172 |
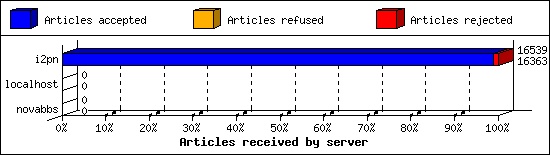
Incoming Feeds (INN):
| Server | Connects | Offered | Taken | Refused | Reject | %Accpt | Elapsed | |
|---|---|---|---|---|---|---|---|---|
| 1 | i2pn | 7 | 16539 | 16363 | 0 | 176 | 98% | 24:24:57 |
| 2 | localhost | 25 | 0 | 0 | 0 | 0 | 0% | 00:00:00 |
| 3 | novabbs | 16 | 0 | 0 | 0 | 0 | 0% | 01:48:40 |
| TOTAL: 3 | 48 | 16539 | 16363 | 0 | 176 | 98% | 26:13:37 | |
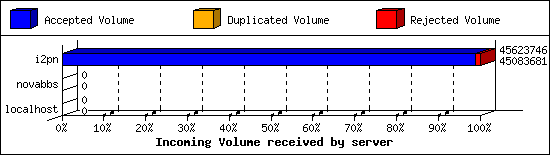
Incoming Volume (INN):
| Server | AcceptVol | DupVol | RejVol | TotalVol | %Acc | Vol/Art | |
|---|---|---|---|---|---|---|---|
| 1 | i2pn | 43.0 MB | 0.0 KB | 527.4 KB | 43.5 MB | 98% | 2.7 KB |
| 2 | localhost | 0.0 KB | 0.0 KB | 0.0 KB | 0.0 KB | 0% | 0 |
| 3 | novabbs | 0.0 KB | 0.0 KB | 0.0 KB | 0.0 KB | 0% | 0 |
| TOTAL: 3 | 43.0 MB | 0.0 KB | 527.4 KB | 43.5 MB | 98% | 2.7 KB | |
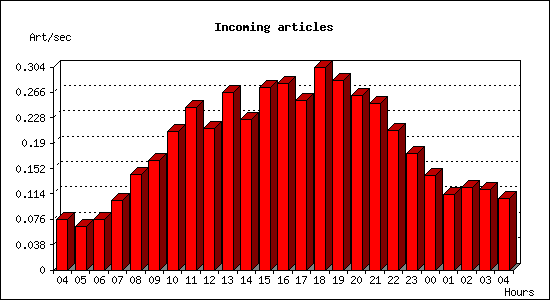
Incoming articles:
| Date | Articles | %Arts | Art/sec | Size | %Size | KB/sec |
|---|---|---|---|---|---|---|
| Jan 13 04:15:02 - 04:59:59 | 206 | 1.3% | 0.08 | 584.5 KB | 1.3% | 0.22 |
| Jan 13 05:00:00 - 05:59:59 | 233 | 1.4% | 0.06 | 675.3 KB | 1.5% | 0.19 |
| Jan 13 06:00:00 - 06:59:59 | 270 | 1.6% | 0.07 | 895.1 KB | 2.0% | 0.25 |
| Jan 13 07:00:00 - 07:59:59 | 372 | 2.3% | 0.10 | 1.1 MB | 2.5% | 0.31 |
| Jan 13 08:00:00 - 08:59:59 | 516 | 3.1% | 0.14 | 1.2 MB | 2.7% | 0.33 |
| Jan 13 09:00:00 - 09:59:59 | 590 | 3.6% | 0.16 | 1.4 MB | 3.2% | 0.39 |
| Jan 13 10:00:00 - 10:59:59 | 748 | 4.5% | 0.21 | 1.9 MB | 4.5% | 0.55 |
| Jan 13 11:00:00 - 11:59:59 | 874 | 5.3% | 0.24 | 2.1 MB | 4.7% | 0.58 |
| Jan 13 12:00:00 - 12:59:59 | 762 | 4.6% | 0.21 | 1.8 MB | 4.2% | 0.52 |
| Jan 13 13:00:00 - 13:59:59 | 957 | 5.8% | 0.27 | 2.3 MB | 5.3% | 0.66 |
| Jan 13 14:00:00 - 14:59:59 | 811 | 4.9% | 0.23 | 1.9 MB | 4.4% | 0.55 |
| Jan 13 15:00:00 - 15:59:59 | 986 | 6.0% | 0.27 | 2.8 MB | 6.5% | 0.80 |
| Jan 13 16:00:00 - 16:59:59 | 1007 | 6.1% | 0.28 | 2.4 MB | 5.6% | 0.68 |
| Jan 13 17:00:00 - 17:59:59 | 914 | 5.6% | 0.25 | 2.2 MB | 5.0% | 0.62 |
| Jan 13 18:00:00 - 18:59:59 | 1092 | 6.6% | 0.30 | 2.6 MB | 5.9% | 0.73 |
| Jan 13 19:00:00 - 19:59:59 | 1020 | 6.2% | 0.28 | 2.8 MB | 6.4% | 0.79 |
| Jan 13 20:00:00 - 20:59:59 | 942 | 5.7% | 0.26 | 2.5 MB | 5.7% | 0.70 |
| Jan 13 21:00:00 - 21:59:59 | 897 | 5.4% | 0.25 | 2.5 MB | 5.7% | 0.70 |
| Jan 13 22:00:00 - 22:59:59 | 750 | 4.6% | 0.21 | 2.2 MB | 5.0% | 0.62 |
| Jan 13 23:00:00 - 23:59:59 | 628 | 3.8% | 0.17 | 1.8 MB | 4.2% | 0.51 |
| Jan 14 00:00:00 - 00:59:59 | 510 | 3.1% | 0.14 | 1.5 MB | 3.5% | 0.44 |
| Jan 14 01:00:00 - 01:59:59 | 408 | 2.5% | 0.11 | 1.1 MB | 2.6% | 0.32 |
| Jan 14 02:00:00 - 02:59:59 | 447 | 2.7% | 0.12 | 1.6 MB | 3.8% | 0.47 |
| Jan 14 03:00:00 - 03:59:59 | 432 | 2.6% | 0.12 | 1.3 MB | 3.0% | 0.37 |
| Jan 14 04:00:00 - 04:15:01 | 96 | 0.6% | 0.11 | 318.9 KB | 0.7% | 0.35 |
| TOTAL: 23:59:59 | 16468 | 100.0% | 0.19 | 43.3 MB | 100.0% | 0.51 |

Sites sending bad articles:
| Server | Total | Group | Dist | Duplic | Unapp | TooOld | Site | Line | Other | |
|---|---|---|---|---|---|---|---|---|---|---|
| 1 | i2pn | 426 | 24 | 0 | 0 | 0 | 0 | 0 | 0 | 402 |
| TOTAL: 1 | 426 | 24 | 0 | 0 | 0 | 0 | 0 | 0 | 402 | |
Unwanted newsgroups [Top 20]:
| Newsgroup | Count |
|---|---|
| alt.philosophy | 3 |
| alt.magick.folk | 3 |
| alt.religion.christian.romman-catholic | 2 |
| alt.politics.republican | 2 |
| alt.hack.nl | 2 |
| alt.sex.marketplace | 2 |
| alt.poetry | 2 |
| usc.forsale | 1 |
| alt.christnet.christnews | 1 |
| alt.fetish.feet | 1 |
| alt.fun.with.tob | 1 |
| alt.arts.poetry | 1 |
| alt.computer.workshop | 1 |
| alt.slack.goathead | 1 |
| alt.support.chronic.pain | 1 |
| TOTAL: 15 | 24 |
INND Perl filter [Top 20]:
| Reason | Count |
|---|---|
| unwanted post sub5 | 92 |
| unwanted post path1 | 30 |
| unwanted post sub6 | 20 |
| unwanted post path3 | 7 |
| TOTAL: 4 | 149 |
Miscellaneous innd statistics [Top 10]:
| Event | Server | Number |
|---|---|---|
| Including strange strings | ||
| i2pn | 246 | |
| TOTAL: 1 | 246 | |
| TOTAL: 1 | 246 | |
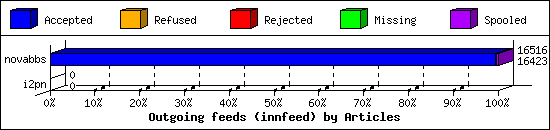
Outgoing Feeds (innfeed) by Articles:
| Server | Offered | Taken | Refused | Reject | Miss | Spool | %Took | Elapsed | |
|---|---|---|---|---|---|---|---|---|---|
| 1 | novabbs | 16472 | 16423 | 0 | 45 | 0 | 48 | 99% | 23:59:47 |
| 2 | i2pn | 0 | 0 | 0 | 0 | 0 | 0 | 0% | 00:20:00 |
| TOTAL: 2 | 16472 | 16423 | 0 | 45 | 0 | 48 | 99% | 24:19:47 | |
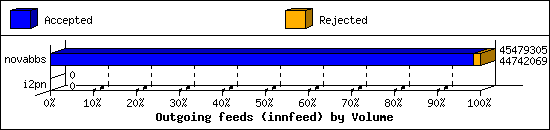
Outgoing Feeds (innfeed) by Volume:
| Server | AcceptVol | RejectVol | TotalVol | Volume/sec | Vol/Art | Elapsed | |
|---|---|---|---|---|---|---|---|
| 1 | novabbs | 42.7 MB | 720.0 KB | 43.4 MB | 0.5 KB/s | 2.7 KB | 23:59:47 |
| 2 | i2pn | 0.0 KB | 0.0 KB | 0.0 KB | 0.0 KB/s | 0 | 00:20:00 |
| TOTAL: 2 | 42.7 MB | 720.0 KB | 43.4 MB | 0.5 KB/s | 2.7 KB | 24:19:47 | |
NNRP readership statistics:
| System | Conn | Arts | Size | Groups | Post | Rej | Elapsed | |
|---|---|---|---|---|---|---|---|---|
| 1 | ip68-2-45-86.ph.ph.cox.net | 1 | 0 | 0.0 KB | 0 | 0 | 0 | 00:00:06 |
| TOTAL: 1 | 1 | 0 | 0.0 KB | 0 | 0 | 0 | 00:00:06 | |
NNRP readership statistics (by domain):
| System | Conn | Arts | Size | Groups | Post | Rej | Elapsed | |
|---|---|---|---|---|---|---|---|---|
| 1 | *.ph.ph.cox.net | 1 | 0 | 0.0 KB | 0 | 0 | 0 | 00:00:06 |
| TOTAL: 1 | 1 | 0 | 0.0 KB | 0 | 0 | 0 | 00:00:06 | |
NNRP total resource statistics [Top 20]:
| System | User(ms) | System(ms) | Idle(ms) | Elapsed |
|---|---|---|---|---|
| ip68-2-45-86.ph.ph.cox.net | 0.052 | 0.004 | 0.000 | 00:00:06 |
| TOTAL: 1 | 0.052 | 0.004 | 0.000 | 00:00:06 |
