Log entries by program:
| Program name | Lines | %Lines | Size | %Size |
|---|---|---|---|---|
| inn | 18982 | 91.2% | 1.5 MB | 86.3% |
| innd | 1157 | 5.6% | 170.1 KB | 9.3% |
| innfeed | 676 | 3.2% | 80.1 KB | 4.4% |
| nnrpd | 8 | 0.0% | 0.8 KB | 0.0% |
| controlchan | 1 | 0.0% | 0.1 KB | 0.0% |
| TOTAL: 5 | 20824 | 100.0% | 1.8 MB | 100.0% |
History cache:
| Reason | Count | %Count |
|---|---|---|
| Do not exist | 18589 | 97.2% |
| Negative hits | 480 | 2.5% |
| Positive hits | 50 | 0.3% |
| Cache misses | 13 | 0.1% |
| TOTAL: 4 | 19132 | 100.0% |
INND timer:
| Code region | Time | Pct | Invoked | Min(ms) | Avg(ms) | Max(ms) |
|---|---|---|---|---|---|---|
| article cancel | 00:00:00.011 | 0.0% | 91 | 0.000 | 0.121 | 1.000 |
| article cleanup | 00:00:00.095 | 0.0% | 18619 | 0.000 | 0.005 | 0.030 |
| article logging | 00:00:00.532 | 0.0% | 18900 | 0.000 | 0.028 | 0.069 |
| article parse | 00:00:00.279 | 0.0% | 20266 | 0.000 | 0.014 | 0.069 |
| article write | 00:00:04.280 | 0.0% | 18398 | 0.053 | 0.233 | 6.604 |
| artlog/artcncl | 00:00:00.001 | 0.0% | 90 | 0.000 | 0.011 | 0.500 |
| artlog/artwrite | 00:00:00.000 | 0.0% | 6 | 0.000 | 0.000 | 0.000 |
| data move | 00:00:00.003 | 0.0% | 22456 | 0.000 | 0.000 | 0.009 |
| hisgrep/artcncl | 00:00:00.000 | 0.0% | 61 | 0.000 | 0.000 | 0.000 |
| hishave/artcncl | 00:00:00.000 | 0.0% | 91 | 0.000 | 0.000 | 0.000 |
| history grep | 00:00:00.000 | 0.0% | 0 | 0.000 | 0.000 | 0.000 |
| history lookup | 00:00:00.076 | 0.0% | 19109 | 0.000 | 0.004 | 0.025 |
| history sync | 00:00:00.022 | 0.0% | 423 | 0.000 | 0.052 | 0.667 |
| history write | 00:00:00.528 | 0.0% | 18611 | 0.000 | 0.028 | 0.070 |
| hiswrite/artcncl | 00:00:00.002 | 0.0% | 30 | 0.000 | 0.067 | 0.333 |
| idle | 24:00:42.730 | 100.0% | 21112 | 2401.556 | 4094.483 | 12515.104 |
| nntp read | 00:00:00.570 | 0.0% | 20769 | 0.000 | 0.027 | 0.065 |
| overview write | 00:00:01.225 | 0.0% | 18392 | 0.013 | 0.067 | 0.456 |
| perl filter | 00:00:12.331 | 0.0% | 18617 | 0.512 | 0.662 | 0.888 |
| python filter | 00:00:00.000 | 0.0% | 0 | 0.000 | 0.000 | 0.000 |
| site send | 00:00:00.986 | 0.0% | 18391 | 0.000 | 0.054 | 0.125 |
| TOTAL: 24:01:07.360 | 24:01:03.671 | 100.0% | - | - | - | - |
INNfeed timer:
| Code region | Time | Pct | Invoked | Min(ms) | Avg(ms) | Max(ms) |
|---|---|---|---|---|---|---|
| article new | 00:00:00.032 | 0.0% | 18371 | 0.000 | 0.002 | 0.016 |
| article prepare | 00:00:00.009 | 0.0% | 73460 | 0.000 | 0.000 | 0.003 |
| article read | 00:00:00.772 | 0.0% | 18365 | 0.000 | 0.042 | 0.426 |
| backlog stats | 00:00:00.013 | 0.0% | 60033 | 0.000 | 0.000 | 0.004 |
| callbacks | 00:00:00.000 | 0.0% | 0 | 0.000 | 0.000 | 0.000 |
| data read | 00:00:00.324 | 0.0% | 37019 | 0.000 | 0.009 | 0.037 |
| data write | 00:00:00.472 | 0.0% | 18699 | 0.000 | 0.025 | 0.077 |
| idle | 23:58:05.433 | 100.0% | 60033 | 721.498 | 1437.300 | 4274.917 |
| status file | 00:00:00.056 | 0.0% | 195 | 0.000 | 0.287 | 1.000 |
| TOTAL: 23:58:08.097 | 23:58:07.111 | 100.0% | - | - | - | - |
nnrpd timer:
| Code region | Time | Pct | Invoked | Min(ms) | Avg(ms) | Max(ms) |
|---|---|---|---|---|---|---|
| idle | 00:00:01.276 | 62.2% | 2 | 117.000 | 638.000 | 1159.000 |
| newnews | 00:00:00.000 | 0.0% | 0 | 0.000 | 0.000 | 0.000 |
| nntpwrite | 00:00:00.000 | 0.0% | 4 | 0.000 | 0.000 | 0.000 |
| TOTAL: 00:00:02.053 | 00:00:01.276 | 62.2% | - | - | - | - |
Control commands to INND:
| Command | Number |
|---|---|
| L | 1 |
| flush | 2 |
| flushlogs | 2 |
| go | 2 |
| logmode | 2 |
| mode | 149 |
| name | 2 |
| pause | 2 |
| paused | 2 |
| reload | 2 |
| reserve | 2 |
| TOTAL: 11 | 168 |
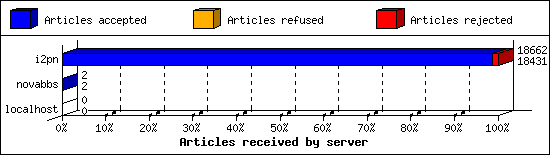
Incoming Feeds (INN):
| Server | Connects | Offered | Taken | Refused | Reject | %Accpt | Elapsed | |
|---|---|---|---|---|---|---|---|---|
| 1 | i2pn | 7 | 18662 | 18431 | 0 | 231 | 98% | 24:41:10 |
| 2 | novabbs | 6 | 2 | 2 | 0 | 0 | 100% | 00:58:10 |
| 3 | localhost | 25 | 0 | 0 | 0 | 0 | 0% | 00:00:00 |
| TOTAL: 3 | 38 | 18664 | 18433 | 0 | 231 | 98% | 25:39:20 | |
Incoming Volume (INN):
| Server | AcceptVol | DupVol | RejVol | TotalVol | %Acc | Vol/Art | |
|---|---|---|---|---|---|---|---|
| 1 | i2pn | 49.3 MB | 2.6 KB | 734.4 KB | 50.0 MB | 98% | 2.7 KB |
| 2 | novabbs | 2.6 KB | 0.0 KB | 0.0 KB | 2.6 KB | 100% | 1.3 KB |
| 3 | localhost | 0.0 KB | 0.0 KB | 0.0 KB | 0.0 KB | 0% | 0 |
| TOTAL: 3 | 49.3 MB | 2.6 KB | 734.4 KB | 50.0 MB | 98% | 2.7 KB | |

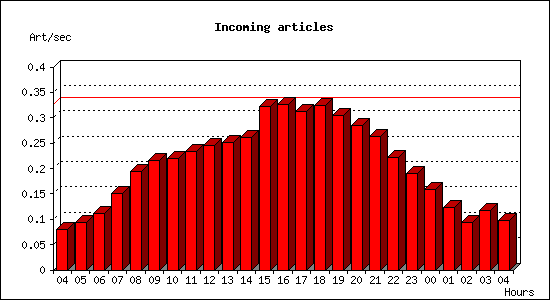
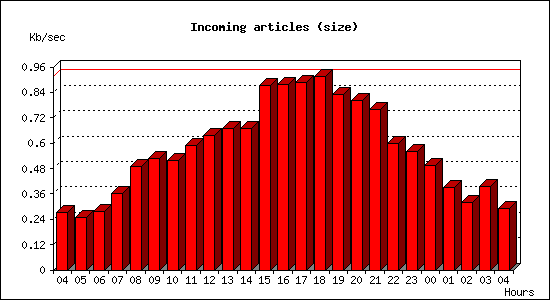
Incoming articles:
| Date | Articles | %Arts | Art/sec | Size | %Size | KB/sec |
|---|---|---|---|---|---|---|
| Jan 14 04:15:01 - 04:59:59 | 214 | 1.2% | 0.08 | 730.6 KB | 1.5% | 0.27 |
| Jan 14 05:00:00 - 05:59:59 | 340 | 1.9% | 0.09 | 899.4 KB | 1.8% | 0.25 |
| Jan 14 06:00:00 - 06:59:59 | 401 | 2.2% | 0.11 | 999.9 KB | 2.0% | 0.28 |
| Jan 14 07:00:00 - 07:59:59 | 543 | 3.0% | 0.15 | 1.3 MB | 2.6% | 0.36 |
| Jan 14 08:00:00 - 08:59:59 | 699 | 3.8% | 0.19 | 1.7 MB | 3.5% | 0.49 |
| Jan 14 09:00:00 - 09:59:59 | 779 | 4.2% | 0.22 | 1.9 MB | 3.8% | 0.53 |
| Jan 14 10:00:00 - 10:59:59 | 794 | 4.3% | 0.22 | 1.8 MB | 3.7% | 0.52 |
| Jan 14 11:00:00 - 11:59:59 | 838 | 4.6% | 0.23 | 2.1 MB | 4.2% | 0.59 |
| Jan 14 12:00:00 - 12:59:59 | 885 | 4.8% | 0.25 | 2.2 MB | 4.5% | 0.63 |
| Jan 14 13:00:00 - 13:59:59 | 906 | 4.9% | 0.25 | 2.4 MB | 4.8% | 0.67 |
| Jan 14 14:00:00 - 14:59:59 | 937 | 5.1% | 0.26 | 2.4 MB | 4.8% | 0.67 |
| Jan 14 15:00:00 - 15:59:59 | 1159 | 6.3% | 0.32 | 3.1 MB | 6.3% | 0.87 |
| Jan 14 16:00:00 - 16:59:59 | 1171 | 6.4% | 0.33 | 3.1 MB | 6.3% | 0.88 |
| Jan 14 17:00:00 - 17:59:59 | 1125 | 6.1% | 0.31 | 3.1 MB | 6.4% | 0.89 |
| Jan 14 18:00:00 - 18:59:59 | 1166 | 6.3% | 0.32 | 3.2 MB | 6.5% | 0.91 |
| Jan 14 19:00:00 - 19:59:59 | 1094 | 6.0% | 0.30 | 2.9 MB | 5.9% | 0.83 |
| Jan 14 20:00:00 - 20:59:59 | 1026 | 5.6% | 0.28 | 2.8 MB | 5.7% | 0.80 |
| Jan 14 21:00:00 - 21:59:59 | 946 | 5.1% | 0.26 | 2.7 MB | 5.4% | 0.76 |
| Jan 14 22:00:00 - 22:59:59 | 801 | 4.4% | 0.22 | 2.1 MB | 4.3% | 0.60 |
| Jan 14 23:00:00 - 23:59:59 | 685 | 3.7% | 0.19 | 2.0 MB | 4.0% | 0.56 |
| Jan 15 00:00:00 - 00:59:59 | 571 | 3.1% | 0.16 | 1.7 MB | 3.5% | 0.50 |
| Jan 15 01:00:00 - 01:59:59 | 444 | 2.4% | 0.12 | 1.4 MB | 2.8% | 0.39 |
| Jan 15 02:00:00 - 02:59:59 | 339 | 1.8% | 0.09 | 1.1 MB | 2.3% | 0.32 |
| Jan 15 03:00:00 - 03:59:59 | 424 | 2.3% | 0.12 | 1.4 MB | 2.8% | 0.39 |
| Jan 15 04:00:00 - 04:15:01 | 87 | 0.5% | 0.10 | 262.1 KB | 0.5% | 0.29 |
| TOTAL: 24:00:00 | 18374 | 100.0% | 0.21 | 49.1 MB | 100.0% | 0.58 |
Sites sending bad articles:
| Server | Total | Group | Dist | Duplic | Unapp | TooOld | Site | Line | Other | |
|---|---|---|---|---|---|---|---|---|---|---|
| 1 | i2pn | 518 | 57 | 0 | 2 | 0 | 0 | 0 | 0 | 459 |
| TOTAL: 1 | 518 | 57 | 0 | 2 | 0 | 0 | 0 | 0 | 459 | |
Unwanted newsgroups [Top 20]:
| Newsgroup | Count |
|---|---|
| alt.slack.goathead | 31 |
| alt.christian.bible | 5 |
| alt.magick.folk | 4 |
| alt.philosophy | 3 |
| spline.fli4l.geschnatter | 2 |
| alt.sex.erotica.female | 2 |
| alt.christnet.public | 1 |
| alt.fun.with.tob | 1 |
| alt.fr.os.windows.7 | 1 |
| alt.politics.republican | 1 |
| abg.test | 1 |
| alt.religion.christian.romman-catholic | 1 |
| de.comm.ham | 1 |
| mozilla.dev.l10n | 1 |
| alt.support.chronic.pain | 1 |
| alt.computer.workshop | 1 |
| TOTAL: 16 | 57 |
INND Perl filter [Top 20]:
| Reason | Count |
|---|---|
| unwanted post sub5 | 77 |
| unwanted post path1 | 55 |
| unwanted post sub6 | 20 |
| unwanted post path3 | 11 |
| TOTAL: 4 | 163 |
Miscellaneous innd statistics [Top 10]:
| Event | Server | Number |
|---|---|---|
| Including strange strings | ||
| i2pn | 290 | |
| TOTAL: 1 | 290 | |
| TOTAL: 1 | 290 | |
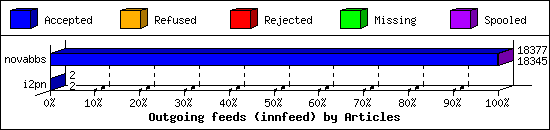
Outgoing Feeds (innfeed) by Articles:
| Server | Offered | Taken | Refused | Reject | Miss | Spool | %Took | Elapsed | |
|---|---|---|---|---|---|---|---|---|---|
| 1 | novabbs | 18373 | 18345 | 0 | 26 | 0 | 6 | 99% | 23:59:56 |
| 2 | i2pn | 2 | 2 | 0 | 0 | 0 | 0 | 100% | 00:30:00 |
| TOTAL: 2 | 18375 | 18347 | 0 | 26 | 0 | 6 | 99% | 24:29:56 | |
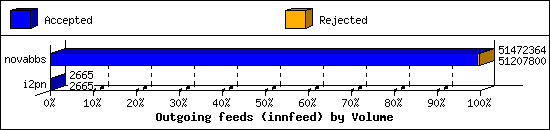
Outgoing Feeds (innfeed) by Volume:
| Server | AcceptVol | RejectVol | TotalVol | Volume/sec | Vol/Art | Elapsed | |
|---|---|---|---|---|---|---|---|
| 1 | novabbs | 48.8 MB | 258.4 KB | 49.1 MB | 0.6 KB/s | 2.7 KB | 23:59:56 |
| 2 | i2pn | 2.6 KB | 0.0 KB | 2.6 KB | 0.0 KB/s | 1.3 KB | 00:30:00 |
| TOTAL: 2 | 48.8 MB | 258.4 KB | 49.1 MB | 0.6 KB/s | 2.7 KB | 24:29:56 | |
NNRP readership statistics:
| System | Conn | Arts | Size | Groups | Post | Rej | Elapsed | |
|---|---|---|---|---|---|---|---|---|
| 1 | 185.100.87.248 | 2 | 0 | 0.0 KB | 0 | 0 | 0 | 00:00:02 |
| TOTAL: 1 | 2 | 0 | 0.0 KB | 0 | 0 | 0 | 00:00:02 | |
NNRP readership statistics (by domain):
| System | Conn | Arts | Size | Groups | Post | Rej | Elapsed | |
|---|---|---|---|---|---|---|---|---|
| 1 | unresolved | 2 | 0 | 0.0 KB | 0 | 0 | 0 | 00:00:02 |
| TOTAL: 1 | 2 | 0 | 0.0 KB | 0 | 0 | 0 | 00:00:02 | |
NNRP total resource statistics [Top 20]:
| System | User(ms) | System(ms) | Idle(ms) | Elapsed |
|---|---|---|---|---|
| 185.100.87.248 | 0.104 | 0.012 | 0.000 | 00:00:02 |
| TOTAL: 1 | 0.104 | 0.012 | 0.000 | 00:00:02 |
