Log entries by program:
| Program name | Lines | %Lines | Size | %Size |
|---|---|---|---|---|
| inn | 18742 | 91.2% | 1.5 MB | 86.2% |
| innd | 1147 | 5.6% | 176.7 KB | 9.8% |
| innfeed | 656 | 3.2% | 71.6 KB | 4.0% |
| nnrpd | 7 | 0.0% | 0.7 KB | 0.0% |
| controlchan | 1 | 0.0% | 0.1 KB | 0.0% |
| TOTAL: 5 | 20553 | 100.0% | 1.8 MB | 100.0% |
History cache:
| Reason | Count | %Count |
|---|---|---|
| Do not exist | 18298 | 98.5% |
| Negative hits | 230 | 1.2% |
| Positive hits | 29 | 0.2% |
| Cache misses | 15 | 0.1% |
| TOTAL: 4 | 18572 | 100.0% |
INND timer:
| Code region | Time | Pct | Invoked | Min(ms) | Avg(ms) | Max(ms) |
|---|---|---|---|---|---|---|
| article cancel | 00:00:00.007 | 0.0% | 63 | 0.000 | 0.111 | 1.000 |
| article cleanup | 00:00:00.084 | 0.0% | 18316 | 0.000 | 0.005 | 0.036 |
| article logging | 00:00:00.560 | 0.0% | 18656 | 0.000 | 0.030 | 0.091 |
| article parse | 00:00:00.287 | 0.0% | 20266 | 0.000 | 0.014 | 0.062 |
| article write | 00:00:02.948 | 0.0% | 18130 | 0.057 | 0.163 | 1.550 |
| artlog/artcncl | 00:00:00.000 | 0.0% | 63 | 0.000 | 0.000 | 0.000 |
| artlog/artwrite | 00:00:00.000 | 0.0% | 12 | 0.000 | 0.000 | 0.000 |
| data move | 00:00:00.008 | 0.0% | 22490 | 0.000 | 0.000 | 0.015 |
| hisgrep/artcncl | 00:00:00.000 | 0.0% | 44 | 0.000 | 0.000 | 0.000 |
| hishave/artcncl | 00:00:00.000 | 0.0% | 63 | 0.000 | 0.000 | 0.000 |
| history grep | 00:00:00.000 | 0.0% | 0 | 0.000 | 0.000 | 0.000 |
| history lookup | 00:00:00.094 | 0.0% | 18552 | 0.000 | 0.005 | 0.038 |
| history sync | 00:00:00.034 | 0.0% | 315 | 0.000 | 0.108 | 4.200 |
| history write | 00:00:00.577 | 0.0% | 18304 | 0.000 | 0.032 | 0.116 |
| hiswrite/artcncl | 00:00:00.001 | 0.0% | 19 | 0.000 | 0.053 | 0.500 |
| idle | 24:00:01.906 | 100.0% | 20738 | 2399.992 | 4166.357 | 11323.396 |
| nntp read | 00:00:00.577 | 0.0% | 20508 | 0.000 | 0.028 | 0.067 |
| overview write | 00:00:01.727 | 0.0% | 18118 | 0.013 | 0.095 | 3.518 |
| perl filter | 00:00:12.497 | 0.0% | 18316 | 0.528 | 0.682 | 1.414 |
| python filter | 00:00:00.000 | 0.0% | 0 | 0.000 | 0.000 | 0.000 |
| site send | 00:00:00.770 | 0.0% | 18118 | 0.000 | 0.042 | 0.123 |
| TOTAL: 24:00:25.269 | 24:00:22.077 | 100.0% | - | - | - | - |
INNfeed timer:
| Code region | Time | Pct | Invoked | Min(ms) | Avg(ms) | Max(ms) |
|---|---|---|---|---|---|---|
| article new | 00:00:00.028 | 0.0% | 19955 | 0.000 | 0.001 | 0.047 |
| article prepare | 00:00:00.007 | 0.0% | 72404 | 0.000 | 0.000 | 0.003 |
| article read | 00:00:00.701 | 0.0% | 18103 | 0.000 | 0.039 | 0.295 |
| backlog stats | 00:00:00.020 | 0.0% | 58316 | 0.000 | 0.000 | 0.006 |
| callbacks | 00:00:00.000 | 0.0% | 1 | 0.000 | 0.000 | 0.000 |
| data read | 00:00:00.316 | 0.0% | 36135 | 0.000 | 0.009 | 0.033 |
| data write | 00:00:00.430 | 0.0% | 18058 | 0.000 | 0.024 | 0.069 |
| idle | 23:57:21.069 | 100.0% | 58316 | 172.616 | 1478.858 | 3831.949 |
| prepart/cb | 00:00:00.000 | 0.0% | 4 | 0.000 | 0.000 | 0.000 |
| readart/cb | 00:00:00.000 | 0.0% | 1 | 0.000 | 0.000 | 0.000 |
| status file | 00:00:00.088 | 0.0% | 208 | 0.000 | 0.423 | 1.333 |
| TOTAL: 23:57:23.619 | 23:57:22.659 | 100.0% | - | - | - | - |
nnrpd timer:
| Code region | Time | Pct | Invoked | Min(ms) | Avg(ms) | Max(ms) |
|---|---|---|---|---|---|---|
| idle | 00:00:00.160 | 27.4% | 2 | 80.000 | 80.000 | 80.000 |
| newnews | 00:00:00.000 | 0.0% | 0 | 0.000 | 0.000 | 0.000 |
| nntpwrite | 00:00:00.000 | 0.0% | 11 | 0.000 | 0.000 | 0.000 |
| TOTAL: 00:00:00.583 | 00:00:00.160 | 27.4% | - | - | - | - |
Control commands to INND:
| Command | Number |
|---|---|
| L | 1 |
| flush | 2 |
| flushlogs | 2 |
| go | 2 |
| logmode | 2 |
| mode | 149 |
| name | 2 |
| pause | 2 |
| paused | 2 |
| reload | 2 |
| reserve | 2 |
| TOTAL: 11 | 168 |
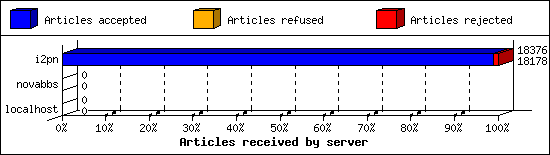
Incoming Feeds (INN):
| Server | Connects | Offered | Taken | Refused | Reject | %Accpt | Elapsed | |
|---|---|---|---|---|---|---|---|---|
| 1 | i2pn | 8 | 18376 | 18178 | 0 | 198 | 98% | 24:54:08 |
| 2 | novabbs | 4 | 0 | 0 | 0 | 0 | 0% | 00:38:10 |
| 3 | localhost | 25 | 0 | 0 | 0 | 0 | 0% | 00:00:01 |
| TOTAL: 3 | 37 | 18376 | 18178 | 0 | 198 | 98% | 25:32:19 | |
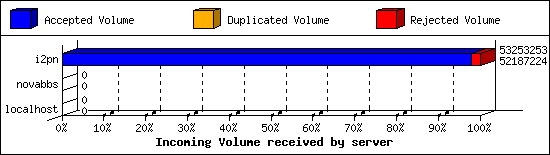
Incoming Volume (INN):
| Server | AcceptVol | DupVol | RejVol | TotalVol | %Acc | Vol/Art | |
|---|---|---|---|---|---|---|---|
| 1 | i2pn | 49.8 MB | 0.0 KB | 1.0 MB | 50.8 MB | 97% | 2.8 KB |
| 2 | novabbs | 0.0 KB | 0.0 KB | 0.0 KB | 0.0 KB | 0% | 0 |
| 3 | localhost | 0.0 KB | 0.0 KB | 0.0 KB | 0.0 KB | 0% | 0 |
| TOTAL: 3 | 49.8 MB | 0.0 KB | 1.0 MB | 50.8 MB | 97% | 2.8 KB | |
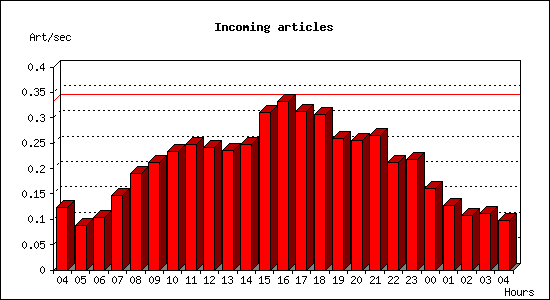
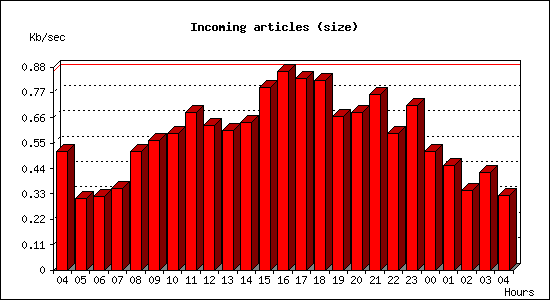
Incoming articles:
| Date | Articles | %Arts | Art/sec | Size | %Size | KB/sec |
|---|---|---|---|---|---|---|
| Jan 15 04:15:01 - 04:59:59 | 331 | 1.8% | 0.12 | 1.4 MB | 2.7% | 0.52 |
| Jan 15 05:00:00 - 05:59:59 | 318 | 1.8% | 0.09 | 1.1 MB | 2.2% | 0.31 |
| Jan 15 06:00:00 - 06:59:59 | 372 | 2.1% | 0.10 | 1.1 MB | 2.3% | 0.32 |
| Jan 15 07:00:00 - 07:59:59 | 528 | 2.9% | 0.15 | 1.2 MB | 2.5% | 0.35 |
| Jan 15 08:00:00 - 08:59:59 | 688 | 3.8% | 0.19 | 1.8 MB | 3.6% | 0.51 |
| Jan 15 09:00:00 - 09:59:59 | 762 | 4.2% | 0.21 | 2.0 MB | 4.0% | 0.56 |
| Jan 15 10:00:00 - 10:59:59 | 844 | 4.7% | 0.23 | 2.1 MB | 4.2% | 0.59 |
| Jan 15 11:00:00 - 11:59:59 | 888 | 4.9% | 0.25 | 2.4 MB | 4.8% | 0.68 |
| Jan 15 12:00:00 - 12:59:59 | 870 | 4.8% | 0.24 | 2.2 MB | 4.4% | 0.63 |
| Jan 15 13:00:00 - 13:59:59 | 850 | 4.7% | 0.24 | 2.1 MB | 4.3% | 0.60 |
| Jan 15 14:00:00 - 14:59:59 | 888 | 4.9% | 0.25 | 2.3 MB | 4.5% | 0.64 |
| Jan 15 15:00:00 - 15:59:59 | 1115 | 6.1% | 0.31 | 2.8 MB | 5.6% | 0.79 |
| Jan 15 16:00:00 - 16:59:59 | 1195 | 6.6% | 0.33 | 3.0 MB | 6.1% | 0.86 |
| Jan 15 17:00:00 - 17:59:59 | 1122 | 6.2% | 0.31 | 2.9 MB | 5.9% | 0.83 |
| Jan 15 18:00:00 - 18:59:59 | 1101 | 6.1% | 0.31 | 2.9 MB | 5.8% | 0.82 |
| Jan 15 19:00:00 - 19:59:59 | 930 | 5.1% | 0.26 | 2.3 MB | 4.7% | 0.67 |
| Jan 15 20:00:00 - 20:59:59 | 919 | 5.1% | 0.26 | 2.4 MB | 4.8% | 0.68 |
| Jan 15 21:00:00 - 21:59:59 | 952 | 5.3% | 0.26 | 2.7 MB | 5.4% | 0.76 |
| Jan 15 22:00:00 - 22:59:59 | 765 | 4.2% | 0.21 | 2.1 MB | 4.2% | 0.59 |
| Jan 15 23:00:00 - 23:59:59 | 785 | 4.3% | 0.22 | 2.5 MB | 5.1% | 0.72 |
| Jan 16 00:00:00 - 00:59:59 | 580 | 3.2% | 0.16 | 1.8 MB | 3.6% | 0.51 |
| Jan 16 01:00:00 - 01:59:59 | 456 | 2.5% | 0.13 | 1.6 MB | 3.2% | 0.45 |
| Jan 16 02:00:00 - 02:59:59 | 385 | 2.1% | 0.11 | 1.2 MB | 2.4% | 0.34 |
| Jan 16 03:00:00 - 03:59:59 | 400 | 2.2% | 0.11 | 1.5 MB | 3.0% | 0.42 |
| Jan 16 04:00:00 - 04:15:01 | 88 | 0.5% | 0.10 | 291.0 KB | 0.6% | 0.32 |
| TOTAL: 24:00:00 | 18132 | 100.0% | 0.21 | 49.6 MB | 100.0% | 0.59 |
Sites sending bad articles:
| Server | Total | Group | Dist | Duplic | Unapp | TooOld | Site | Line | Other | |
|---|---|---|---|---|---|---|---|---|---|---|
| 1 | i2pn | 547 | 39 | 0 | 0 | 0 | 0 | 0 | 0 | 508 |
| TOTAL: 1 | 547 | 39 | 0 | 0 | 0 | 0 | 0 | 0 | 508 | |
Unwanted newsgroups [Top 20]:
| Newsgroup | Count |
|---|---|
| alt.slack.goathead | 15 |
| alt.philosophy | 6 |
| alt.support.chronic.pain | 6 |
| alt.sex.marketplace | 2 |
| alt.fun.with.tob | 1 |
| mozilla.wishlist | 1 |
| alt.politics.republican | 1 |
| gmane.comp.gis.openstreetmap.region.hr | 1 |
| alt.religion.christian.romman-catholic | 1 |
| mozilla.dev.l10n | 1 |
| spline.fli4l.geschnatter | 1 |
| alt.magick.folk | 1 |
| alt.religion.christian.jesus-connect | 1 |
| alt.christian.bible | 1 |
| TOTAL: 14 | 39 |
INND Perl filter [Top 20]:
| Reason | Count |
|---|---|
| unwanted post path1 | 71 |
| unwanted post sub5 | 48 |
| unwanted post sub6 | 26 |
| EMP (phl) | 1 |
| TOTAL: 4 | 146 |
Miscellaneous innd statistics [Top 10]:
| Event | Server | Number |
|---|---|---|
| Including strange strings | ||
| i2pn | 350 | |
| TOTAL: 1 | 350 | |
| TOTAL: 1 | 350 | |
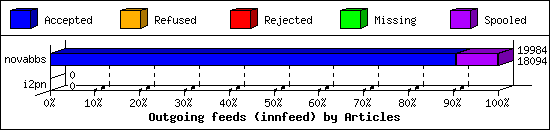
Outgoing Feeds (innfeed) by Articles:
| Server | Offered | Taken | Refused | Reject | Miss | Spool | %Took | Elapsed | |
|---|---|---|---|---|---|---|---|---|---|
| 1 | novabbs | 18170 | 18094 | 0 | 34 | 4 | 1852 | 99% | 23:59:58 |
| 2 | i2pn | 0 | 0 | 0 | 0 | 0 | 0 | 0% | 00:10:00 |
| TOTAL: 2 | 18170 | 18094 | 0 | 34 | 4 | 1852 | 99% | 24:09:58 | |
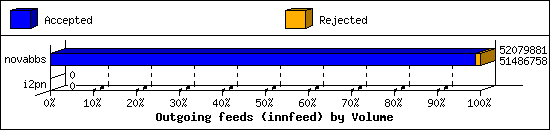
Outgoing Feeds (innfeed) by Volume:
| Server | AcceptVol | RejectVol | TotalVol | Volume/sec | Vol/Art | Elapsed | |
|---|---|---|---|---|---|---|---|
| 1 | novabbs | 49.1 MB | 579.2 KB | 49.7 MB | 0.6 KB/s | 2.8 KB | 23:59:58 |
| 2 | i2pn | 0.0 KB | 0.0 KB | 0.0 KB | 0.0 KB/s | 0 | 00:10:00 |
| TOTAL: 2 | 49.1 MB | 579.2 KB | 49.7 MB | 0.6 KB/s | 2.8 KB | 24:09:58 | |
NNRP readership statistics:
| System | Conn | Arts | Size | Groups | Post | Rej | Elapsed | |
|---|---|---|---|---|---|---|---|---|
| 1 | scan-141.security.ipip.net | 1 | 0 | 0.0 KB | 0 | 0 | 0 | 00:00:00 |
| TOTAL: 1 | 1 | 0 | 0.0 KB | 0 | 0 | 0 | 00:00:00 | |
NNRP readership statistics (by domain):
| System | Conn | Arts | Size | Groups | Post | Rej | Elapsed | |
|---|---|---|---|---|---|---|---|---|
| 1 | *.security.ipip.net | 1 | 0 | 0.0 KB | 0 | 0 | 0 | 00:00:00 |
| TOTAL: 1 | 1 | 0 | 0.0 KB | 0 | 0 | 0 | 00:00:00 | |
NNRP total resource statistics [Top 20]:
| System | User(ms) | System(ms) | Idle(ms) | Elapsed |
|---|---|---|---|---|
| scan-141.security.ipip.net | 0.072 | 0.008 | 0.000 | 00:00:00 |
| TOTAL: 1 | 0.072 | 0.008 | 0.000 | 00:00:00 |
NNRP unrecognized commands (by host):
| System | Conn |
|---|---|
| scan-141.security.ipip.net | 4 |
| TOTAL: 1 | 4 |
NNRP unrecognized commands (by command):
| Command | Count |
|---|---|
| Connection: close | 1 |
| User-Agent: HTTP Banner Detection (https... | 1 |
| Host: 157.230.63.40:119 | 1 |
| GET / HTTP/1.1 | 1 |
| TOTAL: 4 | 4 |
