Log entries by program:
| Program name | Lines | %Lines | Size | %Size |
|---|---|---|---|---|
| inn | 19657 | 91.2% | 1.6 MB | 86.5% |
| innd | 1227 | 5.7% | 182.1 KB | 9.6% |
| innfeed | 679 | 3.1% | 73.7 KB | 3.9% |
| controlchan | 1 | 0.0% | 0.1 KB | 0.0% |
| TOTAL: 4 | 21564 | 100.0% | 1.8 MB | 100.0% |
History cache:
| Reason | Count | %Count |
|---|---|---|
| Do not exist | 19160 | 98.1% |
| Negative hits | 260 | 1.3% |
| Positive hits | 66 | 0.3% |
| Cache misses | 37 | 0.2% |
| TOTAL: 4 | 19523 | 100.0% |
INND timer:
| Code region | Time | Pct | Invoked | Min(ms) | Avg(ms) | Max(ms) |
|---|---|---|---|---|---|---|
| article cancel | 00:00:00.023 | 0.0% | 107 | 0.000 | 0.215 | 1.000 |
| article cleanup | 00:00:00.097 | 0.0% | 19182 | 0.000 | 0.005 | 0.029 |
| article logging | 00:00:00.569 | 0.0% | 19563 | 0.000 | 0.029 | 0.068 |
| article parse | 00:00:00.299 | 0.0% | 20923 | 0.000 | 0.014 | 0.058 |
| article write | 00:00:04.115 | 0.0% | 18929 | 0.062 | 0.217 | 14.174 |
| artlog/artcncl | 00:00:00.001 | 0.0% | 105 | 0.000 | 0.010 | 0.167 |
| data move | 00:00:00.013 | 0.0% | 23035 | 0.000 | 0.001 | 0.014 |
| hisgrep/artcncl | 00:00:00.001 | 0.0% | 103 | 0.000 | 0.010 | 0.250 |
| hishave/artcncl | 00:00:00.000 | 0.0% | 107 | 0.000 | 0.000 | 0.000 |
| history grep | 00:00:00.000 | 0.0% | 0 | 0.000 | 0.000 | 0.000 |
| history lookup | 00:00:00.068 | 0.0% | 19444 | 0.000 | 0.003 | 0.033 |
| history sync | 00:00:00.017 | 0.0% | 416 | 0.000 | 0.041 | 0.667 |
| history write | 00:00:00.659 | 0.0% | 19182 | 0.000 | 0.034 | 0.362 |
| hiswrite/artcncl | 00:00:00.000 | 0.0% | 4 | 0.000 | 0.000 | 0.000 |
| idle | 24:00:42.960 | 100.0% | 21520 | 2151.168 | 4016.866 | 13046.674 |
| nntp read | 00:00:00.630 | 0.0% | 21191 | 0.000 | 0.030 | 0.069 |
| overview write | 00:00:01.495 | 0.0% | 18929 | 0.008 | 0.079 | 1.021 |
| perl filter | 00:00:12.858 | 0.0% | 19182 | 0.521 | 0.670 | 1.000 |
| python filter | 00:00:00.000 | 0.0% | 0 | 0.000 | 0.000 | 0.000 |
| site send | 00:00:01.217 | 0.0% | 18929 | 0.000 | 0.064 | 0.140 |
| TOTAL: 24:01:08.385 | 24:01:05.022 | 100.0% | - | - | - | - |
INNfeed timer:
| Code region | Time | Pct | Invoked | Min(ms) | Avg(ms) | Max(ms) |
|---|---|---|---|---|---|---|
| article new | 00:00:00.036 | 0.0% | 18916 | 0.000 | 0.002 | 0.019 |
| article prepare | 00:00:00.010 | 0.0% | 75632 | 0.000 | 0.000 | 0.003 |
| article read | 00:00:00.787 | 0.0% | 18908 | 0.000 | 0.042 | 0.342 |
| backlog stats | 00:00:00.027 | 0.0% | 61985 | 0.000 | 0.000 | 0.005 |
| callbacks | 00:00:00.000 | 0.0% | 0 | 0.000 | 0.000 | 0.000 |
| data read | 00:00:00.324 | 0.0% | 38266 | 0.000 | 0.008 | 0.033 |
| data write | 00:00:00.536 | 0.0% | 19398 | 0.000 | 0.028 | 0.100 |
| idle | 23:58:24.735 | 100.0% | 61985 | 786.515 | 1392.349 | 3861.173 |
| status file | 00:00:00.066 | 0.0% | 200 | 0.000 | 0.330 | 1.000 |
| TOTAL: 23:58:27.495 | 23:58:26.521 | 100.0% | - | - | - | - |
Control commands to INND:
| Command | Number |
|---|---|
| L | 1 |
| flush | 2 |
| flushlogs | 2 |
| go | 2 |
| logmode | 2 |
| mode | 149 |
| name | 2 |
| pause | 2 |
| paused | 2 |
| reload | 2 |
| reserve | 2 |
| TOTAL: 11 | 168 |
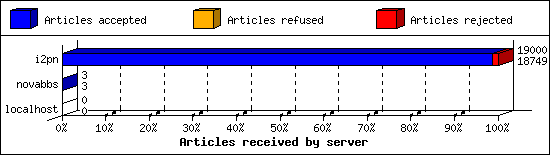
Incoming Feeds (INN):
| Server | Connects | Offered | Taken | Refused | Reject | %Accpt | Elapsed | |
|---|---|---|---|---|---|---|---|---|
| 1 | i2pn | 5 | 19000 | 18749 | 0 | 251 | 98% | 24:04:00 |
| 2 | novabbs | 7 | 3 | 3 | 0 | 0 | 100% | 01:09:50 |
| 3 | localhost | 25 | 0 | 0 | 0 | 0 | 0% | 00:00:00 |
| TOTAL: 3 | 37 | 19003 | 18752 | 0 | 251 | 98% | 25:13:50 | |
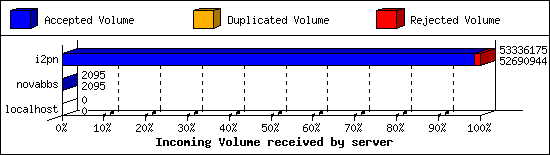
Incoming Volume (INN):
| Server | AcceptVol | DupVol | RejVol | TotalVol | %Acc | Vol/Art | |
|---|---|---|---|---|---|---|---|
| 1 | i2pn | 50.2 MB | 0.0 KB | 630.1 KB | 50.9 MB | 98% | 2.7 KB |
| 2 | novabbs | 2.0 KB | 0.0 KB | 0.0 KB | 2.0 KB | 100% | 0.7 KB |
| 3 | localhost | 0.0 KB | 0.0 KB | 0.0 KB | 0.0 KB | 0% | 0 |
| TOTAL: 3 | 50.3 MB | 0.0 KB | 630.1 KB | 50.9 MB | 98% | 2.7 KB | |
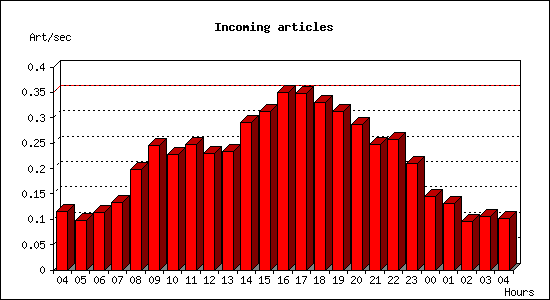
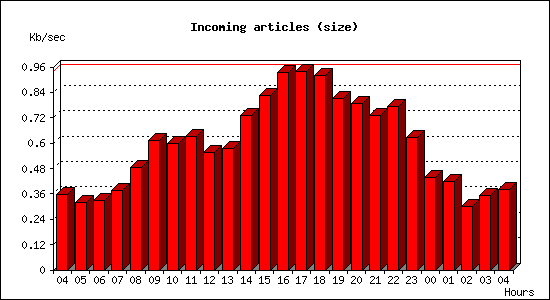
Incoming articles:
| Date | Articles | %Arts | Art/sec | Size | %Size | KB/sec |
|---|---|---|---|---|---|---|
| Jan 21 04:15:01 - 04:59:59 | 310 | 1.6% | 0.11 | 965.3 KB | 1.9% | 0.36 |
| Jan 21 05:00:00 - 05:59:59 | 352 | 1.9% | 0.10 | 1.1 MB | 2.2% | 0.32 |
| Jan 21 06:00:00 - 06:59:59 | 410 | 2.2% | 0.11 | 1.2 MB | 2.3% | 0.33 |
| Jan 21 07:00:00 - 07:59:59 | 479 | 2.5% | 0.13 | 1.3 MB | 2.6% | 0.38 |
| Jan 21 08:00:00 - 08:59:59 | 713 | 3.8% | 0.20 | 1.7 MB | 3.4% | 0.48 |
| Jan 21 09:00:00 - 09:59:59 | 882 | 4.7% | 0.24 | 2.1 MB | 4.2% | 0.61 |
| Jan 21 10:00:00 - 10:59:59 | 818 | 4.3% | 0.23 | 2.1 MB | 4.1% | 0.60 |
| Jan 21 11:00:00 - 11:59:59 | 890 | 4.7% | 0.25 | 2.2 MB | 4.4% | 0.63 |
| Jan 21 12:00:00 - 12:59:59 | 823 | 4.4% | 0.23 | 2.0 MB | 3.9% | 0.56 |
| Jan 21 13:00:00 - 13:59:59 | 842 | 4.5% | 0.23 | 2.0 MB | 4.0% | 0.58 |
| Jan 21 14:00:00 - 14:59:59 | 1049 | 5.5% | 0.29 | 2.6 MB | 5.1% | 0.73 |
| Jan 21 15:00:00 - 15:59:59 | 1121 | 5.9% | 0.31 | 2.9 MB | 5.7% | 0.83 |
| Jan 21 16:00:00 - 16:59:59 | 1256 | 6.6% | 0.35 | 3.3 MB | 6.5% | 0.93 |
| Jan 21 17:00:00 - 17:59:59 | 1252 | 6.6% | 0.35 | 3.3 MB | 6.5% | 0.94 |
| Jan 21 18:00:00 - 18:59:59 | 1189 | 6.3% | 0.33 | 3.2 MB | 6.4% | 0.92 |
| Jan 21 19:00:00 - 19:59:59 | 1123 | 5.9% | 0.31 | 2.9 MB | 5.6% | 0.81 |
| Jan 21 20:00:00 - 20:59:59 | 1034 | 5.5% | 0.29 | 2.8 MB | 5.5% | 0.79 |
| Jan 21 21:00:00 - 21:59:59 | 893 | 4.7% | 0.25 | 2.6 MB | 5.1% | 0.73 |
| Jan 21 22:00:00 - 22:59:59 | 927 | 4.9% | 0.26 | 2.7 MB | 5.4% | 0.77 |
| Jan 21 23:00:00 - 23:59:59 | 754 | 4.0% | 0.21 | 2.2 MB | 4.3% | 0.63 |
| Jan 22 00:00:00 - 00:59:59 | 521 | 2.8% | 0.14 | 1.5 MB | 3.0% | 0.44 |
| Jan 22 01:00:00 - 01:59:59 | 469 | 2.5% | 0.13 | 1.5 MB | 2.9% | 0.42 |
| Jan 22 02:00:00 - 02:59:59 | 342 | 1.8% | 0.10 | 1.1 MB | 2.1% | 0.30 |
| Jan 22 03:00:00 - 03:59:59 | 378 | 2.0% | 0.10 | 1.2 MB | 2.4% | 0.35 |
| Jan 22 04:00:00 - 04:15:01 | 92 | 0.5% | 0.10 | 343.8 KB | 0.7% | 0.38 |
| TOTAL: 24:00:00 | 18919 | 100.0% | 0.22 | 50.8 MB | 100.0% | 0.60 |
Sites sending bad articles:
| Server | Total | Group | Dist | Duplic | Unapp | TooOld | Site | Line | Other | |
|---|---|---|---|---|---|---|---|---|---|---|
| 1 | i2pn | 633 | 3 | 0 | 0 | 0 | 0 | 0 | 0 | 630 |
| TOTAL: 1 | 633 | 3 | 0 | 0 | 0 | 0 | 0 | 0 | 630 | |
Unwanted newsgroups [Top 20]:
| Newsgroup | Count |
|---|---|
| alt.soupdragons | 3 |
| TOTAL: 1 | 3 |
INND Perl filter [Top 20]:
| Reason | Count |
|---|---|
| unwanted post sub5 | 97 |
| unwanted post path1 | 70 |
| unwanted post path3 | 38 |
| unwanted post sub6 | 34 |
| unwanted post sub7 | 5 |
| unwanted post sub1 | 5 |
| TOTAL: 6 | 249 |
Miscellaneous innd statistics [Top 10]:
| Event | Server | Number |
|---|---|---|
| Including strange strings | ||
| i2pn | 381 | |
| TOTAL: 1 | 381 | |
| TOTAL: 1 | 381 | |
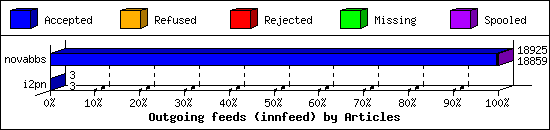
Outgoing Feeds (innfeed) by Articles:
| Server | Offered | Taken | Refused | Reject | Miss | Spool | %Took | Elapsed | |
|---|---|---|---|---|---|---|---|---|---|
| 1 | novabbs | 18920 | 18859 | 0 | 58 | 0 | 8 | 99% | 23:59:24 |
| 2 | i2pn | 3 | 3 | 0 | 0 | 0 | 0 | 100% | 00:22:35 |
| TOTAL: 2 | 18923 | 18862 | 0 | 58 | 0 | 8 | 99% | 24:21:59 | |
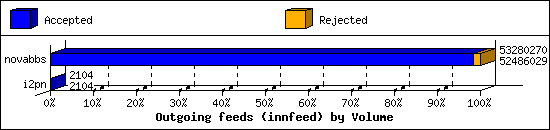
Outgoing Feeds (innfeed) by Volume:
| Server | AcceptVol | RejectVol | TotalVol | Volume/sec | Vol/Art | Elapsed | |
|---|---|---|---|---|---|---|---|
| 1 | novabbs | 50.1 MB | 775.6 KB | 50.8 MB | 0.6 KB/s | 2.8 KB | 23:59:24 |
| 2 | i2pn | 2.1 KB | 0.0 KB | 2.1 KB | 0.0 KB/s | 0.7 KB | 00:22:35 |
| TOTAL: 2 | 50.1 MB | 775.6 KB | 50.8 MB | 0.6 KB/s | 2.8 KB | 24:21:59 | |