Log entries by program:
| Program name | Lines | %Lines | Size | %Size |
|---|---|---|---|---|
| inn | 19609 | 91.5% | 1.6 MB | 86.9% |
| innd | 1185 | 5.5% | 170.8 KB | 9.1% |
| innfeed | 629 | 2.9% | 75.2 KB | 4.0% |
| nnrpd | 4 | 0.0% | 0.5 KB | 0.0% |
| controlchan | 1 | 0.0% | 0.1 KB | 0.0% |
| TOTAL: 5 | 21428 | 100.0% | 1.8 MB | 100.0% |
History cache:
| Reason | Count | %Count |
|---|---|---|
| Do not exist | 18947 | 97.7% |
| Negative hits | 340 | 1.8% |
| Positive hits | 78 | 0.4% |
| Cache misses | 31 | 0.2% |
| TOTAL: 4 | 19396 | 100.0% |
INND timer:
| Code region | Time | Pct | Invoked | Min(ms) | Avg(ms) | Max(ms) |
|---|---|---|---|---|---|---|
| article cancel | 00:00:00.062 | 0.0% | 114 | 0.000 | 0.544 | 2.500 |
| article cleanup | 00:00:00.097 | 0.0% | 18955 | 0.000 | 0.005 | 0.030 |
| article logging | 00:00:00.672 | 0.0% | 19446 | 0.000 | 0.035 | 0.088 |
| article parse | 00:00:00.334 | 0.0% | 20977 | 0.000 | 0.016 | 0.057 |
| article write | 00:00:03.679 | 0.0% | 18730 | 0.077 | 0.196 | 1.775 |
| artlog/artcncl | 00:00:00.001 | 0.0% | 114 | 0.000 | 0.009 | 0.071 |
| data move | 00:00:00.007 | 0.0% | 23307 | 0.000 | 0.000 | 0.006 |
| hisgrep/artcncl | 00:00:00.001 | 0.0% | 109 | 0.000 | 0.009 | 0.100 |
| hishave/artcncl | 00:00:00.000 | 0.0% | 114 | 0.000 | 0.000 | 0.000 |
| history grep | 00:00:00.000 | 0.0% | 0 | 0.000 | 0.000 | 0.000 |
| history lookup | 00:00:00.083 | 0.0% | 19302 | 0.000 | 0.004 | 0.038 |
| history sync | 00:00:00.022 | 0.0% | 319 | 0.000 | 0.069 | 1.000 |
| history write | 00:00:00.801 | 0.0% | 18955 | 0.000 | 0.042 | 0.103 |
| hiswrite/artcncl | 00:00:00.000 | 0.0% | 5 | 0.000 | 0.000 | 0.000 |
| idle | 23:50:02.218 | 100.0% | 21567 | 1869.866 | 3978.403 | 12003.000 |
| nntp read | 00:00:00.679 | 0.0% | 21333 | 0.000 | 0.032 | 0.074 |
| overview write | 00:00:01.869 | 0.0% | 18730 | 0.030 | 0.100 | 1.519 |
| perl filter | 00:00:15.756 | 0.0% | 18955 | 0.592 | 0.831 | 1.210 |
| python filter | 00:00:00.000 | 0.0% | 0 | 0.000 | 0.000 | 0.000 |
| site send | 00:00:00.671 | 0.0% | 18730 | 0.000 | 0.036 | 0.124 |
| TOTAL: 23:50:30.714 | 23:50:26.952 | 100.0% | - | - | - | - |
INNfeed timer:
| Code region | Time | Pct | Invoked | Min(ms) | Avg(ms) | Max(ms) |
|---|---|---|---|---|---|---|
| article new | 00:00:00.038 | 0.0% | 18770 | 0.000 | 0.002 | 0.023 |
| article prepare | 00:00:00.015 | 0.0% | 75080 | 0.000 | 0.000 | 0.003 |
| article read | 00:00:00.916 | 0.0% | 18770 | 0.000 | 0.049 | 0.750 |
| backlog stats | 00:00:00.027 | 0.0% | 60928 | 0.000 | 0.000 | 0.004 |
| callbacks | 00:00:00.000 | 0.0% | 0 | 0.000 | 0.000 | 0.000 |
| data read | 00:00:00.324 | 0.0% | 37671 | 0.000 | 0.009 | 0.027 |
| data write | 00:00:00.552 | 0.0% | 18953 | 0.000 | 0.029 | 0.087 |
| idle | 23:58:19.533 | 100.0% | 60928 | 835.128 | 1416.418 | 3906.123 |
| status file | 00:00:00.075 | 0.0% | 170 | 0.000 | 0.441 | 3.000 |
| TOTAL: 23:58:22.671 | 23:58:21.480 | 100.0% | - | - | - | - |
nnrpd timer:
| Code region | Time | Pct | Invoked | Min(ms) | Avg(ms) | Max(ms) |
|---|---|---|---|---|---|---|
| idle | 00:00:00.509 | 89.3% | 2 | 254.500 | 254.500 | 254.500 |
| newnews | 00:00:00.000 | 0.0% | 0 | 0.000 | 0.000 | 0.000 |
| nntpwrite | 00:00:00.000 | 0.0% | 33 | 0.000 | 0.000 | 0.000 |
| TOTAL: 00:00:00.570 | 00:00:00.509 | 89.3% | - | - | - | - |
Control commands to INND:
| Command | Number |
|---|---|
| L | 1 |
| flush | 2 |
| flushlogs | 2 |
| go | 2 |
| logmode | 2 |
| mode | 148 |
| name | 2 |
| pause | 2 |
| paused | 2 |
| reload | 6 |
| reserve | 2 |
| TOTAL: 11 | 171 |
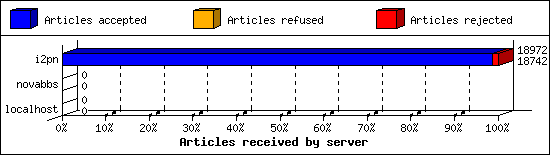
Incoming Feeds (INN):
| Server | Connects | Offered | Taken | Refused | Reject | %Accpt | Elapsed | |
|---|---|---|---|---|---|---|---|---|
| 1 | i2pn | 6 | 18972 | 18742 | 0 | 230 | 98% | 24:23:26 |
| 2 | localhost | 25 | 0 | 0 | 0 | 0 | 0% | 00:00:01 |
| 3 | novabbs | 2 | 0 | 0 | 0 | 0 | 0% | 00:19:05 |
| TOTAL: 3 | 33 | 18972 | 18742 | 0 | 230 | 98% | 24:42:32 | |
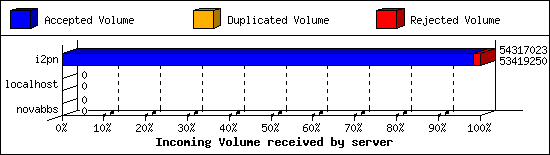
Incoming Volume (INN):
| Server | AcceptVol | DupVol | RejVol | TotalVol | %Acc | Vol/Art | |
|---|---|---|---|---|---|---|---|
| 1 | i2pn | 50.9 MB | 0.0 KB | 876.7 KB | 51.8 MB | 98% | 2.8 KB |
| 2 | localhost | 0.0 KB | 0.0 KB | 0.0 KB | 0.0 KB | 0% | 0 |
| 3 | novabbs | 0.0 KB | 0.0 KB | 0.0 KB | 0.0 KB | 0% | 0 |
| TOTAL: 3 | 50.9 MB | 0.0 KB | 876.7 KB | 51.8 MB | 98% | 2.8 KB | |
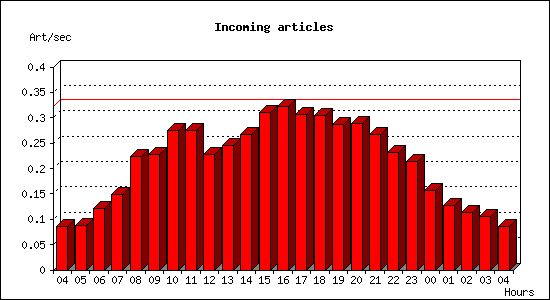
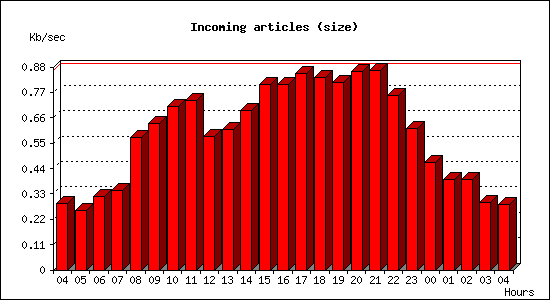
Incoming articles:
| Date | Articles | %Arts | Art/sec | Size | %Size | KB/sec |
|---|---|---|---|---|---|---|
| Jan 25 04:15:01 - 04:59:59 | 231 | 1.2% | 0.09 | 774.6 KB | 1.5% | 0.29 |
| Jan 25 05:00:00 - 05:59:59 | 316 | 1.7% | 0.09 | 924.7 KB | 1.8% | 0.26 |
| Jan 25 06:00:00 - 06:59:59 | 438 | 2.3% | 0.12 | 1.1 MB | 2.2% | 0.32 |
| Jan 25 07:00:00 - 07:59:59 | 536 | 2.9% | 0.15 | 1.2 MB | 2.4% | 0.35 |
| Jan 25 08:00:00 - 08:59:59 | 804 | 4.3% | 0.22 | 2.0 MB | 4.0% | 0.57 |
| Jan 25 09:00:00 - 09:59:59 | 818 | 4.4% | 0.23 | 2.2 MB | 4.4% | 0.63 |
| Jan 25 10:00:00 - 10:59:59 | 992 | 5.3% | 0.28 | 2.5 MB | 4.9% | 0.71 |
| Jan 25 11:00:00 - 11:59:59 | 989 | 5.3% | 0.27 | 2.6 MB | 5.1% | 0.74 |
| Jan 25 12:00:00 - 12:59:59 | 818 | 4.4% | 0.23 | 2.0 MB | 4.0% | 0.58 |
| Jan 25 13:00:00 - 13:59:59 | 882 | 4.7% | 0.24 | 2.1 MB | 4.2% | 0.61 |
| Jan 25 14:00:00 - 14:59:59 | 959 | 5.1% | 0.27 | 2.4 MB | 4.8% | 0.69 |
| Jan 25 15:00:00 - 15:59:59 | 1115 | 5.9% | 0.31 | 2.8 MB | 5.6% | 0.80 |
| Jan 25 16:00:00 - 16:59:59 | 1157 | 6.2% | 0.32 | 2.8 MB | 5.6% | 0.81 |
| Jan 25 17:00:00 - 17:59:59 | 1105 | 5.9% | 0.31 | 3.0 MB | 5.9% | 0.85 |
| Jan 25 18:00:00 - 18:59:59 | 1095 | 5.8% | 0.30 | 2.9 MB | 5.8% | 0.84 |
| Jan 25 19:00:00 - 19:59:59 | 1033 | 5.5% | 0.29 | 2.9 MB | 5.6% | 0.81 |
| Jan 25 20:00:00 - 20:59:59 | 1036 | 5.5% | 0.29 | 3.0 MB | 5.9% | 0.86 |
| Jan 25 21:00:00 - 21:59:59 | 960 | 5.1% | 0.27 | 3.0 MB | 6.0% | 0.87 |
| Jan 25 22:00:00 - 22:59:59 | 833 | 4.4% | 0.23 | 2.7 MB | 5.2% | 0.76 |
| Jan 25 23:00:00 - 23:59:59 | 769 | 4.1% | 0.21 | 2.2 MB | 4.2% | 0.61 |
| Jan 26 00:00:00 - 00:59:59 | 564 | 3.0% | 0.16 | 1.6 MB | 3.2% | 0.47 |
| Jan 26 01:00:00 - 01:59:59 | 461 | 2.5% | 0.13 | 1.4 MB | 2.7% | 0.39 |
| Jan 26 02:00:00 - 02:59:59 | 407 | 2.2% | 0.11 | 1.4 MB | 2.7% | 0.39 |
| Jan 26 03:00:00 - 03:59:59 | 382 | 2.0% | 0.11 | 1.0 MB | 2.0% | 0.29 |
| Jan 26 04:00:00 - 04:15:01 | 77 | 0.4% | 0.09 | 255.5 KB | 0.5% | 0.28 |
| TOTAL: 24:00:00 | 18777 | 100.0% | 0.22 | 50.9 MB | 100.0% | 0.60 |
Sites sending bad articles:
| Server | Total | Group | Dist | Duplic | Unapp | TooOld | Site | Line | Other | |
|---|---|---|---|---|---|---|---|---|---|---|
| 1 | i2pn | 718 | 0 | 0 | 0 | 0 | 0 | 0 | 0 | 718 |
| TOTAL: 1 | 718 | 0 | 0 | 0 | 0 | 0 | 0 | 0 | 718 | |
INND Perl filter [Top 20]:
| Reason | Count |
|---|---|
| Scoring filter (S05) | 69 |
| unwanted post path1 | 67 |
| unwanted post sub5 | 47 |
| Scoring filter (S08) | 23 |
| Scoring filter (S06) | 13 |
| unwanted post sub6 | 4 |
| unwanted post path3 | 2 |
| Scoring filter (P01) | 1 |
| TOTAL: 8 | 226 |
Miscellaneous innd statistics [Top 10]:
| Event | Server | Number |
|---|---|---|
| Including strange strings | ||
| i2pn | 492 | |
| TOTAL: 1 | 492 | |
| TOTAL: 1 | 492 | |
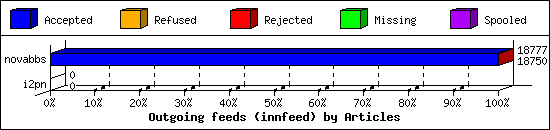
Outgoing Feeds (innfeed) by Articles:
| Server | Offered | Taken | Refused | Reject | Miss | Spool | %Took | Elapsed | |
|---|---|---|---|---|---|---|---|---|---|
| 1 | novabbs | 18779 | 18750 | 0 | 27 | 0 | 0 | 99% | 23:59:58 |
| 2 | i2pn | 0 | 0 | 0 | 0 | 0 | 0 | 0% | 00:10:01 |
| TOTAL: 2 | 18779 | 18750 | 0 | 27 | 0 | 0 | 99% | 24:09:59 | |
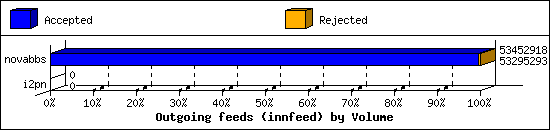
Outgoing Feeds (innfeed) by Volume:
| Server | AcceptVol | RejectVol | TotalVol | Volume/sec | Vol/Art | Elapsed | |
|---|---|---|---|---|---|---|---|
| 1 | novabbs | 50.8 MB | 153.9 KB | 51.0 MB | 0.6 KB/s | 2.8 KB | 23:59:58 |
| 2 | i2pn | 0.0 KB | 0.0 KB | 0.0 KB | 0.0 KB/s | 0 | 00:10:01 |
| TOTAL: 2 | 50.8 MB | 153.9 KB | 51.0 MB | 0.6 KB/s | 2.8 KB | 24:09:59 | |
NNRP readership statistics:
| System | Conn | Arts | Size | Groups | Post | Rej | Elapsed | |
|---|---|---|---|---|---|---|---|---|
| 1 | 125.64.94.197 | 1 | 0 | 0.0 KB | 0 | 0 | 0 | 00:00:00 |
| TOTAL: 1 | 1 | 0 | 0.0 KB | 0 | 0 | 0 | 00:00:00 | |
NNRP readership statistics (by domain):
| System | Conn | Arts | Size | Groups | Post | Rej | Elapsed | |
|---|---|---|---|---|---|---|---|---|
| 1 | unresolved | 1 | 0 | 0.0 KB | 0 | 0 | 0 | 00:00:00 |
| TOTAL: 1 | 1 | 0 | 0.0 KB | 0 | 0 | 0 | 00:00:00 | |
NNRP total resource statistics [Top 20]:
| System | User(ms) | System(ms) | Idle(ms) | Elapsed |
|---|---|---|---|---|
| 125.64.94.197 | 0.056 | 0.000 | 0.000 | 00:00:00 |
| TOTAL: 1 | 0.056 | 0.000 | 0.000 | 00:00:00 |
