Log entries by program:
| Program name | Lines | %Lines | Size | %Size |
|---|---|---|---|---|
| inn | 19505 | 91.4% | 1.6 MB | 86.7% |
| innd | 1107 | 5.2% | 162.4 KB | 8.7% |
| innfeed | 715 | 3.3% | 85.4 KB | 4.6% |
| nnrpd | 18 | 0.1% | 1.9 KB | 0.1% |
| controlchan | 1 | 0.0% | 0.0 KB | 0.0% |
| TOTAL: 5 | 21346 | 100.0% | 1.8 MB | 100.0% |
History cache:
| Reason | Count | %Count |
|---|---|---|
| Do not exist | 18980 | 97.8% |
| Negative hits | 318 | 1.6% |
| Positive hits | 89 | 0.5% |
| Cache misses | 23 | 0.1% |
| TOTAL: 4 | 19410 | 100.0% |
INND timer:
| Code region | Time | Pct | Invoked | Min(ms) | Avg(ms) | Max(ms) |
|---|---|---|---|---|---|---|
| article cancel | 00:00:00.040 | 0.0% | 125 | 0.000 | 0.320 | 2.000 |
| article cleanup | 00:00:00.104 | 0.0% | 19015 | 0.000 | 0.005 | 0.036 |
| article logging | 00:00:00.622 | 0.0% | 19385 | 0.000 | 0.032 | 0.091 |
| article parse | 00:00:00.342 | 0.0% | 21427 | 0.000 | 0.016 | 0.048 |
| article write | 00:00:03.851 | 0.0% | 18894 | 0.079 | 0.204 | 3.146 |
| artlog/artcncl | 00:00:00.000 | 0.0% | 124 | 0.000 | 0.000 | 0.000 |
| data move | 00:00:00.009 | 0.0% | 24130 | 0.000 | 0.000 | 0.012 |
| hisgrep/artcncl | 00:00:00.001 | 0.0% | 112 | 0.000 | 0.009 | 0.333 |
| hishave/artcncl | 00:00:00.000 | 0.0% | 125 | 0.000 | 0.000 | 0.000 |
| history grep | 00:00:00.000 | 0.0% | 0 | 0.000 | 0.000 | 0.000 |
| history lookup | 00:00:00.087 | 0.0% | 19339 | 0.000 | 0.004 | 0.059 |
| history sync | 00:00:00.014 | 0.0% | 413 | 0.000 | 0.034 | 0.667 |
| history write | 00:00:00.725 | 0.0% | 19015 | 0.000 | 0.038 | 0.125 |
| hiswrite/artcncl | 00:00:00.000 | 0.0% | 13 | 0.000 | 0.000 | 0.000 |
| idle | 24:00:46.108 | 100.0% | 22099 | 2364.291 | 3911.766 | 10908.000 |
| nntp read | 00:00:00.713 | 0.0% | 21766 | 0.000 | 0.033 | 0.083 |
| overview write | 00:00:01.472 | 0.0% | 18894 | 0.000 | 0.078 | 0.373 |
| perl filter | 00:00:15.645 | 0.0% | 19015 | 0.618 | 0.823 | 1.373 |
| python filter | 00:00:00.000 | 0.0% | 0 | 0.000 | 0.000 | 0.000 |
| site send | 00:00:01.055 | 0.0% | 18894 | 0.000 | 0.056 | 0.130 |
| TOTAL: 24:01:15.063 | 24:01:10.788 | 100.0% | - | - | - | - |
INNfeed timer:
| Code region | Time | Pct | Invoked | Min(ms) | Avg(ms) | Max(ms) |
|---|---|---|---|---|---|---|
| article new | 00:00:00.029 | 0.0% | 22394 | 0.000 | 0.001 | 0.021 |
| article prepare | 00:00:00.005 | 0.0% | 75504 | 0.000 | 0.000 | 0.003 |
| article read | 00:00:00.881 | 0.0% | 18884 | 0.000 | 0.047 | 1.029 |
| backlog stats | 00:00:00.024 | 0.0% | 62737 | 0.000 | 0.000 | 0.005 |
| callbacks | 00:00:00.000 | 0.0% | 5 | 0.000 | 0.000 | 0.000 |
| data read | 00:00:00.369 | 0.0% | 38879 | 0.000 | 0.009 | 0.037 |
| data write | 00:00:00.506 | 0.0% | 19693 | 0.000 | 0.026 | 0.082 |
| idle | 23:58:30.788 | 100.0% | 62737 | 131.878 | 1375.756 | 3880.792 |
| prepart/cb | 00:00:00.000 | 0.0% | 8 | 0.000 | 0.000 | 0.000 |
| readart/cb | 00:00:00.000 | 0.0% | 2 | 0.000 | 0.000 | 0.000 |
| status file | 00:00:00.148 | 0.0% | 237 | 0.000 | 0.624 | 3.000 |
| TOTAL: 23:58:33.978 | 23:58:32.750 | 100.0% | - | - | - | - |
nnrpd timer:
| Code region | Time | Pct | Invoked | Min(ms) | Avg(ms) | Max(ms) |
|---|---|---|---|---|---|---|
| idle | 00:00:09.979 | 78.8% | 5 | 40.000 | 1995.800 | 9743.000 |
| newnews | 00:00:00.000 | 0.0% | 0 | 0.000 | 0.000 | 0.000 |
| nntpwrite | 00:00:00.001 | 0.0% | 17 | 0.000 | 0.059 | 0.500 |
| TOTAL: 00:00:12.662 | 00:00:09.980 | 78.8% | - | - | - | - |
Control commands to INND:
| Command | Number |
|---|---|
| L | 1 |
| flush | 2 |
| flushlogs | 2 |
| go | 2 |
| logmode | 2 |
| mode | 149 |
| name | 2 |
| pause | 2 |
| paused | 2 |
| reload | 2 |
| reserve | 2 |
| TOTAL: 11 | 168 |
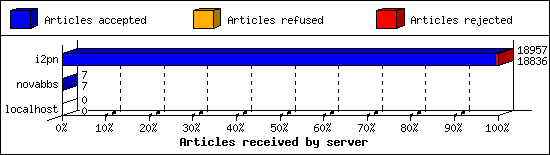
Incoming Feeds (INN):
| Server | Connects | Offered | Taken | Refused | Reject | %Accpt | Elapsed | |
|---|---|---|---|---|---|---|---|---|
| 1 | i2pn | 6 | 18957 | 18836 | 0 | 121 | 99% | 24:25:29 |
| 2 | novabbs | 8 | 7 | 7 | 0 | 0 | 100% | 01:18:10 |
| 3 | localhost | 25 | 0 | 0 | 0 | 0 | 0% | 00:00:00 |
| TOTAL: 3 | 39 | 18964 | 18843 | 0 | 121 | 99% | 25:43:39 | |
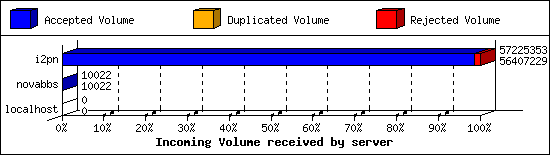
Incoming Volume (INN):
| Server | AcceptVol | DupVol | RejVol | TotalVol | %Acc | Vol/Art | |
|---|---|---|---|---|---|---|---|
| 1 | i2pn | 53.8 MB | 0.0 KB | 798.9 KB | 54.6 MB | 98% | 2.9 KB |
| 2 | novabbs | 9.8 KB | 0.0 KB | 0.0 KB | 9.8 KB | 100% | 1.4 KB |
| 3 | localhost | 0.0 KB | 0.0 KB | 0.0 KB | 0.0 KB | 0% | 0 |
| TOTAL: 3 | 53.8 MB | 0.0 KB | 798.9 KB | 54.6 MB | 98% | 2.9 KB | |
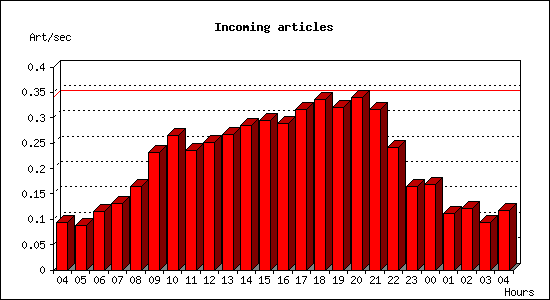
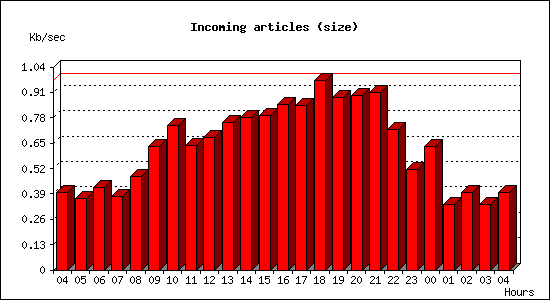
Incoming articles:
| Date | Articles | %Arts | Art/sec | Size | %Size | KB/sec |
|---|---|---|---|---|---|---|
| Jan 29 04:15:01 - 04:59:59 | 253 | 1.3% | 0.09 | 1.0 MB | 1.9% | 0.40 |
| Jan 29 05:00:00 - 05:59:59 | 319 | 1.7% | 0.09 | 1.3 MB | 2.4% | 0.36 |
| Jan 29 06:00:00 - 06:59:59 | 414 | 2.2% | 0.12 | 1.5 MB | 2.8% | 0.43 |
| Jan 29 07:00:00 - 07:59:59 | 470 | 2.5% | 0.13 | 1.3 MB | 2.5% | 0.38 |
| Jan 29 08:00:00 - 08:59:59 | 592 | 3.1% | 0.16 | 1.7 MB | 3.1% | 0.48 |
| Jan 29 09:00:00 - 09:59:59 | 831 | 4.4% | 0.23 | 2.2 MB | 4.1% | 0.63 |
| Jan 29 10:00:00 - 10:59:59 | 956 | 5.1% | 0.27 | 2.6 MB | 4.8% | 0.74 |
| Jan 29 11:00:00 - 11:59:59 | 851 | 4.5% | 0.24 | 2.2 MB | 4.1% | 0.64 |
| Jan 29 12:00:00 - 12:59:59 | 902 | 4.8% | 0.25 | 2.4 MB | 4.4% | 0.68 |
| Jan 29 13:00:00 - 13:59:59 | 963 | 5.1% | 0.27 | 2.7 MB | 4.9% | 0.76 |
| Jan 29 14:00:00 - 14:59:59 | 1026 | 5.4% | 0.28 | 2.7 MB | 5.1% | 0.78 |
| Jan 29 15:00:00 - 15:59:59 | 1057 | 5.6% | 0.29 | 2.8 MB | 5.2% | 0.79 |
| Jan 29 16:00:00 - 16:59:59 | 1040 | 5.5% | 0.29 | 3.0 MB | 5.5% | 0.85 |
| Jan 29 17:00:00 - 17:59:59 | 1137 | 6.0% | 0.32 | 3.0 MB | 5.5% | 0.84 |
| Jan 29 18:00:00 - 18:59:59 | 1213 | 6.4% | 0.34 | 3.4 MB | 6.3% | 0.97 |
| Jan 29 19:00:00 - 19:59:59 | 1152 | 6.1% | 0.32 | 3.1 MB | 5.8% | 0.89 |
| Jan 29 20:00:00 - 20:59:59 | 1224 | 6.5% | 0.34 | 3.1 MB | 5.8% | 0.89 |
| Jan 29 21:00:00 - 21:59:59 | 1138 | 6.0% | 0.32 | 3.2 MB | 5.9% | 0.91 |
| Jan 29 22:00:00 - 22:59:59 | 872 | 4.6% | 0.24 | 2.5 MB | 4.7% | 0.72 |
| Jan 29 23:00:00 - 23:59:59 | 595 | 3.1% | 0.17 | 1.8 MB | 3.3% | 0.51 |
| Jan 30 00:00:00 - 00:59:59 | 608 | 3.2% | 0.17 | 2.2 MB | 4.1% | 0.63 |
| Jan 30 01:00:00 - 01:59:59 | 402 | 2.1% | 0.11 | 1.2 MB | 2.2% | 0.34 |
| Jan 30 02:00:00 - 02:59:59 | 436 | 2.3% | 0.12 | 1.4 MB | 2.6% | 0.40 |
| Jan 30 03:00:00 - 03:59:59 | 337 | 1.8% | 0.09 | 1.2 MB | 2.2% | 0.34 |
| Jan 30 04:00:00 - 04:15:01 | 106 | 0.6% | 0.12 | 355.8 KB | 0.6% | 0.39 |
| TOTAL: 24:00:00 | 18894 | 100.0% | 0.22 | 53.9 MB | 100.0% | 0.64 |
Sites sending bad articles:
| Server | Total | Group | Dist | Duplic | Unapp | TooOld | Site | Line | Other | |
|---|---|---|---|---|---|---|---|---|---|---|
| 1 | i2pn | 487 | 3 | 0 | 0 | 0 | 0 | 0 | 0 | 484 |
| TOTAL: 1 | 487 | 3 | 0 | 0 | 0 | 0 | 0 | 0 | 484 | |
Unwanted newsgroups [Top 20]:
| Newsgroup | Count |
|---|---|
| alt.soupdragons | 2 |
| alt.sex.girl | 1 |
| TOTAL: 2 | 3 |
INND Perl filter [Top 20]:
| Reason | Count |
|---|---|
| Scoring filter (s5) | 69 |
| Scoring filter (s6) | 43 |
| Cancel for rejected article | 4 |
| Scoring filter (s7) | 1 |
| Scoring filter (n6) | 1 |
| TOTAL: 5 | 118 |
Miscellaneous innd statistics [Top 10]:
| Event | Server | Number |
|---|---|---|
| Including strange strings | ||
| i2pn | 366 | |
| TOTAL: 1 | 366 | |
| TOTAL: 1 | 366 | |
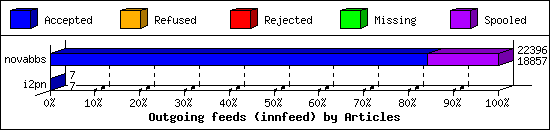
Outgoing Feeds (innfeed) by Articles:
| Server | Offered | Taken | Refused | Reject | Miss | Spool | %Took | Elapsed | |
|---|---|---|---|---|---|---|---|---|---|
| 1 | novabbs | 20990 | 18857 | 0 | 14 | 16 | 3509 | 89% | 23:59:58 |
| 2 | i2pn | 7 | 7 | 0 | 0 | 0 | 0 | 100% | 01:00:00 |
| TOTAL: 2 | 20997 | 18864 | 0 | 14 | 16 | 3509 | 89% | 24:59:58 | |
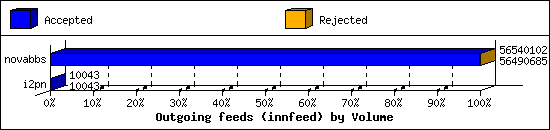
Outgoing Feeds (innfeed) by Volume:
| Server | AcceptVol | RejectVol | TotalVol | Volume/sec | Vol/Art | Elapsed | |
|---|---|---|---|---|---|---|---|
| 1 | novabbs | 53.9 MB | 48.3 KB | 53.9 MB | 0.6 KB/s | 2.9 KB | 23:59:58 |
| 2 | i2pn | 9.8 KB | 0.0 KB | 9.8 KB | 0.0 KB/s | 1.4 KB | 01:00:00 |
| TOTAL: 2 | 53.9 MB | 48.3 KB | 53.9 MB | 0.6 KB/s | 2.9 KB | 24:59:58 | |
NNRP readership statistics:
| System | Conn | Arts | Size | Groups | Post | Rej | Elapsed | |
|---|---|---|---|---|---|---|---|---|
| 1 | 104.131.144.179 | 1 | 0 | 0.0 KB | 0 | 0 | 0 | 00:00:09 |
| 2 | 185.156.177.90 | 1 | 0 | 0.0 KB | 0 | 0 | 0 | 00:00:00 |
| 3 | scan-141.security.ipip.net | 1 | 0 | 0.0 KB | 0 | 0 | 0 | 00:00:02 |
| TOTAL: 3 | 3 | 0 | 0.0 KB | 0 | 0 | 0 | 00:00:12 | |
NNRP readership statistics (by domain):
| System | Conn | Arts | Size | Groups | Post | Rej | Elapsed | |
|---|---|---|---|---|---|---|---|---|
| 1 | *.security.ipip.net | 1 | 0 | 0.0 KB | 0 | 0 | 0 | 00:00:02 |
| 2 | unresolved | 2 | 0 | 0.0 KB | 0 | 0 | 0 | 00:00:10 |
| TOTAL: 2 | 3 | 0 | 0.0 KB | 0 | 0 | 0 | 00:00:12 | |
NNRP total resource statistics [Top 20]:
| System | User(ms) | System(ms) | Idle(ms) | Elapsed |
|---|---|---|---|---|
| 104.131.144.179 | 0.052 | 0.004 | 0.000 | 00:00:09 |
| scan-141.security.ipip.net | 0.044 | 0.004 | 0.000 | 00:00:02 |
| 185.156.177.90 | 0.060 | 0.000 | 0.000 | 00:00:00 |
| TOTAL: 3 | 0.156 | 0.008 | 0.000 | 00:00:12 |
NNRP unrecognized commands (by host):
| System | Conn |
|---|---|
| scan-141.security.ipip.net | 4 |
| 185.156.177.90 | 1 |
| TOTAL: 2 | 5 |
NNRP unrecognized commands (by command):
| Command | Count |
|---|---|
| GET / HTTP/1.1 | 1 |
| #003 | 1 |
| User-Agent: HTTP Banner Detection (https... | 1 |
| Connection: close | 1 |
| Host: 157.230.63.40:119 | 1 |
| TOTAL: 5 | 5 |
NNRP client timeouts [Top 20]:
| System | Conn | Peer |
|---|---|---|
| 185.156.177.90 | 1 | 1 |
| TOTAL: 1 | 1 | 1 |
