
Log entries by program:
| Program name | Lines | %Lines | Size | %Size |
|---|---|---|---|---|
| inn | 19779 | 91.0% | 1.6 MB | 86.3% |
| innd | 1230 | 5.7% | 191.1 KB | 10.0% |
| innfeed | 711 | 3.3% | 70.8 KB | 3.7% |
| nnrpd | 4 | 0.0% | 0.5 KB | 0.0% |
| controlchan | 1 | 0.0% | 0.1 KB | 0.0% |
| TOTAL: 5 | 21725 | 100.0% | 1.9 MB | 100.0% |
History cache:
| Reason | Count | %Count |
|---|---|---|
| Do not exist | 19265 | 97.2% |
| Negative hits | 389 | 2.0% |
| Positive hits | 149 | 0.8% |
| Cache misses | 21 | 0.1% |
| TOTAL: 4 | 19824 | 100.0% |
INND timer:
| Code region | Time | Pct | Invoked | Min(ms) | Avg(ms) | Max(ms) |
|---|---|---|---|---|---|---|
| article cancel | 00:00:00.049 | 0.0% | 190 | 0.000 | 0.258 | 1.000 |
| article cleanup | 00:00:00.123 | 0.0% | 19286 | 0.000 | 0.006 | 0.071 |
| article logging | 00:00:00.577 | 0.0% | 19617 | 0.000 | 0.029 | 0.089 |
| article parse | 00:00:00.321 | 0.0% | 21156 | 0.000 | 0.015 | 0.066 |
| article write | 00:00:03.209 | 0.0% | 19016 | 0.095 | 0.169 | 0.866 |
| artlog/artcncl | 00:00:00.003 | 0.0% | 190 | 0.000 | 0.016 | 0.500 |
| data move | 00:00:00.009 | 0.0% | 23367 | 0.000 | 0.000 | 0.014 |
| hisgrep/artcncl | 00:00:00.000 | 0.0% | 170 | 0.000 | 0.000 | 0.000 |
| hishave/artcncl | 00:00:00.001 | 0.0% | 190 | 0.000 | 0.005 | 0.143 |
| history grep | 00:00:00.000 | 0.0% | 0 | 0.000 | 0.000 | 0.000 |
| history lookup | 00:00:00.085 | 0.0% | 19682 | 0.000 | 0.004 | 0.038 |
| history sync | 00:00:00.016 | 0.0% | 411 | 0.000 | 0.039 | 0.333 |
| history write | 00:00:00.747 | 0.0% | 19286 | 0.000 | 0.039 | 0.235 |
| hiswrite/artcncl | 00:00:00.001 | 0.0% | 20 | 0.000 | 0.050 | 1.000 |
| idle | 24:00:47.206 | 100.0% | 21930 | 1887.909 | 3941.961 | 11555.404 |
| nntp read | 00:00:00.657 | 0.0% | 21590 | 0.000 | 0.030 | 0.075 |
| overview write | 00:00:01.616 | 0.0% | 19016 | 0.013 | 0.085 | 0.464 |
| perl filter | 00:00:14.291 | 0.0% | 19286 | 0.591 | 0.741 | 1.134 |
| python filter | 00:00:00.000 | 0.0% | 0 | 0.000 | 0.000 | 0.000 |
| site send | 00:00:00.543 | 0.0% | 19016 | 0.000 | 0.029 | 0.123 |
| TOTAL: 24:01:13.071 | 24:01:09.454 | 100.0% | - | - | - | - |
INNfeed timer:
| Code region | Time | Pct | Invoked | Min(ms) | Avg(ms) | Max(ms) |
|---|---|---|---|---|---|---|
| article new | 00:00:00.048 | 0.0% | 18979 | 0.000 | 0.003 | 0.031 |
| article prepare | 00:00:00.010 | 0.0% | 75920 | 0.000 | 0.000 | 0.003 |
| article read | 00:00:00.890 | 0.0% | 18979 | 0.000 | 0.047 | 0.341 |
| backlog stats | 00:00:00.030 | 0.0% | 61966 | 0.000 | 0.000 | 0.007 |
| callbacks | 00:00:00.000 | 0.0% | 0 | 0.000 | 0.000 | 0.000 |
| data read | 00:00:00.337 | 0.0% | 38277 | 0.000 | 0.009 | 0.034 |
| data write | 00:00:00.474 | 0.0% | 19358 | 0.000 | 0.024 | 0.069 |
| idle | 23:56:58.907 | 100.0% | 61966 | 662.277 | 1391.391 | 3636.733 |
| status file | 00:00:00.108 | 0.0% | 198 | 0.000 | 0.545 | 3.000 |
| TOTAL: 23:57:01.728 | 23:57:00.804 | 100.0% | - | - | - | - |
nnrpd timer:
| Code region | Time | Pct | Invoked | Min(ms) | Avg(ms) | Max(ms) |
|---|---|---|---|---|---|---|
| idle | 00:00:09.765 | 98.3% | 1 | 9765.000 | 9765.000 | 9765.000 |
| newnews | 00:00:00.000 | 0.0% | 0 | 0.000 | 0.000 | 0.000 |
| nntpwrite | 00:00:00.001 | 0.0% | 2 | 0.500 | 0.500 | 0.500 |
| TOTAL: 00:00:09.929 | 00:00:09.766 | 98.4% | - | - | - | - |
Control commands to INND:
| Command | Number |
|---|---|
| L | 1 |
| flush | 2 |
| flushlogs | 2 |
| go | 2 |
| logmode | 2 |
| mode | 149 |
| name | 2 |
| pause | 2 |
| paused | 2 |
| reload | 2 |
| reserve | 2 |
| TOTAL: 11 | 168 |
Incoming Feeds (INN):
| Server | Connects | Offered | Taken | Refused | Reject | %Accpt | Elapsed | |
|---|---|---|---|---|---|---|---|---|
| 1 | i2pn | 9 | 19120 | 18932 | 0 | 188 | 99% | 24:41:23 |
| 2 | novabbs | 17 | 91 | 11 | 0 | 80 | 12% | 03:09:29 |
| 3 | localhost | 25 | 0 | 0 | 0 | 0 | 0% | 00:00:00 |
| TOTAL: 3 | 51 | 19211 | 18943 | 0 | 268 | 98% | 27:50:52 | |
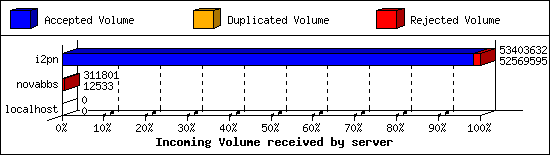
Incoming Volume (INN):
| Server | AcceptVol | DupVol | RejVol | TotalVol | %Acc | Vol/Art | |
|---|---|---|---|---|---|---|---|
| 1 | i2pn | 50.1 MB | 0.0 KB | 814.5 KB | 50.9 MB | 98% | 2.7 KB |
| 2 | novabbs | 12.2 KB | 0.0 KB | 292.3 KB | 304.5 KB | 4% | 3.3 KB |
| 3 | localhost | 0.0 KB | 0.0 KB | 0.0 KB | 0.0 KB | 0% | 0 |
| TOTAL: 3 | 50.1 MB | 0.0 KB | 1.1 MB | 51.2 MB | 97% | 2.7 KB | |
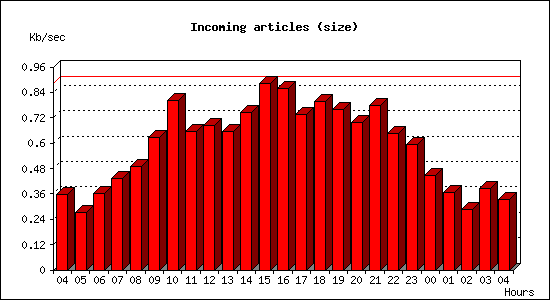
Incoming articles:
| Date | Articles | %Arts | Art/sec | Size | %Size | KB/sec |
|---|---|---|---|---|---|---|
| Feb 1 04:15:02 - 04:59:59 | 287 | 1.5% | 0.11 | 961.2 KB | 1.9% | 0.36 |
| Feb 1 05:00:00 - 05:59:59 | 359 | 1.9% | 0.10 | 985.4 KB | 1.9% | 0.27 |
| Feb 1 06:00:00 - 06:59:59 | 447 | 2.4% | 0.12 | 1.3 MB | 2.5% | 0.36 |
| Feb 1 07:00:00 - 07:59:59 | 572 | 3.0% | 0.16 | 1.5 MB | 3.0% | 0.43 |
| Feb 1 08:00:00 - 08:59:59 | 710 | 3.7% | 0.20 | 1.7 MB | 3.4% | 0.49 |
| Feb 1 09:00:00 - 09:59:59 | 878 | 4.6% | 0.24 | 2.2 MB | 4.4% | 0.62 |
| Feb 1 10:00:00 - 10:59:59 | 1094 | 5.8% | 0.30 | 2.8 MB | 5.6% | 0.80 |
| Feb 1 11:00:00 - 11:59:59 | 931 | 4.9% | 0.26 | 2.3 MB | 4.6% | 0.65 |
| Feb 1 12:00:00 - 12:59:59 | 949 | 5.0% | 0.26 | 2.4 MB | 4.8% | 0.68 |
| Feb 1 13:00:00 - 13:59:59 | 906 | 4.8% | 0.25 | 2.3 MB | 4.6% | 0.65 |
| Feb 1 14:00:00 - 14:59:59 | 1062 | 5.6% | 0.29 | 2.6 MB | 5.2% | 0.75 |
| Feb 1 15:00:00 - 15:59:59 | 1218 | 6.4% | 0.34 | 3.1 MB | 6.2% | 0.88 |
| Feb 1 16:00:00 - 16:59:59 | 1187 | 6.2% | 0.33 | 3.0 MB | 6.0% | 0.86 |
| Feb 1 17:00:00 - 17:59:59 | 991 | 5.2% | 0.28 | 2.6 MB | 5.1% | 0.74 |
| Feb 1 18:00:00 - 18:59:59 | 1069 | 5.6% | 0.30 | 2.8 MB | 5.6% | 0.80 |
| Feb 1 19:00:00 - 19:59:59 | 1069 | 5.6% | 0.30 | 2.7 MB | 5.3% | 0.76 |
| Feb 1 20:00:00 - 20:59:59 | 933 | 4.9% | 0.26 | 2.4 MB | 4.9% | 0.70 |
| Feb 1 21:00:00 - 21:59:59 | 922 | 4.9% | 0.26 | 2.7 MB | 5.4% | 0.78 |
| Feb 1 22:00:00 - 22:59:59 | 849 | 4.5% | 0.24 | 2.3 MB | 4.5% | 0.65 |
| Feb 1 23:00:00 - 23:59:59 | 719 | 3.8% | 0.20 | 2.1 MB | 4.2% | 0.59 |
| Feb 2 00:00:00 - 00:59:59 | 543 | 2.9% | 0.15 | 1.6 MB | 3.1% | 0.45 |
| Feb 2 01:00:00 - 01:59:59 | 411 | 2.2% | 0.11 | 1.3 MB | 2.5% | 0.36 |
| Feb 2 02:00:00 - 02:59:59 | 355 | 1.9% | 0.10 | 1023.2 KB | 2.0% | 0.28 |
| Feb 2 03:00:00 - 03:59:59 | 433 | 2.3% | 0.12 | 1.4 MB | 2.7% | 0.39 |
| Feb 2 04:00:00 - 04:15:01 | 102 | 0.5% | 0.11 | 299.5 KB | 0.6% | 0.33 |
| TOTAL: 23:59:59 | 18996 | 100.0% | 0.22 | 50.3 MB | 100.0% | 0.60 |

Sites sending bad articles:
| Server | Total | Group | Dist | Duplic | Unapp | TooOld | Site | Line | Other | |
|---|---|---|---|---|---|---|---|---|---|---|
| 1 | i2pn | 513 | 1 | 0 | 0 | 0 | 0 | 0 | 0 | 512 |
| 2 | novabbs | 80 | 80 | 0 | 0 | 0 | 0 | 0 | 0 | 0 |
| TOTAL: 2 | 593 | 81 | 0 | 0 | 0 | 0 | 0 | 0 | 512 | |
Unwanted newsgroups [Top 20]:
| Newsgroup | Count |
|---|---|
| rocksolid.shared.feeds.i2p.planet | 63 |
| rocksolid.shared.feeds.i2p.zzz | 16 |
| alt.2600 | 1 |
| rocksolid.nodes | 1 |
| TOTAL: 4 | 81 |
INND Perl filter [Top 20]:
| Reason | Count |
|---|---|
| Scoring filter (s5) | 144 |
| Scoring filter (s6) | 22 |
| Scoring filter (s7) | 16 |
| Scoring filter (n6) | 3 |
| EMP (phl) | 2 |
| TOTAL: 5 | 187 |
Miscellaneous innd statistics [Top 10]:
| Event | Server | Number |
|---|---|---|
| Including strange strings | ||
| i2pn | 325 | |
| TOTAL: 1 | 325 | |
| TOTAL: 1 | 325 | |
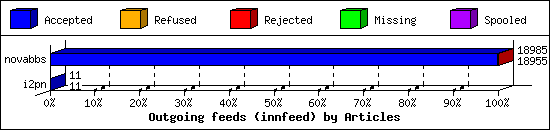
Outgoing Feeds (innfeed) by Articles:
| Server | Offered | Taken | Refused | Reject | Miss | Spool | %Took | Elapsed | |
|---|---|---|---|---|---|---|---|---|---|
| 1 | novabbs | 18989 | 18955 | 0 | 30 | 0 | 0 | 99% | 23:59:57 |
| 2 | i2pn | 11 | 11 | 0 | 0 | 0 | 0 | 100% | 01:45:27 |
| TOTAL: 2 | 19000 | 18966 | 0 | 30 | 0 | 0 | 99% | 25:45:24 | |
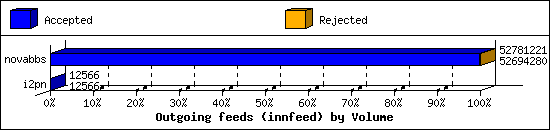
Outgoing Feeds (innfeed) by Volume:
| Server | AcceptVol | RejectVol | TotalVol | Volume/sec | Vol/Art | Elapsed | |
|---|---|---|---|---|---|---|---|
| 1 | novabbs | 50.3 MB | 84.9 KB | 50.3 MB | 0.6 KB/s | 2.7 KB | 23:59:57 |
| 2 | i2pn | 12.3 KB | 0.0 KB | 12.3 KB | 0.0 KB/s | 1.1 KB | 01:45:27 |
| TOTAL: 2 | 50.3 MB | 84.9 KB | 50.3 MB | 0.6 KB/s | 2.7 KB | 25:45:24 | |
NNRP readership statistics:
| System | Conn | Arts | Size | Groups | Post | Rej | Elapsed | |
|---|---|---|---|---|---|---|---|---|
| 1 | 104.131.145.134 | 1 | 0 | 0.0 KB | 0 | 0 | 0 | 00:00:09 |
| TOTAL: 1 | 1 | 0 | 0.0 KB | 0 | 0 | 0 | 00:00:09 | |
NNRP readership statistics (by domain):
| System | Conn | Arts | Size | Groups | Post | Rej | Elapsed | |
|---|---|---|---|---|---|---|---|---|
| 1 | unresolved | 1 | 0 | 0.0 KB | 0 | 0 | 0 | 00:00:09 |
| TOTAL: 1 | 1 | 0 | 0.0 KB | 0 | 0 | 0 | 00:00:09 | |
NNRP total resource statistics [Top 20]:
| System | User(ms) | System(ms) | Idle(ms) | Elapsed |
|---|---|---|---|---|
| 104.131.145.134 | 0.048 | 0.000 | 0.000 | 00:00:09 |
| TOTAL: 1 | 0.048 | 0.000 | 0.000 | 00:00:09 |
