
Log entries by program:
| Program name | Lines | %Lines | Size | %Size |
|---|---|---|---|---|
| inn | 17697 | 88.1% | 1.5 MB | 82.6% |
| innd | 1433 | 7.1% | 208.8 KB | 11.6% |
| innfeed | 955 | 4.8% | 104.2 KB | 5.8% |
| nnrpd | 7 | 0.0% | 0.7 KB | 0.0% |
| controlchan | 4 | 0.0% | 0.3 KB | 0.0% |
| TOTAL: 5 | 20096 | 100.0% | 1.8 MB | 100.0% |
History cache:
| Reason | Count | %Count |
|---|---|---|
| Do not exist | 17120 | 97.2% |
| Negative hits | 429 | 2.4% |
| Positive hits | 41 | 0.2% |
| Cache misses | 15 | 0.1% |
| TOTAL: 4 | 17605 | 100.0% |
INND timer:
| Code region | Time | Pct | Invoked | Min(ms) | Avg(ms) | Max(ms) |
|---|---|---|---|---|---|---|
| article cancel | 00:00:00.022 | 0.0% | 70 | 0.000 | 0.314 | 1.000 |
| article cleanup | 00:00:00.088 | 0.0% | 17122 | 0.000 | 0.005 | 0.049 |
| article logging | 00:00:00.530 | 0.0% | 17556 | 0.000 | 0.030 | 0.091 |
| article parse | 00:00:00.295 | 0.0% | 18898 | 0.000 | 0.016 | 0.053 |
| article write | 00:00:02.928 | 0.0% | 16950 | 0.082 | 0.173 | 0.339 |
| artlog/artcncl | 00:00:00.002 | 0.0% | 70 | 0.000 | 0.029 | 1.000 |
| data move | 00:00:00.013 | 0.0% | 20996 | 0.000 | 0.001 | 0.015 |
| hisgrep/artcncl | 00:00:00.000 | 0.0% | 44 | 0.000 | 0.000 | 0.000 |
| hishave/artcncl | 00:00:00.000 | 0.0% | 70 | 0.000 | 0.000 | 0.000 |
| history grep | 00:00:00.000 | 0.0% | 0 | 0.000 | 0.000 | 0.000 |
| history lookup | 00:00:00.083 | 0.0% | 17560 | 0.000 | 0.005 | 0.038 |
| history sync | 00:00:00.023 | 0.0% | 412 | 0.000 | 0.056 | 0.667 |
| history write | 00:00:00.812 | 0.0% | 17111 | 0.000 | 0.047 | 0.350 |
| hiswrite/artcncl | 00:00:00.000 | 0.0% | 26 | 0.000 | 0.000 | 0.000 |
| idle | 23:50:43.880 | 100.0% | 19818 | 1448.688 | 4331.612 | 13657.727 |
| nntp read | 00:00:00.526 | 0.0% | 19449 | 0.000 | 0.027 | 0.070 |
| overview write | 00:00:01.323 | 0.0% | 16950 | 0.014 | 0.078 | 0.386 |
| perl filter | 00:00:12.648 | 0.0% | 17111 | 0.591 | 0.739 | 1.175 |
| python filter | 00:00:00.000 | 0.0% | 0 | 0.000 | 0.000 | 0.000 |
| site send | 00:00:00.392 | 0.0% | 16950 | 0.000 | 0.023 | 0.072 |
| TOTAL: 23:51:08.159 | 23:51:03.565 | 100.0% | - | - | - | - |
INNfeed timer:
| Code region | Time | Pct | Invoked | Min(ms) | Avg(ms) | Max(ms) |
|---|---|---|---|---|---|---|
| article new | 00:00:00.026 | 0.0% | 16892 | 0.000 | 0.002 | 0.024 |
| article prepare | 00:00:00.012 | 0.0% | 67368 | 0.000 | 0.000 | 0.004 |
| article read | 00:00:00.809 | 0.0% | 16842 | 0.000 | 0.048 | 0.633 |
| backlog stats | 00:00:00.026 | 0.0% | 56164 | 0.000 | 0.000 | 0.006 |
| callbacks | 00:00:00.000 | 0.0% | 0 | 0.000 | 0.000 | 0.000 |
| data read | 00:00:00.306 | 0.0% | 34290 | 0.000 | 0.009 | 0.029 |
| data write | 00:00:00.432 | 0.0% | 17469 | 0.000 | 0.025 | 0.065 |
| idle | 23:47:50.917 | 100.0% | 56164 | 643.995 | 1525.371 | 4769.365 |
| status file | 00:00:00.407 | 0.0% | 283 | 0.000 | 1.438 | 66.250 |
| TOTAL: 23:47:54.042 | 23:47:52.935 | 100.0% | - | - | - | - |
nnrpd timer:
| Code region | Time | Pct | Invoked | Min(ms) | Avg(ms) | Max(ms) |
|---|---|---|---|---|---|---|
| idle | 00:00:00.154 | 20.5% | 2 | 77.000 | 77.000 | 77.000 |
| newnews | 00:00:00.000 | 0.0% | 0 | 0.000 | 0.000 | 0.000 |
| nntpwrite | 00:00:00.001 | 0.1% | 11 | 0.091 | 0.091 | 0.091 |
| TOTAL: 00:00:00.750 | 00:00:00.155 | 20.7% | - | - | - | - |
Control commands to INND:
| Command | Number |
|---|---|
| L | 1 |
| flush | 2 |
| flushlogs | 2 |
| go | 2 |
| logmode | 2 |
| mode | 149 |
| name | 2 |
| newgroup | 3 |
| pause | 2 |
| paused | 2 |
| reload | 2 |
| reserve | 2 |
| TOTAL: 12 | 171 |
Newsgroups created:
| Group | Mode |
|---|---|
| rocksolid.nodes | y |
| rocksolid.nodes.announce | y |
| rocksolid.nodes.help | y |
| TOTAL | 3 |
Incoming Feeds (INN):
| Server | Connects | Offered | Taken | Refused | Reject | %Accpt | Elapsed | |
|---|---|---|---|---|---|---|---|---|
| 1 | i2pn | 35 | 17150 | 17001 | 0 | 149 | 99% | 25:30:52 |
| 2 | novabbs | 38 | 76 | 50 | 1 | 25 | 65% | 07:14:59 |
| 3 | localhost | 25 | 0 | 0 | 0 | 0 | 0% | 00:00:00 |
| TOTAL: 3 | 98 | 17226 | 17051 | 1 | 174 | 98% | 32:45:51 | |
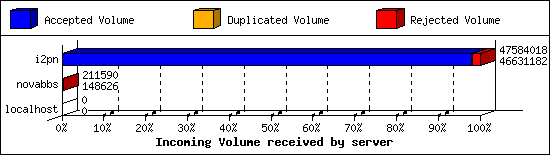
Incoming Volume (INN):
| Server | AcceptVol | DupVol | RejVol | TotalVol | %Acc | Vol/Art | |
|---|---|---|---|---|---|---|---|
| 1 | i2pn | 44.5 MB | 45.9 KB | 884.6 KB | 45.4 MB | 97% | 2.7 KB |
| 2 | novabbs | 145.1 KB | 0.0 KB | 61.5 KB | 206.6 KB | 70% | 2.8 KB |
| 3 | localhost | 0.0 KB | 0.0 KB | 0.0 KB | 0.0 KB | 0% | 0 |
| TOTAL: 3 | 44.6 MB | 45.9 KB | 946.1 KB | 45.6 MB | 97% | 2.7 KB | |
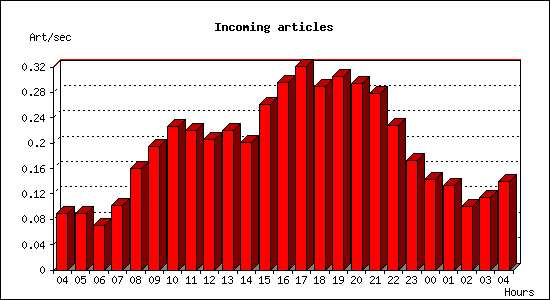
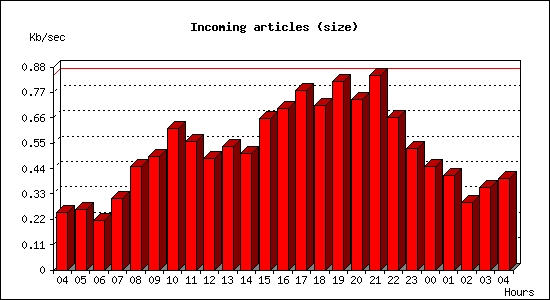
Incoming articles:
| Date | Articles | %Arts | Art/sec | Size | %Size | KB/sec |
|---|---|---|---|---|---|---|
| Feb 3 04:15:01 - 04:59:59 | 242 | 1.4% | 0.09 | 669.2 KB | 1.5% | 0.25 |
| Feb 3 05:00:00 - 05:59:59 | 323 | 1.9% | 0.09 | 950.4 KB | 2.1% | 0.26 |
| Feb 3 06:00:00 - 06:59:59 | 252 | 1.5% | 0.07 | 775.1 KB | 1.7% | 0.22 |
| Feb 3 07:00:00 - 07:59:59 | 367 | 2.2% | 0.10 | 1.1 MB | 2.5% | 0.31 |
| Feb 3 08:00:00 - 08:59:59 | 578 | 3.4% | 0.16 | 1.6 MB | 3.5% | 0.45 |
| Feb 3 09:00:00 - 09:59:59 | 702 | 4.1% | 0.20 | 1.7 MB | 3.9% | 0.49 |
| Feb 3 10:00:00 - 10:59:59 | 812 | 4.8% | 0.23 | 2.2 MB | 4.9% | 0.61 |
| Feb 3 11:00:00 - 11:59:59 | 791 | 4.6% | 0.22 | 2.0 MB | 4.4% | 0.56 |
| Feb 3 12:00:00 - 12:59:59 | 738 | 4.3% | 0.20 | 1.7 MB | 3.8% | 0.48 |
| Feb 3 13:00:00 - 13:59:59 | 791 | 4.6% | 0.22 | 1.9 MB | 4.2% | 0.54 |
| Feb 3 14:00:00 - 14:59:59 | 725 | 4.3% | 0.20 | 1.8 MB | 4.0% | 0.51 |
| Feb 3 15:00:00 - 15:59:59 | 938 | 5.5% | 0.26 | 2.3 MB | 5.2% | 0.66 |
| Feb 3 16:00:00 - 16:59:59 | 1064 | 6.3% | 0.30 | 2.5 MB | 5.5% | 0.70 |
| Feb 3 17:00:00 - 17:59:59 | 1152 | 6.8% | 0.32 | 2.7 MB | 6.1% | 0.78 |
| Feb 3 18:00:00 - 18:59:59 | 1044 | 6.1% | 0.29 | 2.5 MB | 5.6% | 0.71 |
| Feb 3 19:00:00 - 19:59:59 | 1099 | 6.5% | 0.31 | 2.9 MB | 6.5% | 0.82 |
| Feb 3 20:00:00 - 20:59:59 | 1059 | 6.2% | 0.29 | 2.6 MB | 5.8% | 0.74 |
| Feb 3 21:00:00 - 21:59:59 | 1004 | 5.9% | 0.28 | 3.0 MB | 6.7% | 0.84 |
| Feb 3 22:00:00 - 22:59:59 | 820 | 4.8% | 0.23 | 2.3 MB | 5.2% | 0.66 |
| Feb 3 23:00:00 - 23:59:59 | 622 | 3.7% | 0.17 | 1.9 MB | 4.2% | 0.53 |
| Feb 4 00:00:00 - 00:59:59 | 515 | 3.0% | 0.14 | 1.6 MB | 3.5% | 0.45 |
| Feb 4 01:00:00 - 01:59:59 | 477 | 2.8% | 0.13 | 1.4 MB | 3.2% | 0.41 |
| Feb 4 02:00:00 - 02:59:59 | 363 | 2.1% | 0.10 | 1.0 MB | 2.3% | 0.29 |
| Feb 4 03:00:00 - 03:59:59 | 413 | 2.4% | 0.11 | 1.3 MB | 2.8% | 0.36 |
| Feb 4 04:00:00 - 04:15:01 | 125 | 0.7% | 0.14 | 356.3 KB | 0.8% | 0.40 |
| TOTAL: 24:00:00 | 17016 | 100.0% | 0.20 | 44.5 MB | 100.0% | 0.53 |
Sites sending bad articles:
| Server | Total | Group | Dist | Duplic | Unapp | TooOld | Site | Line | Other | |
|---|---|---|---|---|---|---|---|---|---|---|
| 1 | i2pn | 585 | 2 | 0 | 11 | 0 | 0 | 0 | 0 | 572 |
| 2 | novabbs | 26 | 12 | 0 | 0 | 0 | 0 | 0 | 0 | 14 |
| TOTAL: 2 | 611 | 14 | 0 | 11 | 0 | 0 | 0 | 0 | 586 | |
Unwanted newsgroups [Top 20]:
| Newsgroup | Count |
|---|---|
| rocksolid.shared.feeds.i2p.planet | 12 |
| hk.politics | 2 |
| TOTAL: 2 | 14 |
INND Perl filter [Top 20]:
| Reason | Count |
|---|---|
| Scoring filter (s5) | 66 |
| Scoring filter (n7) | 41 |
| Scoring filter (s6) | 27 |
| EMP (md5) | 13 |
| Scoring filter (s1) | 1 |
| Scoring filter (n6) | 1 |
| TOTAL: 6 | 149 |
Miscellaneous innd statistics [Top 10]:
| Event | Server | Number |
|---|---|---|
| Including strange strings | ||
| i2pn | 436 | |
| novabbs | 1 | |
| TOTAL: 2 | 437 | |
| TOTAL: 1 | 437 | |
Outgoing Feeds (innfeed) by Articles:
| Server | Offered | Taken | Refused | Reject | Miss | Spool | %Took | Elapsed | |
|---|---|---|---|---|---|---|---|---|---|
| 1 | novabbs | 16969 | 16899 | 1 | 66 | 0 | 8 | 99% | 23:59:49 |
| 2 | i2pn | 60 | 6 | 41 | 3 | 0 | 0 | 10% | 05:29:33 |
| TOTAL: 2 | 17029 | 16905 | 42 | 69 | 0 | 8 | 99% | 29:29:22 | |

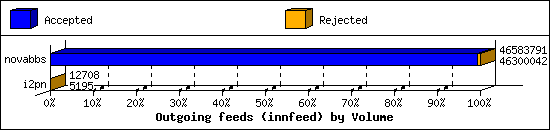
Outgoing Feeds (innfeed) by Volume:
| Server | AcceptVol | RejectVol | TotalVol | Volume/sec | Vol/Art | Elapsed | |
|---|---|---|---|---|---|---|---|
| 1 | novabbs | 44.2 MB | 277.1 KB | 44.4 MB | 0.5 KB/s | 2.7 KB | 23:59:49 |
| 2 | i2pn | 5.1 KB | 7.3 KB | 12.4 KB | 0.0 KB/s | 1.4 KB | 05:29:33 |
| TOTAL: 2 | 44.2 MB | 284.4 KB | 44.4 MB | 0.4 KB/s | 2.7 KB | 29:29:22 | |
NNRP readership statistics:
| System | Conn | Arts | Size | Groups | Post | Rej | Elapsed | |
|---|---|---|---|---|---|---|---|---|
| 1 | scan-141.security.ipip.net | 1 | 0 | 0.0 KB | 0 | 0 | 0 | 00:00:00 |
| TOTAL: 1 | 1 | 0 | 0.0 KB | 0 | 0 | 0 | 00:00:00 | |
NNRP readership statistics (by domain):
| System | Conn | Arts | Size | Groups | Post | Rej | Elapsed | |
|---|---|---|---|---|---|---|---|---|
| 1 | *.security.ipip.net | 1 | 0 | 0.0 KB | 0 | 0 | 0 | 00:00:00 |
| TOTAL: 1 | 1 | 0 | 0.0 KB | 0 | 0 | 0 | 00:00:00 | |
NNRP total resource statistics [Top 20]:
| System | User(ms) | System(ms) | Idle(ms) | Elapsed |
|---|---|---|---|---|
| scan-141.security.ipip.net | 0.060 | 0.004 | 0.000 | 00:00:00 |
| TOTAL: 1 | 0.060 | 0.004 | 0.000 | 00:00:00 |
NNRP unrecognized commands (by host):
| System | Conn |
|---|---|
| scan-141.security.ipip.net | 4 |
| TOTAL: 1 | 4 |
NNRP unrecognized commands (by command):
| Command | Count |
|---|---|
| User-Agent: HTTP Banner Detection (https... | 1 |
| Host: 157.230.63.40:119 | 1 |
| Connection: close | 1 |
| GET / HTTP/1.1 | 1 |
| TOTAL: 4 | 4 |
