Log entries by program:
| Program name | Lines | %Lines | Size | %Size |
|---|---|---|---|---|
| inn | 19754 | 90.1% | 1.6 MB | 85.2% |
| innd | 1271 | 5.8% | 182.8 KB | 9.5% |
| innfeed | 873 | 4.0% | 101.5 KB | 5.3% |
| nnrpd | 11 | 0.1% | 1.2 KB | 0.1% |
| controlchan | 4 | 0.0% | 0.3 KB | 0.0% |
| TOTAL: 5 | 21913 | 100.0% | 1.9 MB | 100.0% |
History cache:
| Reason | Count | %Count |
|---|---|---|
| Do not exist | 19202 | 97.4% |
| Negative hits | 459 | 2.3% |
| Positive hits | 40 | 0.2% |
| Cache misses | 10 | 0.1% |
| TOTAL: 4 | 19711 | 100.0% |
INND timer:
| Code region | Time | Pct | Invoked | Min(ms) | Avg(ms) | Max(ms) |
|---|---|---|---|---|---|---|
| article cancel | 00:00:00.059 | 0.0% | 50 | 0.000 | 1.180 | 6.250 |
| article cleanup | 00:00:00.088 | 0.0% | 19280 | 0.000 | 0.005 | 0.035 |
| article logging | 00:00:00.672 | 0.0% | 19742 | 0.000 | 0.034 | 0.104 |
| article parse | 00:00:00.263 | 0.0% | 21174 | 0.000 | 0.012 | 0.054 |
| article write | 00:00:03.288 | 0.0% | 19117 | 0.074 | 0.172 | 1.494 |
| artlog/artcncl | 00:00:00.002 | 0.0% | 50 | 0.000 | 0.040 | 1.000 |
| data move | 00:00:00.014 | 0.0% | 23552 | 0.000 | 0.001 | 0.010 |
| hisgrep/artcncl | 00:00:00.000 | 0.0% | 42 | 0.000 | 0.000 | 0.000 |
| hishave/artcncl | 00:00:00.000 | 0.0% | 50 | 0.000 | 0.000 | 0.000 |
| history grep | 00:00:00.000 | 0.0% | 0 | 0.000 | 0.000 | 0.000 |
| history lookup | 00:00:00.098 | 0.0% | 19752 | 0.000 | 0.005 | 0.035 |
| history sync | 00:00:00.027 | 0.0% | 415 | 0.000 | 0.065 | 0.667 |
| history write | 00:00:00.827 | 0.0% | 19277 | 0.000 | 0.043 | 0.224 |
| hiswrite/artcncl | 00:00:00.000 | 0.0% | 8 | 0.000 | 0.000 | 0.000 |
| idle | 24:00:43.801 | 100.0% | 22081 | 1961.069 | 3914.850 | 9843.180 |
| nntp read | 00:00:00.635 | 0.0% | 21728 | 0.000 | 0.029 | 0.069 |
| overview write | 00:00:01.683 | 0.0% | 19117 | 0.013 | 0.088 | 4.000 |
| perl filter | 00:00:14.446 | 0.0% | 19277 | 0.524 | 0.749 | 0.953 |
| python filter | 00:00:00.000 | 0.0% | 0 | 0.000 | 0.000 | 0.000 |
| site send | 00:00:00.374 | 0.0% | 19117 | 0.000 | 0.020 | 0.056 |
| TOTAL: 24:01:10.151 | 24:01:06.277 | 100.0% | - | - | - | - |
INNfeed timer:
| Code region | Time | Pct | Invoked | Min(ms) | Avg(ms) | Max(ms) |
|---|---|---|---|---|---|---|
| article new | 00:00:00.069 | 0.0% | 81767 | 0.000 | 0.001 | 0.022 |
| article prepare | 00:00:00.009 | 0.0% | 75764 | 0.000 | 0.000 | 0.002 |
| article read | 00:00:00.960 | 0.0% | 18941 | 0.000 | 0.051 | 1.183 |
| backlog stats | 00:00:00.023 | 0.0% | 100550 | 0.000 | 0.000 | 0.005 |
| callbacks | 00:00:00.000 | 0.0% | 0 | 0.000 | 0.000 | 0.000 |
| data read | 00:00:00.450 | 0.0% | 59582 | 0.000 | 0.008 | 0.031 |
| data write | 00:00:00.663 | 0.0% | 39114 | 0.000 | 0.017 | 0.095 |
| idle | 23:48:51.136 | 100.0% | 100550 | 88.405 | 852.622 | 3141.643 |
| status file | 00:00:00.183 | 0.0% | 260 | 0.000 | 0.704 | 6.333 |
| TOTAL: 23:48:55.086 | 23:48:53.493 | 100.0% | - | - | - | - |
nnrpd timer:
| Code region | Time | Pct | Invoked | Min(ms) | Avg(ms) | Max(ms) |
|---|---|---|---|---|---|---|
| idle | 00:00:09.874 | 96.7% | 3 | 58.000 | 3291.333 | 9758.000 |
| newnews | 00:00:00.000 | 0.0% | 0 | 0.000 | 0.000 | 0.000 |
| nntpwrite | 00:00:00.000 | 0.0% | 6 | 0.000 | 0.000 | 0.000 |
| TOTAL: 00:00:10.206 | 00:00:09.874 | 96.7% | - | - | - | - |
Control commands to INND:
| Command | Number |
|---|---|
| L | 1 |
| flush | 2 |
| flushlogs | 2 |
| go | 2 |
| logmode | 2 |
| mode | 149 |
| name | 2 |
| newgroup | 3 |
| pause | 2 |
| paused | 2 |
| reload | 2 |
| reserve | 2 |
| TOTAL: 12 | 171 |
Newsgroups created:
| Group | Mode |
|---|---|
| neodome.announce | y |
| neodome.general | y |
| neodome.test | y |
| TOTAL | 3 |
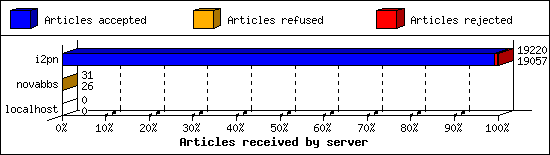
Incoming Feeds (INN):
| Server | Connects | Offered | Taken | Refused | Reject | %Accpt | Elapsed | |
|---|---|---|---|---|---|---|---|---|
| 1 | i2pn | 16 | 19220 | 19057 | 2 | 161 | 99% | 25:18:35 |
| 2 | novabbs | 24 | 31 | 26 | 5 | 0 | 83% | 03:47:50 |
| 3 | localhost | 25 | 0 | 0 | 0 | 0 | 0% | 00:00:00 |
| TOTAL: 3 | 65 | 19251 | 19083 | 7 | 161 | 99% | 29:06:25 | |
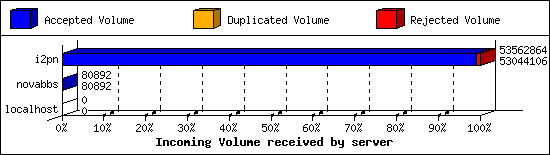
Incoming Volume (INN):
| Server | AcceptVol | DupVol | RejVol | TotalVol | %Acc | Vol/Art | |
|---|---|---|---|---|---|---|---|
| 1 | i2pn | 50.6 MB | 10.1 KB | 496.5 KB | 51.1 MB | 99% | 2.7 KB |
| 2 | novabbs | 79.0 KB | 0.0 KB | 0.0 KB | 79.0 KB | 100% | 3.0 KB |
| 3 | localhost | 0.0 KB | 0.0 KB | 0.0 KB | 0.0 KB | 0% | 0 |
| TOTAL: 3 | 50.7 MB | 10.1 KB | 496.5 KB | 51.2 MB | 99% | 2.7 KB | |
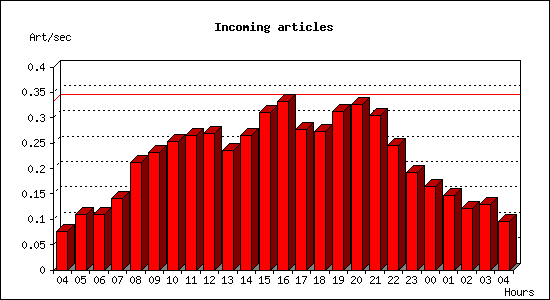
Incoming articles:
| Date | Articles | %Arts | Art/sec | Size | %Size | KB/sec |
|---|---|---|---|---|---|---|
| Feb 4 04:15:01 - 04:59:59 | 204 | 1.1% | 0.08 | 666.9 KB | 1.3% | 0.25 |
| Feb 4 05:00:00 - 05:59:59 | 395 | 2.1% | 0.11 | 1.0 MB | 2.0% | 0.29 |
| Feb 4 06:00:00 - 06:59:59 | 392 | 2.1% | 0.11 | 1.1 MB | 2.1% | 0.30 |
| Feb 4 07:00:00 - 07:59:59 | 506 | 2.7% | 0.14 | 1.3 MB | 2.6% | 0.37 |
| Feb 4 08:00:00 - 08:59:59 | 762 | 4.0% | 0.21 | 1.9 MB | 3.7% | 0.53 |
| Feb 4 09:00:00 - 09:59:59 | 834 | 4.4% | 0.23 | 2.1 MB | 4.1% | 0.59 |
| Feb 4 10:00:00 - 10:59:59 | 912 | 4.8% | 0.25 | 2.0 MB | 4.0% | 0.58 |
| Feb 4 11:00:00 - 11:59:59 | 952 | 5.0% | 0.26 | 2.4 MB | 4.7% | 0.68 |
| Feb 4 12:00:00 - 12:59:59 | 969 | 5.1% | 0.27 | 2.3 MB | 4.6% | 0.66 |
| Feb 4 13:00:00 - 13:59:59 | 851 | 4.5% | 0.24 | 2.0 MB | 4.0% | 0.58 |
| Feb 4 14:00:00 - 14:59:59 | 951 | 5.0% | 0.26 | 2.3 MB | 4.6% | 0.66 |
| Feb 4 15:00:00 - 15:59:59 | 1118 | 5.9% | 0.31 | 2.9 MB | 5.7% | 0.82 |
| Feb 4 16:00:00 - 16:59:59 | 1195 | 6.3% | 0.33 | 2.9 MB | 5.7% | 0.82 |
| Feb 4 17:00:00 - 17:59:59 | 996 | 5.2% | 0.28 | 2.4 MB | 4.8% | 0.69 |
| Feb 4 18:00:00 - 18:59:59 | 985 | 5.2% | 0.27 | 2.7 MB | 5.4% | 0.77 |
| Feb 4 19:00:00 - 19:59:59 | 1123 | 5.9% | 0.31 | 3.2 MB | 6.3% | 0.91 |
| Feb 4 20:00:00 - 20:59:59 | 1174 | 6.2% | 0.33 | 3.2 MB | 6.3% | 0.91 |
| Feb 4 21:00:00 - 21:59:59 | 1093 | 5.7% | 0.30 | 3.1 MB | 6.2% | 0.89 |
| Feb 4 22:00:00 - 22:59:59 | 880 | 4.6% | 0.24 | 2.6 MB | 5.2% | 0.75 |
| Feb 4 23:00:00 - 23:59:59 | 690 | 3.6% | 0.19 | 2.0 MB | 4.0% | 0.58 |
| Feb 5 00:00:00 - 00:59:59 | 589 | 3.1% | 0.16 | 1.9 MB | 3.8% | 0.55 |
| Feb 5 01:00:00 - 01:59:59 | 528 | 2.8% | 0.15 | 1.6 MB | 3.1% | 0.45 |
| Feb 5 02:00:00 - 02:59:59 | 436 | 2.3% | 0.12 | 1.3 MB | 2.5% | 0.36 |
| Feb 5 03:00:00 - 03:59:59 | 462 | 2.4% | 0.13 | 1.4 MB | 2.8% | 0.41 |
| Feb 5 04:00:00 - 04:15:01 | 86 | 0.5% | 0.10 | 242.4 KB | 0.5% | 0.27 |
| TOTAL: 24:00:00 | 19083 | 100.0% | 0.22 | 50.7 MB | 100.0% | 0.60 |

Sites sending bad articles:
| Server | Total | Group | Dist | Duplic | Unapp | TooOld | Site | Line | Other | |
|---|---|---|---|---|---|---|---|---|---|---|
| 1 | i2pn | 620 | 15 | 0 | 3 | 0 | 0 | 0 | 0 | 602 |
| 2 | novabbs | 1 | 0 | 0 | 0 | 0 | 0 | 0 | 0 | 1 |
| TOTAL: 2 | 621 | 15 | 0 | 3 | 0 | 0 | 0 | 0 | 603 | |
Unwanted newsgroups [Top 20]:
| Newsgroup | Count |
|---|---|
| alt.pl.nieruchomosci.gielda | 12 |
| alt.2600 | 2 |
| alt.sex.girl | 1 |
| TOTAL: 3 | 15 |
INND Perl filter [Top 20]:
| Reason | Count |
|---|---|
| Scoring filter (s5) | 109 |
| Scoring filter (s6) | 16 |
| Scoring filter (s7) | 16 |
| Scoring filter (s1) | 1 |
| Scoring filter (n6) | 1 |
| TOTAL: 5 | 143 |
Miscellaneous innd statistics [Top 10]:
| Event | Server | Number |
|---|---|---|
| Including strange strings | ||
| i2pn | 459 | |
| novabbs | 1 | |
| TOTAL: 2 | 460 | |
| TOTAL: 1 | 460 | |
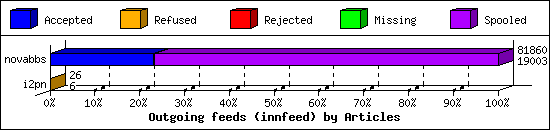
Outgoing Feeds (innfeed) by Articles:
| Server | Offered | Taken | Refused | Reject | Miss | Spool | %Took | Elapsed | |
|---|---|---|---|---|---|---|---|---|---|
| 1 | novabbs | 91449 | 19003 | 4 | 49 | 0 | 62804 | 20% | 23:59:48 |
| 2 | i2pn | 29 | 6 | 20 | 0 | 0 | 0 | 20% | 02:44:46 |
| TOTAL: 2 | 91478 | 19009 | 24 | 49 | 0 | 62804 | 20% | 26:44:34 | |
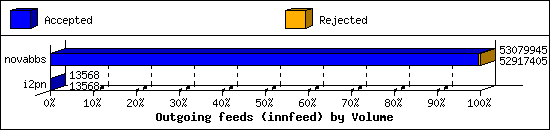
Outgoing Feeds (innfeed) by Volume:
| Server | AcceptVol | RejectVol | TotalVol | Volume/sec | Vol/Art | Elapsed | |
|---|---|---|---|---|---|---|---|
| 1 | novabbs | 50.5 MB | 158.7 KB | 50.6 MB | 0.6 KB/s | 2.7 KB | 23:59:48 |
| 2 | i2pn | 13.2 KB | 0.0 KB | 13.2 KB | 0.0 KB/s | 2.2 KB | 02:44:46 |
| TOTAL: 2 | 50.5 MB | 158.7 KB | 50.6 MB | 0.5 KB/s | 2.7 KB | 26:44:34 | |
NNRP readership statistics:
| System | Conn | Arts | Size | Groups | Post | Rej | Elapsed | |
|---|---|---|---|---|---|---|---|---|
| 1 | 104.131.144.192 | 1 | 0 | 0.0 KB | 0 | 0 | 0 | 00:00:09 |
| 2 | 95.213.143.220 | 1 | 0 | 0.0 KB | 0 | 0 | 0 | 00:00:00 |
| TOTAL: 2 | 2 | 0 | 0.0 KB | 0 | 0 | 0 | 00:00:10 | |
NNRP readership statistics (by domain):
| System | Conn | Arts | Size | Groups | Post | Rej | Elapsed | |
|---|---|---|---|---|---|---|---|---|
| 1 | unresolved | 2 | 0 | 0.0 KB | 0 | 0 | 0 | 00:00:10 |
| TOTAL: 1 | 2 | 0 | 0.0 KB | 0 | 0 | 0 | 00:00:10 | |
NNRP total resource statistics [Top 20]:
| System | User(ms) | System(ms) | Idle(ms) | Elapsed |
|---|---|---|---|---|
| 104.131.144.192 | 0.036 | 0.008 | 0.000 | 00:00:09 |
| 95.213.143.220 | 0.052 | 0.004 | 0.000 | 00:00:00 |
| TOTAL: 2 | 0.088 | 0.012 | 0.000 | 00:00:10 |
NNRP unrecognized commands (by host):
| System | Conn |
|---|---|
| 95.213.143.220 | 1 |
| TOTAL: 1 | 1 |
NNRP unrecognized commands (by command):
| Command | Count |
|---|---|
| #003 | 1 |
| TOTAL: 1 | 1 |
NNRP client timeouts [Top 20]:
| System | Conn | Peer |
|---|---|---|
| 95.213.143.220 | 1 | 1 |
| TOTAL: 1 | 1 | 1 |
