Log entries by program:
| Program name | Lines | %Lines | Size | %Size |
|---|---|---|---|---|
| inn | 18662 | 90.6% | 1.5 MB | 85.5% |
| innd | 1185 | 5.8% | 170.7 KB | 9.4% |
| innfeed | 738 | 3.6% | 91.9 KB | 5.1% |
| nnrpd | 11 | 0.1% | 1.1 KB | 0.1% |
| controlchan | 1 | 0.0% | 0.1 KB | 0.0% |
| TOTAL: 5 | 20597 | 100.0% | 1.8 MB | 100.0% |
History cache:
| Reason | Count | %Count |
|---|---|---|
| Do not exist | 18106 | 98.4% |
| Negative hits | 220 | 1.2% |
| Positive hits | 35 | 0.2% |
| Cache misses | 33 | 0.2% |
| TOTAL: 4 | 18394 | 100.0% |
INND timer:
| Code region | Time | Pct | Invoked | Min(ms) | Avg(ms) | Max(ms) |
|---|---|---|---|---|---|---|
| article cancel | 00:00:00.089 | 0.0% | 77 | 0.000 | 1.156 | 26.000 |
| article cleanup | 00:00:00.087 | 0.0% | 18147 | 0.000 | 0.005 | 0.043 |
| article logging | 00:00:00.497 | 0.0% | 18575 | 0.000 | 0.027 | 0.093 |
| article parse | 00:00:00.275 | 0.0% | 19937 | 0.000 | 0.014 | 0.048 |
| article write | 00:00:03.477 | 0.0% | 18000 | 0.084 | 0.193 | 1.284 |
| artlog/artcncl | 00:00:00.001 | 0.0% | 76 | 0.000 | 0.013 | 0.100 |
| data move | 00:00:00.006 | 0.0% | 21977 | 0.000 | 0.000 | 0.014 |
| hisgrep/artcncl | 00:00:00.001 | 0.0% | 64 | 0.000 | 0.016 | 1.000 |
| hishave/artcncl | 00:00:00.000 | 0.0% | 77 | 0.000 | 0.000 | 0.000 |
| history grep | 00:00:00.000 | 0.0% | 0 | 0.000 | 0.000 | 0.000 |
| history lookup | 00:00:00.073 | 0.0% | 18387 | 0.000 | 0.004 | 0.046 |
| history sync | 00:00:00.009 | 0.0% | 421 | 0.000 | 0.021 | 0.500 |
| history write | 00:00:00.665 | 0.0% | 18146 | 0.000 | 0.037 | 0.131 |
| hiswrite/artcncl | 00:00:00.001 | 0.0% | 13 | 0.000 | 0.077 | 0.100 |
| idle | 24:00:43.704 | 100.0% | 20577 | 2431.741 | 4200.987 | 12501.854 |
| nntp read | 00:00:00.530 | 0.0% | 20227 | 0.000 | 0.026 | 0.082 |
| overview write | 00:00:01.513 | 0.0% | 18000 | 0.000 | 0.084 | 0.922 |
| perl filter | 00:00:13.324 | 0.0% | 18146 | 0.593 | 0.734 | 1.116 |
| python filter | 00:00:00.000 | 0.0% | 0 | 0.000 | 0.000 | 0.000 |
| site send | 00:00:00.586 | 0.0% | 18000 | 0.000 | 0.033 | 0.091 |
| TOTAL: 24:01:08.290 | 24:01:04.838 | 100.0% | - | - | - | - |
INNfeed timer:
| Code region | Time | Pct | Invoked | Min(ms) | Avg(ms) | Max(ms) |
|---|---|---|---|---|---|---|
| article new | 00:00:00.033 | 0.0% | 17946 | 0.000 | 0.002 | 0.035 |
| article prepare | 00:00:00.009 | 0.0% | 71644 | 0.000 | 0.000 | 0.004 |
| article read | 00:00:00.727 | 0.0% | 17911 | 0.000 | 0.041 | 0.449 |
| backlog stats | 00:00:00.016 | 0.0% | 58963 | 0.000 | 0.000 | 0.010 |
| callbacks | 00:00:00.000 | 0.0% | 0 | 0.000 | 0.000 | 0.000 |
| data read | 00:00:00.271 | 0.0% | 36257 | 0.000 | 0.007 | 0.027 |
| data write | 00:00:00.446 | 0.0% | 18343 | 0.000 | 0.024 | 0.082 |
| idle | 23:50:16.528 | 100.0% | 58963 | 892.959 | 1455.430 | 4267.362 |
| status file | 00:00:00.127 | 0.0% | 206 | 0.000 | 0.617 | 4.750 |
| TOTAL: 23:50:19.057 | 23:50:18.157 | 100.0% | - | - | - | - |
nnrpd timer:
| Code region | Time | Pct | Invoked | Min(ms) | Avg(ms) | Max(ms) |
|---|---|---|---|---|---|---|
| idle | 00:00:01.068 | 87.1% | 2 | 534.000 | 534.000 | 534.000 |
| newnews | 00:00:00.000 | 0.0% | 0 | 0.000 | 0.000 | 0.000 |
| nntpwrite | 00:00:00.000 | 0.0% | 13 | 0.000 | 0.000 | 0.000 |
| TOTAL: 00:00:01.226 | 00:00:01.068 | 87.1% | - | - | - | - |
Control commands to INND:
| Command | Number |
|---|---|
| L | 1 |
| flush | 2 |
| flushlogs | 2 |
| go | 2 |
| logmode | 2 |
| mode | 149 |
| name | 2 |
| pause | 2 |
| paused | 2 |
| reload | 2 |
| reserve | 2 |
| TOTAL: 11 | 168 |
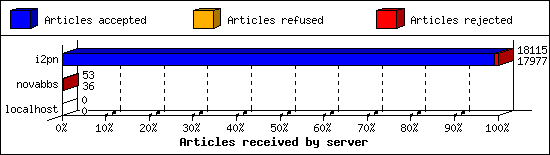
Incoming Feeds (INN):
| Server | Connects | Offered | Taken | Refused | Reject | %Accpt | Elapsed | |
|---|---|---|---|---|---|---|---|---|
| 1 | i2pn | 5 | 18115 | 17977 | 0 | 138 | 99% | 24:33:23 |
| 2 | novabbs | 21 | 53 | 36 | 8 | 9 | 67% | 04:14:48 |
| 3 | localhost | 25 | 0 | 0 | 0 | 0 | 0% | 00:00:00 |
| TOTAL: 3 | 51 | 18168 | 18013 | 8 | 147 | 99% | 28:48:11 | |
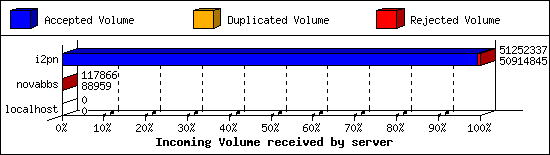
Incoming Volume (INN):
| Server | AcceptVol | DupVol | RejVol | TotalVol | %Acc | Vol/Art | |
|---|---|---|---|---|---|---|---|
| 1 | i2pn | 48.6 MB | 2.6 KB | 327.0 KB | 48.9 MB | 99% | 2.8 KB |
| 2 | novabbs | 86.9 KB | 0.0 KB | 28.2 KB | 115.1 KB | 75% | 2.6 KB |
| 3 | localhost | 0.0 KB | 0.0 KB | 0.0 KB | 0.0 KB | 0% | 0 |
| TOTAL: 3 | 48.6 MB | 2.6 KB | 355.2 KB | 49.0 MB | 99% | 2.8 KB | |
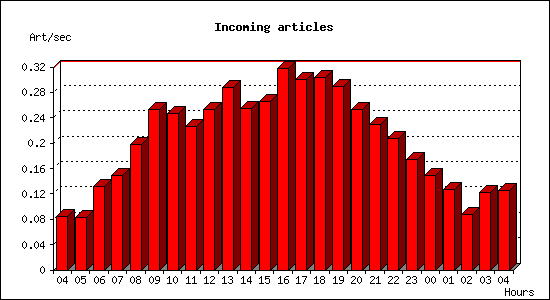
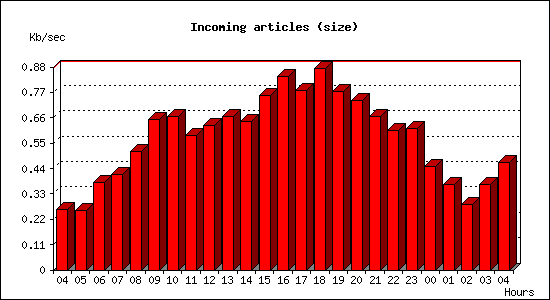
Incoming articles:
| Date | Articles | %Arts | Art/sec | Size | %Size | KB/sec |
|---|---|---|---|---|---|---|
| Feb 5 04:15:02 - 04:59:59 | 227 | 1.3% | 0.08 | 705.5 KB | 1.4% | 0.26 |
| Feb 5 05:00:00 - 05:59:59 | 297 | 1.6% | 0.08 | 928.4 KB | 1.9% | 0.26 |
| Feb 5 06:00:00 - 06:59:59 | 474 | 2.6% | 0.13 | 1.3 MB | 2.8% | 0.38 |
| Feb 5 07:00:00 - 07:59:59 | 534 | 3.0% | 0.15 | 1.5 MB | 3.0% | 0.41 |
| Feb 5 08:00:00 - 08:59:59 | 713 | 4.0% | 0.20 | 1.8 MB | 3.7% | 0.51 |
| Feb 5 09:00:00 - 09:59:59 | 911 | 5.1% | 0.25 | 2.3 MB | 4.7% | 0.65 |
| Feb 5 10:00:00 - 10:59:59 | 890 | 4.9% | 0.25 | 2.3 MB | 4.8% | 0.67 |
| Feb 5 11:00:00 - 11:59:59 | 813 | 4.5% | 0.23 | 2.0 MB | 4.2% | 0.58 |
| Feb 5 12:00:00 - 12:59:59 | 912 | 5.1% | 0.25 | 2.2 MB | 4.5% | 0.63 |
| Feb 5 13:00:00 - 13:59:59 | 1037 | 5.8% | 0.29 | 2.3 MB | 4.8% | 0.66 |
| Feb 5 14:00:00 - 14:59:59 | 919 | 5.1% | 0.26 | 2.3 MB | 4.6% | 0.64 |
| Feb 5 15:00:00 - 15:59:59 | 955 | 5.3% | 0.27 | 2.7 MB | 5.5% | 0.76 |
| Feb 5 16:00:00 - 16:59:59 | 1144 | 6.4% | 0.32 | 2.9 MB | 6.1% | 0.84 |
| Feb 5 17:00:00 - 17:59:59 | 1080 | 6.0% | 0.30 | 2.7 MB | 5.6% | 0.78 |
| Feb 5 18:00:00 - 18:59:59 | 1095 | 6.1% | 0.30 | 3.1 MB | 6.3% | 0.87 |
| Feb 5 19:00:00 - 19:59:59 | 1044 | 5.8% | 0.29 | 2.7 MB | 5.6% | 0.77 |
| Feb 5 20:00:00 - 20:59:59 | 908 | 5.0% | 0.25 | 2.6 MB | 5.3% | 0.73 |
| Feb 5 21:00:00 - 21:59:59 | 825 | 4.6% | 0.23 | 2.3 MB | 4.8% | 0.67 |
| Feb 5 22:00:00 - 22:59:59 | 747 | 4.1% | 0.21 | 2.1 MB | 4.4% | 0.61 |
| Feb 5 23:00:00 - 23:59:59 | 625 | 3.5% | 0.17 | 2.2 MB | 4.4% | 0.61 |
| Feb 6 00:00:00 - 00:59:59 | 537 | 3.0% | 0.15 | 1.6 MB | 3.2% | 0.45 |
| Feb 6 01:00:00 - 01:59:59 | 457 | 2.5% | 0.13 | 1.3 MB | 2.7% | 0.37 |
| Feb 6 02:00:00 - 02:59:59 | 316 | 1.8% | 0.09 | 1020.4 KB | 2.0% | 0.28 |
| Feb 6 03:00:00 - 03:59:59 | 440 | 2.4% | 0.12 | 1.3 MB | 2.7% | 0.37 |
| Feb 6 04:00:00 - 04:15:01 | 113 | 0.6% | 0.13 | 421.3 KB | 0.8% | 0.47 |
| TOTAL: 23:59:59 | 18013 | 100.0% | 0.21 | 48.6 MB | 100.0% | 0.58 |
Sites sending bad articles:
| Server | Total | Group | Dist | Duplic | Unapp | TooOld | Site | Line | Other | |
|---|---|---|---|---|---|---|---|---|---|---|
| 1 | i2pn | 564 | 7 | 0 | 1 | 0 | 0 | 0 | 0 | 556 |
| 2 | novabbs | 9 | 5 | 0 | 0 | 0 | 0 | 0 | 0 | 4 |
| TOTAL: 2 | 573 | 12 | 0 | 1 | 0 | 0 | 0 | 0 | 560 | |
Unwanted newsgroups [Top 20]:
| Newsgroup | Count |
|---|---|
| alt.2600 | 5 |
| rocksolid.feeds.i2p.planet | 5 |
| alt.fr.outil.thunderbird | 2 |
| TOTAL: 3 | 12 |
INND Perl filter [Top 20]:
| Reason | Count |
|---|---|
| Scoring filter (s5) | 106 |
| Scoring filter (s7) | 16 |
| Scoring filter (s6) | 8 |
| EMP (md5) | 4 |
| TOTAL: 4 | 134 |
Miscellaneous innd statistics [Top 10]:
| Event | Server | Number |
|---|---|---|
| Including strange strings | ||
| i2pn | 426 | |
| TOTAL: 1 | 426 | |
| TOTAL: 1 | 426 | |
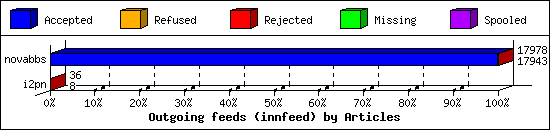
Outgoing Feeds (innfeed) by Articles:
| Server | Offered | Taken | Refused | Reject | Miss | Spool | %Took | Elapsed | |
|---|---|---|---|---|---|---|---|---|---|
| 1 | novabbs | 17988 | 17943 | 8 | 27 | 0 | 0 | 99% | 23:59:54 |
| 2 | i2pn | 37 | 8 | 27 | 1 | 0 | 0 | 21% | 03:13:21 |
| TOTAL: 2 | 18025 | 17951 | 35 | 28 | 0 | 0 | 99% | 27:13:15 | |
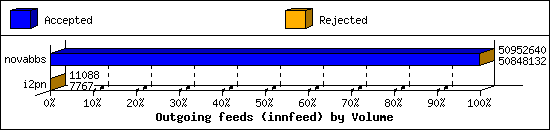
Outgoing Feeds (innfeed) by Volume:
| Server | AcceptVol | RejectVol | TotalVol | Volume/sec | Vol/Art | Elapsed | |
|---|---|---|---|---|---|---|---|
| 1 | novabbs | 48.5 MB | 102.1 KB | 48.6 MB | 0.6 KB/s | 2.8 KB | 23:59:54 |
| 2 | i2pn | 7.6 KB | 3.2 KB | 10.8 KB | 0.0 KB/s | 1.2 KB | 03:13:21 |
| TOTAL: 2 | 48.5 MB | 105.3 KB | 48.6 MB | 0.5 KB/s | 2.8 KB | 27:13:15 | |
NNRP readership statistics:
| System | Conn | Arts | Size | Groups | Post | Rej | Elapsed | |
|---|---|---|---|---|---|---|---|---|
| 1 | 122.228.19.80 | 1 | 0 | 0.0 KB | 0 | 0 | 0 | 00:00:01 |
| TOTAL: 1 | 1 | 0 | 0.0 KB | 0 | 0 | 0 | 00:00:01 | |
NNRP readership statistics (by domain):
| System | Conn | Arts | Size | Groups | Post | Rej | Elapsed | |
|---|---|---|---|---|---|---|---|---|
| 1 | unresolved | 1 | 0 | 0.0 KB | 0 | 0 | 0 | 00:00:01 |
| TOTAL: 1 | 1 | 0 | 0.0 KB | 0 | 0 | 0 | 00:00:01 | |
NNRP total resource statistics [Top 20]:
| System | User(ms) | System(ms) | Idle(ms) | Elapsed |
|---|---|---|---|---|
| 122.228.19.80 | 0.052 | 0.012 | 0.000 | 00:00:01 |
| TOTAL: 1 | 0.052 | 0.012 | 0.000 | 00:00:01 |
NNRP unrecognized commands (by host):
| System | Conn |
|---|---|
| 122.228.19.80 | 5 |
| TOTAL: 1 | 5 |
NNRP unrecognized commands (by command):
| Command | Count |
|---|---|
| GET / HTTP/1.1 | 1 |
| Host: 157.230.63.40:119 | 1 |
| Accept: */* | 1 |
| User-Agent: Mozilla/5.0 (Macintosh; Inte... | 1 |
| Connection: keep-alive | 1 |
| TOTAL: 5 | 5 |
NNRP client timeouts [Top 20]:
| System | Conn | Peer |
|---|---|---|
| 122.228.19.80 | 1 | 1 |
| TOTAL: 1 | 1 | 1 |
