Log entries by program:
| Program name | Lines | %Lines | Size | %Size |
|---|---|---|---|---|
| inn | 17696 | 89.3% | 1.5 MB | 84.0% |
| innd | 1248 | 6.3% | 179.1 KB | 10.0% |
| innfeed | 855 | 4.3% | 105.2 KB | 5.9% |
| controlchan | 11 | 0.1% | 2.3 KB | 0.1% |
| nnrpd | 4 | 0.0% | 0.4 KB | 0.0% |
| TOTAL: 5 | 19814 | 100.0% | 1.7 MB | 100.0% |
History cache:
| Reason | Count | %Count |
|---|---|---|
| Do not exist | 17033 | 97.5% |
| Negative hits | 370 | 2.1% |
| Positive hits | 49 | 0.3% |
| Cache misses | 14 | 0.1% |
| TOTAL: 4 | 17466 | 100.0% |
INND timer:
| Code region | Time | Pct | Invoked | Min(ms) | Avg(ms) | Max(ms) |
|---|---|---|---|---|---|---|
| article cancel | 00:00:00.010 | 0.0% | 68 | 0.000 | 0.147 | 1.000 |
| article cleanup | 00:00:00.102 | 0.0% | 17045 | 0.000 | 0.006 | 0.037 |
| article logging | 00:00:00.546 | 0.0% | 17633 | 0.000 | 0.031 | 0.083 |
| article parse | 00:00:00.253 | 0.0% | 18890 | 0.000 | 0.013 | 0.050 |
| article write | 00:00:02.882 | 0.0% | 16845 | 0.062 | 0.171 | 0.959 |
| artlog/artcncl | 00:00:00.000 | 0.0% | 68 | 0.000 | 0.000 | 0.000 |
| data move | 00:00:00.014 | 0.0% | 21280 | 0.000 | 0.001 | 0.013 |
| hisgrep/artcncl | 00:00:00.000 | 0.0% | 45 | 0.000 | 0.000 | 0.000 |
| hishave/artcncl | 00:00:00.000 | 0.0% | 68 | 0.000 | 0.000 | 0.000 |
| history grep | 00:00:00.000 | 0.0% | 0 | 0.000 | 0.000 | 0.000 |
| history lookup | 00:00:00.094 | 0.0% | 17431 | 0.000 | 0.005 | 0.032 |
| history sync | 00:00:00.045 | 0.0% | 316 | 0.000 | 0.142 | 17.000 |
| history write | 00:00:00.768 | 0.0% | 17035 | 0.000 | 0.045 | 1.049 |
| hiswrite/artcncl | 00:00:00.001 | 0.0% | 23 | 0.000 | 0.043 | 0.200 |
| idle | 24:00:02.834 | 100.0% | 19625 | 2281.114 | 4402.692 | 13335.889 |
| nntp read | 00:00:00.535 | 0.0% | 19363 | 0.000 | 0.028 | 0.066 |
| overview write | 00:00:01.352 | 0.0% | 16845 | 0.019 | 0.080 | 0.327 |
| perl filter | 00:00:12.295 | 0.0% | 17035 | 0.592 | 0.722 | 0.918 |
| python filter | 00:00:00.000 | 0.0% | 0 | 0.000 | 0.000 | 0.000 |
| site send | 00:00:00.636 | 0.0% | 16846 | 0.000 | 0.038 | 0.103 |
| TOTAL: 24:00:25.490 | 24:00:22.367 | 100.0% | - | - | - | - |
INNfeed timer:
| Code region | Time | Pct | Invoked | Min(ms) | Avg(ms) | Max(ms) |
|---|---|---|---|---|---|---|
| article new | 00:00:00.040 | 0.0% | 16839 | 0.000 | 0.002 | 0.033 |
| article prepare | 00:00:00.008 | 0.0% | 67204 | 0.000 | 0.000 | 0.005 |
| article read | 00:00:00.693 | 0.0% | 16801 | 0.000 | 0.041 | 0.253 |
| backlog stats | 00:00:00.016 | 0.0% | 56024 | 0.000 | 0.000 | 0.005 |
| callbacks | 00:00:00.000 | 0.0% | 0 | 0.000 | 0.000 | 0.000 |
| data read | 00:00:00.284 | 0.0% | 34198 | 0.000 | 0.008 | 0.033 |
| data write | 00:00:00.470 | 0.0% | 17388 | 0.000 | 0.027 | 0.067 |
| idle | 23:59:29.574 | 100.0% | 56024 | 856.572 | 1541.653 | 3866.057 |
| status file | 00:00:00.148 | 0.0% | 256 | 0.000 | 0.578 | 2.250 |
| TOTAL: 23:59:32.180 | 23:59:31.233 | 100.0% | - | - | - | - |
nnrpd timer:
| Code region | Time | Pct | Invoked | Min(ms) | Avg(ms) | Max(ms) |
|---|---|---|---|---|---|---|
| idle | 00:00:09.758 | 98.4% | 1 | 9758.000 | 9758.000 | 9758.000 |
| newnews | 00:00:00.000 | 0.0% | 0 | 0.000 | 0.000 | 0.000 |
| nntpwrite | 00:00:00.000 | 0.0% | 2 | 0.000 | 0.000 | 0.000 |
| TOTAL: 00:00:09.920 | 00:00:09.758 | 98.4% | - | - | - | - |
Control commands to INND:
| Command | Number |
|---|---|
| L | 1 |
| flush | 2 |
| flushlogs | 2 |
| go | 2 |
| logmode | 2 |
| mode | 149 |
| name | 2 |
| pause | 2 |
| paused | 2 |
| reload | 2 |
| reserve | 2 |
| TOTAL: 11 | 168 |
Control Channel:
| Sender | newgroup | rmgroup | Other | Bad PGP | DoIt | OK |
|---|---|---|---|---|---|---|
| usenet@novabbs.com | 0 | 0 | 1 | 0 | 0 | 1 |
| TOTAL | 0 | 0 | 1 | 0 | 0 | 1 |
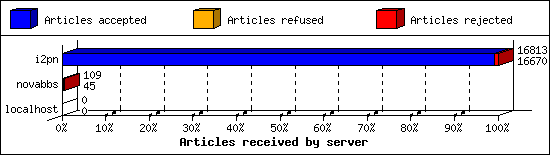
Incoming Feeds (INN):
| Server | Connects | Offered | Taken | Refused | Reject | %Accpt | Elapsed | |
|---|---|---|---|---|---|---|---|---|
| 1 | i2pn | 8 | 16813 | 16670 | 1 | 142 | 99% | 24:28:03 |
| 2 | novabbs | 32 | 109 | 45 | 7 | 57 | 41% | 06:44:02 |
| 3 | localhost | 25 | 0 | 0 | 0 | 0 | 0% | 00:00:00 |
| TOTAL: 3 | 65 | 16922 | 16715 | 8 | 199 | 98% | 31:12:05 | |
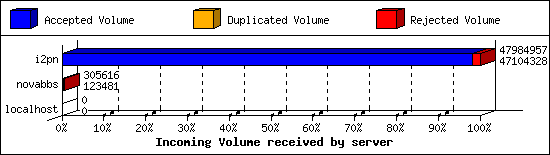
Incoming Volume (INN):
| Server | AcceptVol | DupVol | RejVol | TotalVol | %Acc | Vol/Art | |
|---|---|---|---|---|---|---|---|
| 1 | i2pn | 44.9 MB | 31.0 KB | 829.0 KB | 45.8 MB | 98% | 2.8 KB |
| 2 | novabbs | 120.6 KB | 0.0 KB | 177.9 KB | 298.5 KB | 40% | 2.9 KB |
| 3 | localhost | 0.0 KB | 0.0 KB | 0.0 KB | 0.0 KB | 0% | 0 |
| TOTAL: 3 | 45.0 MB | 31.0 KB | 1006.8 KB | 46.1 MB | 97% | 2.8 KB | |
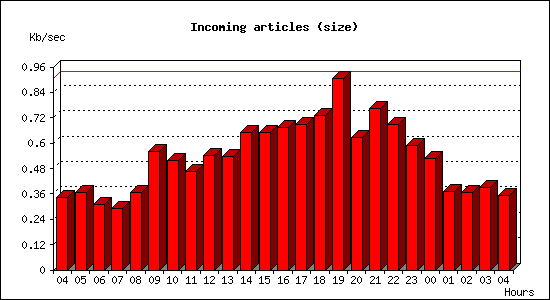
Incoming articles:
| Date | Articles | %Arts | Art/sec | Size | %Size | KB/sec |
|---|---|---|---|---|---|---|
| Feb 10 04:15:01 - 04:59:59 | 291 | 1.7% | 0.11 | 920.9 KB | 2.0% | 0.34 |
| Feb 10 05:00:00 - 05:59:59 | 392 | 2.3% | 0.11 | 1.3 MB | 2.9% | 0.37 |
| Feb 10 06:00:00 - 06:59:59 | 341 | 2.0% | 0.09 | 1.1 MB | 2.4% | 0.31 |
| Feb 10 07:00:00 - 07:59:59 | 396 | 2.4% | 0.11 | 1.0 MB | 2.3% | 0.29 |
| Feb 10 08:00:00 - 08:59:59 | 558 | 3.3% | 0.15 | 1.3 MB | 2.8% | 0.37 |
| Feb 10 09:00:00 - 09:59:59 | 741 | 4.4% | 0.21 | 2.0 MB | 4.3% | 0.56 |
| Feb 10 10:00:00 - 10:59:59 | 835 | 5.0% | 0.23 | 1.8 MB | 4.0% | 0.52 |
| Feb 10 11:00:00 - 11:59:59 | 757 | 4.5% | 0.21 | 1.6 MB | 3.6% | 0.47 |
| Feb 10 12:00:00 - 12:59:59 | 793 | 4.7% | 0.22 | 1.9 MB | 4.2% | 0.54 |
| Feb 10 13:00:00 - 13:59:59 | 766 | 4.5% | 0.21 | 1.9 MB | 4.2% | 0.54 |
| Feb 10 14:00:00 - 14:59:59 | 874 | 5.2% | 0.24 | 2.3 MB | 5.0% | 0.65 |
| Feb 10 15:00:00 - 15:59:59 | 870 | 5.2% | 0.24 | 2.3 MB | 5.0% | 0.65 |
| Feb 10 16:00:00 - 16:59:59 | 975 | 5.8% | 0.27 | 2.4 MB | 5.2% | 0.67 |
| Feb 10 17:00:00 - 17:59:59 | 952 | 5.7% | 0.26 | 2.4 MB | 5.3% | 0.69 |
| Feb 10 18:00:00 - 18:59:59 | 910 | 5.4% | 0.25 | 2.6 MB | 5.7% | 0.73 |
| Feb 10 19:00:00 - 19:59:59 | 1096 | 6.5% | 0.30 | 3.2 MB | 7.0% | 0.91 |
| Feb 10 20:00:00 - 20:59:59 | 845 | 5.0% | 0.23 | 2.2 MB | 4.8% | 0.63 |
| Feb 10 21:00:00 - 21:59:59 | 918 | 5.5% | 0.26 | 2.7 MB | 5.9% | 0.76 |
| Feb 10 22:00:00 - 22:59:59 | 834 | 5.0% | 0.23 | 2.4 MB | 5.3% | 0.69 |
| Feb 10 23:00:00 - 23:59:59 | 787 | 4.7% | 0.22 | 2.1 MB | 4.6% | 0.59 |
| Feb 11 00:00:00 - 00:59:59 | 579 | 3.4% | 0.16 | 1.9 MB | 4.1% | 0.53 |
| Feb 11 01:00:00 - 01:59:59 | 445 | 2.6% | 0.12 | 1.3 MB | 2.9% | 0.37 |
| Feb 11 02:00:00 - 02:59:59 | 383 | 2.3% | 0.11 | 1.3 MB | 2.8% | 0.36 |
| Feb 11 03:00:00 - 03:59:59 | 400 | 2.4% | 0.11 | 1.4 MB | 3.0% | 0.39 |
| Feb 11 04:00:00 - 04:15:01 | 103 | 0.6% | 0.11 | 318.7 KB | 0.7% | 0.35 |
| TOTAL: 24:00:00 | 16841 | 100.0% | 0.19 | 45.4 MB | 100.0% | 0.54 |

Sites sending bad articles:
| Server | Total | Group | Dist | Duplic | Unapp | TooOld | Site | Line | Other | |
|---|---|---|---|---|---|---|---|---|---|---|
| 1 | i2pn | 730 | 2 | 0 | 10 | 0 | 0 | 0 | 0 | 718 |
| 2 | novabbs | 57 | 57 | 0 | 0 | 0 | 0 | 0 | 0 | 0 |
| TOTAL: 2 | 787 | 59 | 0 | 10 | 0 | 0 | 0 | 0 | 718 | |
Unwanted newsgroups [Top 20]:
| Newsgroup | Count |
|---|---|
| rocksolid.feeds.i2p.planet | 50 |
| rocksolid.feeds.indymedia.argentina | 5 |
| rocksolid.feeds.indymedia.barcelona | 1 |
| alt.politics.scorched-earth | 1 |
| rocksolid.feeds.i2p.zzz | 1 |
| alt.2600 | 1 |
| TOTAL: 6 | 59 |
INND Perl filter [Top 20]:
| Reason | Count |
|---|---|
| Scoring filter (s5) | 80 |
| Scoring filter (s6) | 34 |
| Scoring filter (s7) | 16 |
| Scoring filter (n6) | 1 |
| TOTAL: 4 | 131 |
Miscellaneous innd statistics [Top 10]:
| Event | Server | Number |
|---|---|---|
| Including strange strings | ||
| i2pn | 587 | |
| TOTAL: 1 | 587 | |
| TOTAL: 1 | 587 | |
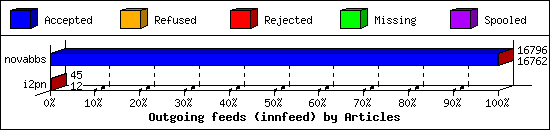
Outgoing Feeds (innfeed) by Articles:
| Server | Offered | Taken | Refused | Reject | Miss | Spool | %Took | Elapsed | |
|---|---|---|---|---|---|---|---|---|---|
| 1 | novabbs | 16805 | 16762 | 7 | 27 | 0 | 0 | 99% | 23:59:46 |
| 2 | i2pn | 50 | 12 | 31 | 2 | 0 | 0 | 24% | 05:18:42 |
| TOTAL: 2 | 16855 | 16774 | 38 | 29 | 0 | 0 | 99% | 29:18:28 | |
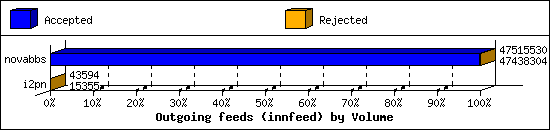
Outgoing Feeds (innfeed) by Volume:
| Server | AcceptVol | RejectVol | TotalVol | Volume/sec | Vol/Art | Elapsed | |
|---|---|---|---|---|---|---|---|
| 1 | novabbs | 45.2 MB | 75.4 KB | 45.3 MB | 0.5 KB/s | 2.8 KB | 23:59:46 |
| 2 | i2pn | 15.0 KB | 27.6 KB | 42.6 KB | 0.0 KB/s | 3.0 KB | 05:18:42 |
| TOTAL: 2 | 45.3 MB | 103.0 KB | 45.4 MB | 0.4 KB/s | 2.8 KB | 29:18:28 | |
NNRP readership statistics:
| System | Conn | Arts | Size | Groups | Post | Rej | Elapsed | |
|---|---|---|---|---|---|---|---|---|
| 1 | 104.131.145.123 | 1 | 0 | 0.0 KB | 0 | 0 | 0 | 00:00:09 |
| TOTAL: 1 | 1 | 0 | 0.0 KB | 0 | 0 | 0 | 00:00:09 | |
NNRP readership statistics (by domain):
| System | Conn | Arts | Size | Groups | Post | Rej | Elapsed | |
|---|---|---|---|---|---|---|---|---|
| 1 | unresolved | 1 | 0 | 0.0 KB | 0 | 0 | 0 | 00:00:09 |
| TOTAL: 1 | 1 | 0 | 0.0 KB | 0 | 0 | 0 | 00:00:09 | |
NNRP total resource statistics [Top 20]:
| System | User(ms) | System(ms) | Idle(ms) | Elapsed |
|---|---|---|---|---|
| 104.131.145.123 | 0.044 | 0.012 | 0.000 | 00:00:09 |
| TOTAL: 1 | 0.044 | 0.012 | 0.000 | 00:00:09 |
