Log entries by program:
| Program name | Lines | %Lines | Size | %Size |
|---|---|---|---|---|
| inn | 19637 | 90.3% | 1.6 MB | 85.2% |
| innd | 1299 | 6.0% | 187.4 KB | 9.7% |
| innfeed | 804 | 3.7% | 98.4 KB | 5.1% |
| nnrpd | 7 | 0.0% | 0.7 KB | 0.0% |
| controlchan | 1 | 0.0% | 0.0 KB | 0.0% |
| TOTAL: 5 | 21748 | 100.0% | 1.9 MB | 100.0% |
History cache:
| Reason | Count | %Count |
|---|---|---|
| Do not exist | 18983 | 97.4% |
| Negative hits | 413 | 2.1% |
| Positive hits | 70 | 0.4% |
| Cache misses | 14 | 0.1% |
| TOTAL: 4 | 19480 | 100.0% |
INND timer:
| Code region | Time | Pct | Invoked | Min(ms) | Avg(ms) | Max(ms) |
|---|---|---|---|---|---|---|
| article cancel | 00:00:00.019 | 0.0% | 76 | 0.000 | 0.250 | 1.000 |
| article cleanup | 00:00:00.105 | 0.0% | 19009 | 0.000 | 0.006 | 0.032 |
| article logging | 00:00:00.621 | 0.0% | 19555 | 0.000 | 0.032 | 0.096 |
| article parse | 00:00:00.276 | 0.0% | 21010 | 0.000 | 0.013 | 0.043 |
| article write | 00:00:03.254 | 0.0% | 18722 | 0.054 | 0.174 | 1.563 |
| artlog/artcncl | 00:00:00.000 | 0.0% | 75 | 0.000 | 0.000 | 0.000 |
| data move | 00:00:00.021 | 0.0% | 23496 | 0.000 | 0.001 | 0.015 |
| hisgrep/artcncl | 00:00:00.000 | 0.0% | 61 | 0.000 | 0.000 | 0.000 |
| hishave/artcncl | 00:00:00.001 | 0.0% | 76 | 0.000 | 0.013 | 0.111 |
| history grep | 00:00:00.000 | 0.0% | 0 | 0.000 | 0.000 | 0.000 |
| history lookup | 00:00:00.079 | 0.0% | 19445 | 0.000 | 0.004 | 0.039 |
| history sync | 00:00:00.015 | 0.0% | 308 | 0.000 | 0.049 | 1.000 |
| history write | 00:00:00.740 | 0.0% | 18988 | 0.000 | 0.039 | 0.446 |
| hiswrite/artcncl | 00:00:00.000 | 0.0% | 15 | 0.000 | 0.000 | 0.000 |
| idle | 23:59:59.725 | 100.0% | 21767 | 2112.440 | 3969.299 | 12243.796 |
| nntp read | 00:00:00.558 | 0.0% | 21517 | 0.000 | 0.026 | 0.103 |
| overview write | 00:00:01.836 | 0.0% | 18722 | 0.029 | 0.098 | 0.759 |
| perl filter | 00:00:13.672 | 0.0% | 18988 | 0.560 | 0.720 | 1.105 |
| python filter | 00:00:00.000 | 0.0% | 0 | 0.000 | 0.000 | 0.000 |
| site send | 00:00:00.787 | 0.0% | 18722 | 0.000 | 0.042 | 0.107 |
| TOTAL: 24:00:25.459 | 24:00:21.709 | 100.0% | - | - | - | - |
INNfeed timer:
| Code region | Time | Pct | Invoked | Min(ms) | Avg(ms) | Max(ms) |
|---|---|---|---|---|---|---|
| article new | 00:00:00.027 | 0.0% | 18704 | 0.000 | 0.001 | 0.019 |
| article prepare | 00:00:00.013 | 0.0% | 74628 | 0.000 | 0.000 | 0.004 |
| article read | 00:00:00.759 | 0.0% | 18657 | 0.000 | 0.041 | 0.472 |
| backlog stats | 00:00:00.020 | 0.0% | 60989 | 0.000 | 0.000 | 0.004 |
| callbacks | 00:00:00.000 | 0.0% | 0 | 0.000 | 0.000 | 0.000 |
| data read | 00:00:00.321 | 0.0% | 37620 | 0.000 | 0.009 | 0.031 |
| data write | 00:00:00.495 | 0.0% | 18953 | 0.000 | 0.026 | 0.056 |
| idle | 23:56:58.319 | 100.0% | 60989 | 780.148 | 1413.670 | 3797.667 |
| status file | 00:00:00.107 | 0.0% | 237 | 0.000 | 0.451 | 1.750 |
| TOTAL: 23:57:01.047 | 23:57:00.061 | 100.0% | - | - | - | - |
nnrpd timer:
| Code region | Time | Pct | Invoked | Min(ms) | Avg(ms) | Max(ms) |
|---|---|---|---|---|---|---|
| idle | 00:00:00.159 | 26.4% | 2 | 79.500 | 79.500 | 79.500 |
| newnews | 00:00:00.000 | 0.0% | 0 | 0.000 | 0.000 | 0.000 |
| nntpwrite | 00:00:00.000 | 0.0% | 11 | 0.000 | 0.000 | 0.000 |
| TOTAL: 00:00:00.602 | 00:00:00.159 | 26.4% | - | - | - | - |
Control commands to INND:
| Command | Number |
|---|---|
| L | 1 |
| flush | 2 |
| flushlogs | 2 |
| go | 2 |
| logmode | 2 |
| mode | 149 |
| name | 2 |
| pause | 2 |
| paused | 2 |
| reload | 2 |
| reserve | 2 |
| TOTAL: 11 | 168 |
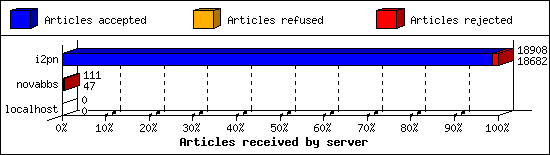
Incoming Feeds (INN):
| Server | Connects | Offered | Taken | Refused | Reject | %Accpt | Elapsed | |
|---|---|---|---|---|---|---|---|---|
| 1 | i2pn | 7 | 18908 | 18682 | 0 | 226 | 98% | 24:41:45 |
| 2 | novabbs | 31 | 111 | 47 | 3 | 61 | 42% | 06:10:04 |
| 3 | localhost | 25 | 0 | 0 | 0 | 0 | 0% | 00:00:00 |
| TOTAL: 3 | 63 | 19019 | 18729 | 3 | 287 | 98% | 30:51:49 | |
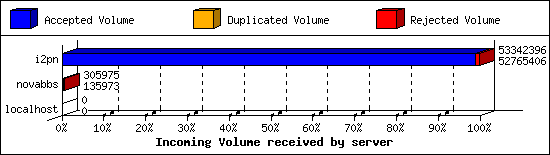
Incoming Volume (INN):
| Server | AcceptVol | DupVol | RejVol | TotalVol | %Acc | Vol/Art | |
|---|---|---|---|---|---|---|---|
| 1 | i2pn | 50.3 MB | 58.8 KB | 504.6 KB | 50.9 MB | 98% | 2.8 KB |
| 2 | novabbs | 132.8 KB | 0.0 KB | 166.0 KB | 298.8 KB | 44% | 2.8 KB |
| 3 | localhost | 0.0 KB | 0.0 KB | 0.0 KB | 0.0 KB | 0% | 0 |
| TOTAL: 3 | 50.5 MB | 58.8 KB | 670.7 KB | 51.2 MB | 98% | 2.8 KB | |
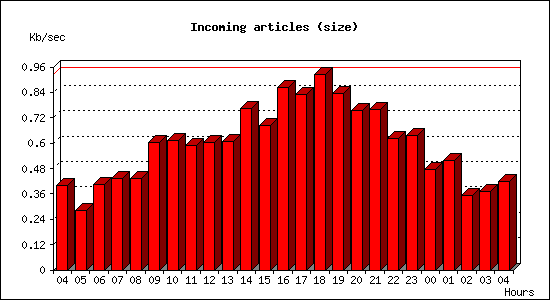
Incoming articles:
| Date | Articles | %Arts | Art/sec | Size | %Size | KB/sec |
|---|---|---|---|---|---|---|
| Feb 12 04:15:01 - 04:59:59 | 257 | 1.4% | 0.10 | 1.0 MB | 2.1% | 0.40 |
| Feb 12 05:00:00 - 05:59:59 | 375 | 2.0% | 0.10 | 1016.0 KB | 2.0% | 0.28 |
| Feb 12 06:00:00 - 06:59:59 | 452 | 2.4% | 0.13 | 1.4 MB | 2.8% | 0.40 |
| Feb 12 07:00:00 - 07:59:59 | 585 | 3.1% | 0.16 | 1.5 MB | 3.0% | 0.43 |
| Feb 12 08:00:00 - 08:59:59 | 634 | 3.4% | 0.18 | 1.5 MB | 3.0% | 0.43 |
| Feb 12 09:00:00 - 09:59:59 | 792 | 4.2% | 0.22 | 2.1 MB | 4.2% | 0.60 |
| Feb 12 10:00:00 - 10:59:59 | 853 | 4.6% | 0.24 | 2.1 MB | 4.3% | 0.61 |
| Feb 12 11:00:00 - 11:59:59 | 898 | 4.8% | 0.25 | 2.1 MB | 4.1% | 0.59 |
| Feb 12 12:00:00 - 12:59:59 | 903 | 4.8% | 0.25 | 2.1 MB | 4.2% | 0.60 |
| Feb 12 13:00:00 - 13:59:59 | 880 | 4.7% | 0.24 | 2.1 MB | 4.2% | 0.61 |
| Feb 12 14:00:00 - 14:59:59 | 1089 | 5.8% | 0.30 | 2.7 MB | 5.3% | 0.76 |
| Feb 12 15:00:00 - 15:59:59 | 941 | 5.0% | 0.26 | 2.4 MB | 4.8% | 0.68 |
| Feb 12 16:00:00 - 16:59:59 | 1159 | 6.2% | 0.32 | 3.0 MB | 6.0% | 0.87 |
| Feb 12 17:00:00 - 17:59:59 | 1110 | 5.9% | 0.31 | 2.9 MB | 5.8% | 0.83 |
| Feb 12 18:00:00 - 18:59:59 | 1185 | 6.3% | 0.33 | 3.3 MB | 6.5% | 0.93 |
| Feb 12 19:00:00 - 19:59:59 | 1082 | 5.8% | 0.30 | 2.9 MB | 5.8% | 0.83 |
| Feb 12 20:00:00 - 20:59:59 | 1012 | 5.4% | 0.28 | 2.6 MB | 5.2% | 0.75 |
| Feb 12 21:00:00 - 21:59:59 | 905 | 4.8% | 0.25 | 2.7 MB | 5.3% | 0.76 |
| Feb 12 22:00:00 - 22:59:59 | 828 | 4.4% | 0.23 | 2.2 MB | 4.3% | 0.62 |
| Feb 12 23:00:00 - 23:59:59 | 709 | 3.8% | 0.20 | 2.2 MB | 4.4% | 0.64 |
| Feb 13 00:00:00 - 00:59:59 | 601 | 3.2% | 0.17 | 1.7 MB | 3.3% | 0.47 |
| Feb 13 01:00:00 - 01:59:59 | 589 | 3.1% | 0.16 | 1.8 MB | 3.6% | 0.52 |
| Feb 13 02:00:00 - 02:59:59 | 394 | 2.1% | 0.11 | 1.2 MB | 2.5% | 0.35 |
| Feb 13 03:00:00 - 03:59:59 | 384 | 2.1% | 0.11 | 1.3 MB | 2.6% | 0.37 |
| Feb 13 04:00:00 - 04:15:01 | 114 | 0.6% | 0.13 | 376.8 KB | 0.7% | 0.42 |
| TOTAL: 24:00:00 | 18731 | 100.0% | 0.22 | 50.4 MB | 100.0% | 0.60 |

Sites sending bad articles:
| Server | Total | Group | Dist | Duplic | Unapp | TooOld | Site | Line | Other | |
|---|---|---|---|---|---|---|---|---|---|---|
| 1 | i2pn | 769 | 17 | 0 | 21 | 0 | 0 | 0 | 0 | 731 |
| 2 | novabbs | 62 | 61 | 0 | 0 | 0 | 0 | 0 | 0 | 1 |
| TOTAL: 2 | 831 | 78 | 0 | 21 | 0 | 0 | 0 | 0 | 732 | |
Unwanted newsgroups [Top 20]:
| Newsgroup | Count |
|---|---|
| rocksolid.feeds.i2p.planet | 40 |
| alt.politics.scorched-earth | 13 |
| rocksolid.feeds.indymedia.argentina | 11 |
| rocksolid.feeds.indymedia.barcelona | 10 |
| alt.2600 | 3 |
| alt.fr.outil.thunderbird | 1 |
| TOTAL: 6 | 78 |
INND Perl filter [Top 20]:
| Reason | Count |
|---|---|
| Scoring filter (s5) | 137 |
| Scoring filter (s6) | 27 |
| Scoring filter (s7) | 16 |
| Scoring filter (n6) | 4 |
| Scoring filter (n4) | 2 |
| TOTAL: 5 | 186 |
Miscellaneous innd statistics [Top 10]:
| Event | Server | Number |
|---|---|---|
| Including strange strings | ||
| i2pn | 545 | |
| novabbs | 1 | |
| TOTAL: 2 | 546 | |
| TOTAL: 1 | 546 | |
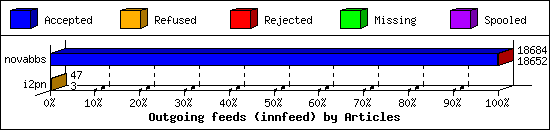
Outgoing Feeds (innfeed) by Articles:
| Server | Offered | Taken | Refused | Reject | Miss | Spool | %Took | Elapsed | |
|---|---|---|---|---|---|---|---|---|---|
| 1 | novabbs | 18688 | 18652 | 3 | 29 | 0 | 0 | 99% | 23:59:58 |
| 2 | i2pn | 54 | 3 | 44 | 0 | 0 | 0 | 5% | 04:41:13 |
| TOTAL: 2 | 18742 | 18655 | 47 | 29 | 0 | 0 | 99% | 28:41:11 | |
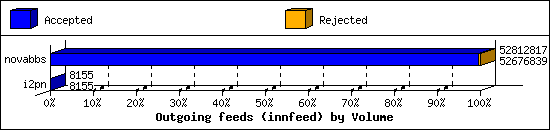
Outgoing Feeds (innfeed) by Volume:
| Server | AcceptVol | RejectVol | TotalVol | Volume/sec | Vol/Art | Elapsed | |
|---|---|---|---|---|---|---|---|
| 1 | novabbs | 50.2 MB | 132.8 KB | 50.4 MB | 0.6 KB/s | 2.8 KB | 23:59:58 |
| 2 | i2pn | 8.0 KB | 0.0 KB | 8.0 KB | 0.0 KB/s | 2.7 KB | 04:41:13 |
| TOTAL: 2 | 50.2 MB | 132.8 KB | 50.4 MB | 0.5 KB/s | 2.8 KB | 28:41:11 | |
NNRP readership statistics:
| System | Conn | Arts | Size | Groups | Post | Rej | Elapsed | |
|---|---|---|---|---|---|---|---|---|
| 1 | scan-141.security.ipip.net | 1 | 0 | 0.0 KB | 0 | 0 | 0 | 00:00:00 |
| TOTAL: 1 | 1 | 0 | 0.0 KB | 0 | 0 | 0 | 00:00:00 | |
NNRP readership statistics (by domain):
| System | Conn | Arts | Size | Groups | Post | Rej | Elapsed | |
|---|---|---|---|---|---|---|---|---|
| 1 | *.security.ipip.net | 1 | 0 | 0.0 KB | 0 | 0 | 0 | 00:00:00 |
| TOTAL: 1 | 1 | 0 | 0.0 KB | 0 | 0 | 0 | 00:00:00 | |
NNRP total resource statistics [Top 20]:
| System | User(ms) | System(ms) | Idle(ms) | Elapsed |
|---|---|---|---|---|
| scan-141.security.ipip.net | 0.052 | 0.008 | 0.000 | 00:00:00 |
| TOTAL: 1 | 0.052 | 0.008 | 0.000 | 00:00:00 |
NNRP unrecognized commands (by host):
| System | Conn |
|---|---|
| scan-141.security.ipip.net | 4 |
| TOTAL: 1 | 4 |
NNRP unrecognized commands (by command):
| Command | Count |
|---|---|
| User-Agent: HTTP Banner Detection (https... | 1 |
| Connection: close | 1 |
| GET / HTTP/1.1 | 1 |
| Host: 157.230.63.40:119 | 1 |
| TOTAL: 4 | 4 |
