Log entries by program:
| Program name | Lines | %Lines | Size | %Size |
|---|---|---|---|---|
| inn | 17098 | 89.6% | 1.4 MB | 84.4% |
| innd | 1202 | 6.3% | 172.2 KB | 10.1% |
| innfeed | 766 | 4.0% | 93.7 KB | 5.5% |
| nnrpd | 14 | 0.1% | 1.4 KB | 0.1% |
| controlchan | 1 | 0.0% | 0.1 KB | 0.0% |
| TOTAL: 5 | 19081 | 100.0% | 1.7 MB | 100.0% |
History cache:
| Reason | Count | %Count |
|---|---|---|
| Do not exist | 16611 | 98.2% |
| Negative hits | 236 | 1.4% |
| Positive hits | 54 | 0.3% |
| Cache misses | 23 | 0.1% |
| TOTAL: 4 | 16924 | 100.0% |
INND timer:
| Code region | Time | Pct | Invoked | Min(ms) | Avg(ms) | Max(ms) |
|---|---|---|---|---|---|---|
| article cancel | 00:00:00.070 | 0.0% | 85 | 0.000 | 0.824 | 45.000 |
| article cleanup | 00:00:00.095 | 0.0% | 16647 | 0.000 | 0.006 | 0.029 |
| article logging | 00:00:00.516 | 0.0% | 17028 | 0.000 | 0.030 | 0.083 |
| article parse | 00:00:00.236 | 0.0% | 18437 | 0.000 | 0.013 | 0.041 |
| article write | 00:00:02.835 | 0.0% | 16480 | 0.066 | 0.172 | 0.307 |
| artlog/artcncl | 00:00:00.001 | 0.0% | 85 | 0.000 | 0.012 | 0.200 |
| data move | 00:00:00.007 | 0.0% | 20553 | 0.000 | 0.000 | 0.010 |
| hisgrep/artcncl | 00:00:00.000 | 0.0% | 76 | 0.000 | 0.000 | 0.000 |
| hishave/artcncl | 00:00:00.000 | 0.0% | 85 | 0.000 | 0.000 | 0.000 |
| history grep | 00:00:00.000 | 0.0% | 0 | 0.000 | 0.000 | 0.000 |
| history lookup | 00:00:00.077 | 0.0% | 16930 | 0.000 | 0.005 | 0.032 |
| history sync | 00:00:00.019 | 0.0% | 319 | 0.000 | 0.060 | 1.000 |
| history write | 00:00:00.643 | 0.0% | 16647 | 0.000 | 0.039 | 0.911 |
| hiswrite/artcncl | 00:00:00.000 | 0.0% | 9 | 0.000 | 0.000 | 0.000 |
| idle | 24:00:04.965 | 100.0% | 19026 | 1764.553 | 4541.415 | 13336.444 |
| nntp read | 00:00:00.552 | 0.0% | 18771 | 0.000 | 0.029 | 0.068 |
| overview write | 00:00:01.549 | 0.0% | 16480 | 0.000 | 0.094 | 0.672 |
| perl filter | 00:00:11.465 | 0.0% | 16647 | 0.571 | 0.689 | 0.908 |
| python filter | 00:00:00.000 | 0.0% | 0 | 0.000 | 0.000 | 0.000 |
| site send | 00:00:00.508 | 0.0% | 16480 | 0.000 | 0.031 | 0.110 |
| TOTAL: 24:00:27.053 | 24:00:23.538 | 100.0% | - | - | - | - |
INNfeed timer:
| Code region | Time | Pct | Invoked | Min(ms) | Avg(ms) | Max(ms) |
|---|---|---|---|---|---|---|
| article new | 00:00:00.031 | 0.0% | 16461 | 0.000 | 0.002 | 0.024 |
| article prepare | 00:00:00.011 | 0.0% | 65804 | 0.000 | 0.000 | 0.003 |
| article read | 00:00:00.710 | 0.0% | 16451 | 0.000 | 0.043 | 0.485 |
| backlog stats | 00:00:00.018 | 0.0% | 54556 | 0.000 | 0.000 | 0.006 |
| callbacks | 00:00:00.000 | 0.0% | 0 | 0.000 | 0.000 | 0.000 |
| data read | 00:00:00.267 | 0.0% | 33306 | 0.000 | 0.008 | 0.043 |
| data write | 00:00:00.501 | 0.0% | 16869 | 0.000 | 0.030 | 0.095 |
| idle | 23:58:47.888 | 100.0% | 54556 | 821.539 | 1582.372 | 4838.692 |
| status file | 00:00:00.110 | 0.0% | 225 | 0.000 | 0.489 | 2.500 |
| TOTAL: 23:58:50.396 | 23:58:49.536 | 100.0% | - | - | - | - |
nnrpd timer:
| Code region | Time | Pct | Invoked | Min(ms) | Avg(ms) | Max(ms) |
|---|---|---|---|---|---|---|
| idle | 00:00:11.397 | 83.8% | 4 | 71.500 | 2849.250 | 9679.000 |
| newnews | 00:00:00.000 | 0.0% | 0 | 0.000 | 0.000 | 0.000 |
| nntpwrite | 00:00:00.000 | 0.0% | 15 | 0.000 | 0.000 | 0.000 |
| TOTAL: 00:00:13.603 | 00:00:11.397 | 83.8% | - | - | - | - |
Control commands to INND:
| Command | Number |
|---|---|
| L | 1 |
| flush | 2 |
| flushlogs | 2 |
| go | 2 |
| logmode | 2 |
| mode | 149 |
| name | 2 |
| pause | 2 |
| paused | 2 |
| reload | 2 |
| reserve | 2 |
| TOTAL: 11 | 168 |
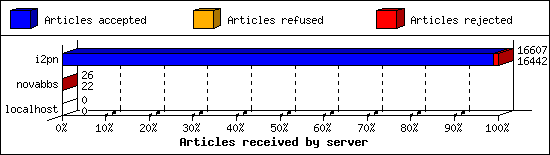
Incoming Feeds (INN):
| Server | Connects | Offered | Taken | Refused | Reject | %Accpt | Elapsed | |
|---|---|---|---|---|---|---|---|---|
| 1 | i2pn | 7 | 16607 | 16442 | 0 | 165 | 99% | 24:46:27 |
| 2 | novabbs | 21 | 26 | 22 | 2 | 2 | 84% | 03:48:44 |
| 3 | localhost | 25 | 0 | 0 | 0 | 0 | 0% | 00:00:00 |
| TOTAL: 3 | 53 | 16633 | 16464 | 2 | 167 | 98% | 28:35:11 | |
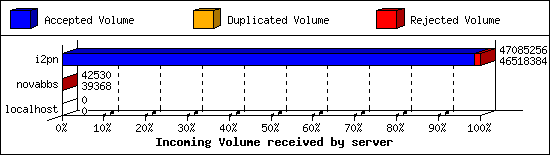
Incoming Volume (INN):
| Server | AcceptVol | DupVol | RejVol | TotalVol | %Acc | Vol/Art | |
|---|---|---|---|---|---|---|---|
| 1 | i2pn | 44.4 MB | 0.0 KB | 553.6 KB | 44.9 MB | 98% | 2.8 KB |
| 2 | novabbs | 38.4 KB | 0.0 KB | 3.1 KB | 41.5 KB | 92% | 1.7 KB |
| 3 | localhost | 0.0 KB | 0.0 KB | 0.0 KB | 0.0 KB | 0% | 0 |
| TOTAL: 3 | 44.4 MB | 0.0 KB | 556.7 KB | 44.9 MB | 98% | 2.8 KB | |
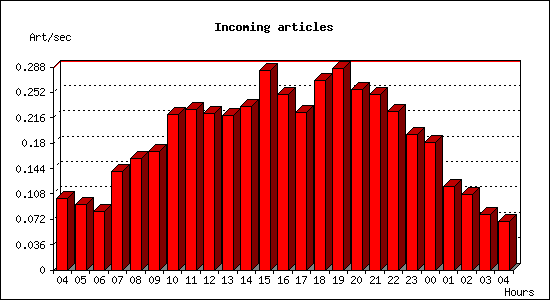
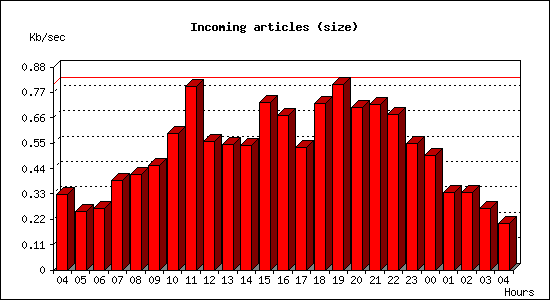
Incoming articles:
| Date | Articles | %Arts | Art/sec | Size | %Size | KB/sec |
|---|---|---|---|---|---|---|
| Feb 16 04:15:01 - 04:59:59 | 274 | 1.7% | 0.10 | 880.2 KB | 1.9% | 0.33 |
| Feb 16 05:00:00 - 05:59:59 | 333 | 2.0% | 0.09 | 905.3 KB | 2.0% | 0.25 |
| Feb 16 06:00:00 - 06:59:59 | 298 | 1.8% | 0.08 | 959.8 KB | 2.1% | 0.27 |
| Feb 16 07:00:00 - 07:59:59 | 502 | 3.0% | 0.14 | 1.4 MB | 3.1% | 0.39 |
| Feb 16 08:00:00 - 08:59:59 | 569 | 3.5% | 0.16 | 1.5 MB | 3.3% | 0.41 |
| Feb 16 09:00:00 - 09:59:59 | 603 | 3.7% | 0.17 | 1.6 MB | 3.6% | 0.45 |
| Feb 16 10:00:00 - 10:59:59 | 796 | 4.8% | 0.22 | 2.1 MB | 4.7% | 0.59 |
| Feb 16 11:00:00 - 11:59:59 | 820 | 5.0% | 0.23 | 2.8 MB | 6.3% | 0.80 |
| Feb 16 12:00:00 - 12:59:59 | 800 | 4.9% | 0.22 | 2.0 MB | 4.4% | 0.56 |
| Feb 16 13:00:00 - 13:59:59 | 787 | 4.8% | 0.22 | 1.9 MB | 4.3% | 0.55 |
| Feb 16 14:00:00 - 14:59:59 | 833 | 5.1% | 0.23 | 1.9 MB | 4.3% | 0.54 |
| Feb 16 15:00:00 - 15:59:59 | 1018 | 6.2% | 0.28 | 2.5 MB | 5.7% | 0.73 |
| Feb 16 16:00:00 - 16:59:59 | 896 | 5.4% | 0.25 | 2.4 MB | 5.3% | 0.67 |
| Feb 16 17:00:00 - 17:59:59 | 805 | 4.9% | 0.22 | 1.9 MB | 4.2% | 0.53 |
| Feb 16 18:00:00 - 18:59:59 | 969 | 5.9% | 0.27 | 2.5 MB | 5.7% | 0.72 |
| Feb 16 19:00:00 - 19:59:59 | 1031 | 6.3% | 0.29 | 2.8 MB | 6.4% | 0.80 |
| Feb 16 20:00:00 - 20:59:59 | 923 | 5.6% | 0.26 | 2.5 MB | 5.6% | 0.70 |
| Feb 16 21:00:00 - 21:59:59 | 895 | 5.4% | 0.25 | 2.5 MB | 5.7% | 0.72 |
| Feb 16 22:00:00 - 22:59:59 | 809 | 4.9% | 0.22 | 2.4 MB | 5.3% | 0.67 |
| Feb 16 23:00:00 - 23:59:59 | 694 | 4.2% | 0.19 | 1.9 MB | 4.3% | 0.55 |
| Feb 17 00:00:00 - 00:59:59 | 650 | 3.9% | 0.18 | 1.7 MB | 3.9% | 0.50 |
| Feb 17 01:00:00 - 01:59:59 | 429 | 2.6% | 0.12 | 1.2 MB | 2.7% | 0.34 |
| Feb 17 02:00:00 - 02:59:59 | 385 | 2.3% | 0.11 | 1.2 MB | 2.7% | 0.34 |
| Feb 17 03:00:00 - 03:59:59 | 283 | 1.7% | 0.08 | 957.4 KB | 2.1% | 0.27 |
| Feb 17 04:00:00 - 04:15:01 | 62 | 0.4% | 0.07 | 182.1 KB | 0.4% | 0.20 |
| TOTAL: 24:00:00 | 16464 | 100.0% | 0.19 | 44.4 MB | 100.0% | 0.53 |
Sites sending bad articles:
| Server | Total | Group | Dist | Duplic | Unapp | TooOld | Site | Line | Other | |
|---|---|---|---|---|---|---|---|---|---|---|
| 1 | i2pn | 547 | 14 | 0 | 0 | 0 | 0 | 0 | 0 | 533 |
| 2 | novabbs | 2 | 0 | 0 | 0 | 0 | 0 | 0 | 0 | 2 |
| TOTAL: 2 | 549 | 14 | 0 | 0 | 0 | 0 | 0 | 0 | 535 | |
Unwanted newsgroups [Top 20]:
| Newsgroup | Count |
|---|---|
| alt.2600 | 9 |
| alt.politics.scorched-earth | 4 |
| 24hoursupport.helpdesk | 1 |
| TOTAL: 3 | 14 |
INND Perl filter [Top 20]:
| Reason | Count |
|---|---|
| Scoring filter (s5) | 122 |
| Scoring filter (s6) | 28 |
| EMP (md5) | 2 |
| Scoring filter (s1) | 1 |
| TOTAL: 4 | 153 |
Miscellaneous innd statistics [Top 10]:
| Event | Server | Number |
|---|---|---|
| Including strange strings | ||
| i2pn | 382 | |
| TOTAL: 1 | 382 | |
| TOTAL: 1 | 382 | |
Outgoing Feeds (innfeed) by Articles:
| Server | Offered | Taken | Refused | Reject | Miss | Spool | %Took | Elapsed | |
|---|---|---|---|---|---|---|---|---|---|
| 1 | novabbs | 16446 | 16419 | 2 | 21 | 0 | 0 | 99% | 23:59:49 |
| 2 | i2pn | 22 | 14 | 8 | 0 | 0 | 0 | 63% | 02:59:59 |
| TOTAL: 2 | 16468 | 16433 | 10 | 21 | 0 | 0 | 99% | 26:59:48 | |

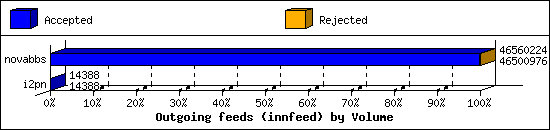
Outgoing Feeds (innfeed) by Volume:
| Server | AcceptVol | RejectVol | TotalVol | Volume/sec | Vol/Art | Elapsed | |
|---|---|---|---|---|---|---|---|
| 1 | novabbs | 44.3 MB | 57.9 KB | 44.4 MB | 0.5 KB/s | 2.8 KB | 23:59:49 |
| 2 | i2pn | 14.1 KB | 0.0 KB | 14.1 KB | 0.0 KB/s | 1.0 KB | 02:59:59 |
| TOTAL: 2 | 44.4 MB | 57.9 KB | 44.4 MB | 0.5 KB/s | 2.8 KB | 26:59:48 | |
NNRP readership statistics:
| System | Conn | Arts | Size | Groups | Post | Rej | Elapsed | |
|---|---|---|---|---|---|---|---|---|
| 1 | min-li-uk-02-11-17500-d-prod.binaryedge.ninja | 1 | 0 | 0.0 KB | 0 | 0 | 0 | 00:00:01 |
| 2 | 104.131.130.157 | 1 | 0 | 0.0 KB | 0 | 0 | 0 | 00:00:09 |
| 3 | scan-141.security.ipip.net | 1 | 0 | 0.0 KB | 0 | 0 | 0 | 00:00:01 |
| TOTAL: 3 | 3 | 0 | 0.0 KB | 0 | 0 | 0 | 00:00:13 | |
NNRP readership statistics (by domain):
| System | Conn | Arts | Size | Groups | Post | Rej | Elapsed | |
|---|---|---|---|---|---|---|---|---|
| 1 | *.security.ipip.net | 1 | 0 | 0.0 KB | 0 | 0 | 0 | 00:00:01 |
| 2 | *.binaryedge.ninja | 1 | 0 | 0.0 KB | 0 | 0 | 0 | 00:00:01 |
| 3 | unresolved | 1 | 0 | 0.0 KB | 0 | 0 | 0 | 00:00:09 |
| TOTAL: 3 | 3 | 0 | 0.0 KB | 0 | 0 | 0 | 00:00:13 | |
NNRP total resource statistics [Top 20]:
| System | User(ms) | System(ms) | Idle(ms) | Elapsed |
|---|---|---|---|---|
| 104.131.130.157 | 0.056 | 0.000 | 0.000 | 00:00:09 |
| scan-141.security.ipip.net | 0.056 | 0.008 | 0.000 | 00:00:01 |
| min-li-uk-02-11-17500-d-prod.binaryedge.ninja | 0.044 | 0.008 | 0.000 | 00:00:01 |
| TOTAL: 3 | 0.156 | 0.016 | 0.000 | 00:00:13 |
NNRP unrecognized commands (by host):
| System | Conn |
|---|---|
| scan-141.security.ipip.net | 4 |
| TOTAL: 1 | 4 |
NNRP unrecognized commands (by command):
| Command | Count |
|---|---|
| GET / HTTP/1.1 | 1 |
| User-Agent: HTTP Banner Detection (https... | 1 |
| Connection: close | 1 |
| Host: 157.230.63.40:119 | 1 |
| TOTAL: 4 | 4 |
