Log entries by program:
| Program name | Lines | %Lines | Size | %Size |
|---|---|---|---|---|
| inn | 18454 | 91.0% | 1.5 MB | 86.1% |
| innd | 1147 | 5.7% | 178.8 KB | 9.9% |
| innfeed | 678 | 3.3% | 71.6 KB | 4.0% |
| nnrpd | 4 | 0.0% | 0.5 KB | 0.0% |
| controlchan | 1 | 0.0% | 0.1 KB | 0.0% |
| TOTAL: 5 | 20284 | 100.0% | 1.8 MB | 100.0% |
History cache:
| Reason | Count | %Count |
|---|---|---|
| Do not exist | 17837 | 98.1% |
| Negative hits | 248 | 1.4% |
| Positive hits | 72 | 0.4% |
| Cache misses | 21 | 0.1% |
| TOTAL: 4 | 18178 | 100.0% |
INND timer:
| Code region | Time | Pct | Invoked | Min(ms) | Avg(ms) | Max(ms) |
|---|---|---|---|---|---|---|
| article cancel | 00:00:00.029 | 0.0% | 99 | 0.000 | 0.293 | 1.167 |
| article cleanup | 00:00:00.086 | 0.0% | 17868 | 0.000 | 0.005 | 0.026 |
| article logging | 00:00:00.606 | 0.0% | 18356 | 0.000 | 0.033 | 0.096 |
| article parse | 00:00:00.255 | 0.0% | 19500 | 0.000 | 0.013 | 0.053 |
| article write | 00:00:02.936 | 0.0% | 17689 | 0.060 | 0.166 | 0.551 |
| artlog/artcncl | 00:00:00.002 | 0.0% | 98 | 0.000 | 0.020 | 0.500 |
| data move | 00:00:00.009 | 0.0% | 21377 | 0.000 | 0.000 | 0.011 |
| hisgrep/artcncl | 00:00:00.001 | 0.0% | 87 | 0.000 | 0.011 | 0.200 |
| hishave/artcncl | 00:00:00.001 | 0.0% | 99 | 0.000 | 0.010 | 0.200 |
| history grep | 00:00:00.000 | 0.0% | 0 | 0.000 | 0.000 | 0.000 |
| history lookup | 00:00:00.084 | 0.0% | 18158 | 0.000 | 0.005 | 0.027 |
| history sync | 00:00:00.015 | 0.0% | 310 | 0.000 | 0.048 | 0.500 |
| history write | 00:00:00.602 | 0.0% | 17863 | 0.000 | 0.034 | 0.083 |
| hiswrite/artcncl | 00:00:00.000 | 0.0% | 12 | 0.000 | 0.000 | 0.000 |
| idle | 24:00:03.049 | 100.0% | 20045 | 2520.651 | 4310.454 | 12002.360 |
| nntp read | 00:00:00.601 | 0.0% | 19819 | 0.000 | 0.030 | 0.079 |
| overview write | 00:00:01.714 | 0.0% | 17689 | 0.000 | 0.097 | 1.081 |
| perl filter | 00:00:12.089 | 0.0% | 17863 | 0.521 | 0.677 | 0.864 |
| python filter | 00:00:00.000 | 0.0% | 0 | 0.000 | 0.000 | 0.000 |
| site send | 00:00:00.679 | 0.0% | 17689 | 0.000 | 0.038 | 0.107 |
| TOTAL: 24:00:25.985 | 24:00:22.758 | 100.0% | - | - | - | - |
INNfeed timer:
| Code region | Time | Pct | Invoked | Min(ms) | Avg(ms) | Max(ms) |
|---|---|---|---|---|---|---|
| article new | 00:00:00.032 | 0.0% | 17677 | 0.000 | 0.002 | 0.018 |
| article prepare | 00:00:00.009 | 0.0% | 70652 | 0.000 | 0.000 | 0.003 |
| article read | 00:00:00.794 | 0.0% | 17663 | 0.000 | 0.045 | 0.446 |
| backlog stats | 00:00:00.024 | 0.0% | 57722 | 0.000 | 0.000 | 0.006 |
| callbacks | 00:00:00.000 | 0.0% | 0 | 0.000 | 0.000 | 0.000 |
| data read | 00:00:00.305 | 0.0% | 35517 | 0.000 | 0.009 | 0.024 |
| data write | 00:00:00.506 | 0.0% | 17874 | 0.000 | 0.028 | 0.077 |
| idle | 23:58:11.002 | 100.0% | 57722 | 900.190 | 1494.941 | 3449.098 |
| status file | 00:00:00.059 | 0.0% | 186 | 0.000 | 0.317 | 2.000 |
| TOTAL: 23:58:13.653 | 23:58:12.731 | 100.0% | - | - | - | - |
nnrpd timer:
| Code region | Time | Pct | Invoked | Min(ms) | Avg(ms) | Max(ms) |
|---|---|---|---|---|---|---|
| idle | 00:00:09.828 | 99.1% | 1 | 9828.000 | 9828.000 | 9828.000 |
| newnews | 00:00:00.000 | 0.0% | 0 | 0.000 | 0.000 | 0.000 |
| nntpwrite | 00:00:00.000 | 0.0% | 2 | 0.000 | 0.000 | 0.000 |
| TOTAL: 00:00:09.919 | 00:00:09.828 | 99.1% | - | - | - | - |
Control commands to INND:
| Command | Number |
|---|---|
| L | 1 |
| flush | 2 |
| flushlogs | 2 |
| go | 2 |
| logmode | 2 |
| mode | 149 |
| name | 2 |
| pause | 2 |
| paused | 2 |
| reload | 2 |
| reserve | 2 |
| TOTAL: 11 | 168 |
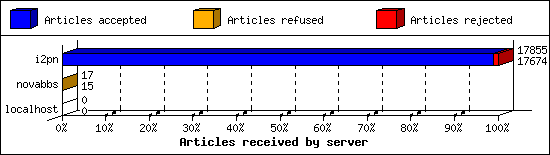
Incoming Feeds (INN):
| Server | Connects | Offered | Taken | Refused | Reject | %Accpt | Elapsed | |
|---|---|---|---|---|---|---|---|---|
| 1 | i2pn | 5 | 17855 | 17674 | 2 | 179 | 98% | 24:32:44 |
| 2 | novabbs | 9 | 17 | 15 | 2 | 0 | 88% | 01:31:49 |
| 3 | localhost | 25 | 0 | 0 | 0 | 0 | 0% | 00:00:00 |
| TOTAL: 3 | 39 | 17872 | 17689 | 4 | 179 | 98% | 26:04:33 | |
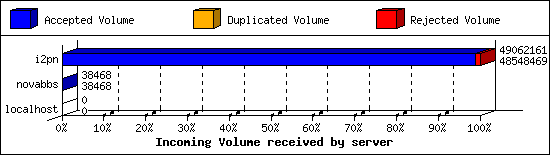
Incoming Volume (INN):
| Server | AcceptVol | DupVol | RejVol | TotalVol | %Acc | Vol/Art | |
|---|---|---|---|---|---|---|---|
| 1 | i2pn | 46.3 MB | 14.8 KB | 486.9 KB | 46.8 MB | 98% | 2.7 KB |
| 2 | novabbs | 37.6 KB | 0.0 KB | 0.0 KB | 37.6 KB | 100% | 2.5 KB |
| 3 | localhost | 0.0 KB | 0.0 KB | 0.0 KB | 0.0 KB | 0% | 0 |
| TOTAL: 3 | 46.3 MB | 14.8 KB | 486.9 KB | 46.8 MB | 98% | 2.7 KB | |
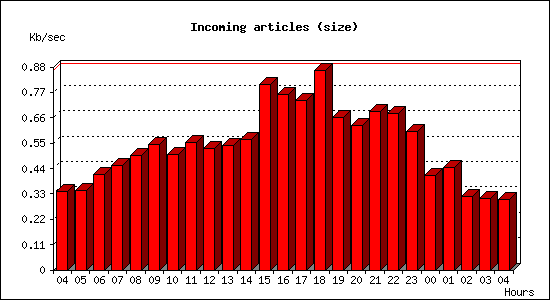
Incoming articles:
| Date | Articles | %Arts | Art/sec | Size | %Size | KB/sec |
|---|---|---|---|---|---|---|
| Feb 19 04:15:02 - 04:59:59 | 293 | 1.7% | 0.11 | 921.5 KB | 1.9% | 0.34 |
| Feb 19 05:00:00 - 05:59:59 | 394 | 2.2% | 0.11 | 1.2 MB | 2.6% | 0.34 |
| Feb 19 06:00:00 - 06:59:59 | 443 | 2.5% | 0.12 | 1.4 MB | 3.1% | 0.41 |
| Feb 19 07:00:00 - 07:59:59 | 607 | 3.4% | 0.17 | 1.6 MB | 3.4% | 0.45 |
| Feb 19 08:00:00 - 08:59:59 | 688 | 3.9% | 0.19 | 1.8 MB | 3.8% | 0.50 |
| Feb 19 09:00:00 - 09:59:59 | 715 | 4.0% | 0.20 | 1.9 MB | 4.1% | 0.54 |
| Feb 19 10:00:00 - 10:59:59 | 760 | 4.3% | 0.21 | 1.8 MB | 3.8% | 0.50 |
| Feb 19 11:00:00 - 11:59:59 | 783 | 4.4% | 0.22 | 1.9 MB | 4.2% | 0.55 |
| Feb 19 12:00:00 - 12:59:59 | 786 | 4.4% | 0.22 | 1.9 MB | 4.0% | 0.53 |
| Feb 19 13:00:00 - 13:59:59 | 803 | 4.5% | 0.22 | 1.9 MB | 4.1% | 0.54 |
| Feb 19 14:00:00 - 14:59:59 | 817 | 4.6% | 0.23 | 2.0 MB | 4.3% | 0.57 |
| Feb 19 15:00:00 - 15:59:59 | 1135 | 6.4% | 0.32 | 2.8 MB | 6.1% | 0.80 |
| Feb 19 16:00:00 - 16:59:59 | 1059 | 6.0% | 0.29 | 2.7 MB | 5.8% | 0.76 |
| Feb 19 17:00:00 - 17:59:59 | 1084 | 6.1% | 0.30 | 2.6 MB | 5.6% | 0.73 |
| Feb 19 18:00:00 - 18:59:59 | 1110 | 6.3% | 0.31 | 3.0 MB | 6.6% | 0.87 |
| Feb 19 19:00:00 - 19:59:59 | 925 | 5.2% | 0.26 | 2.3 MB | 5.0% | 0.66 |
| Feb 19 20:00:00 - 20:59:59 | 872 | 4.9% | 0.24 | 2.2 MB | 4.8% | 0.63 |
| Feb 19 21:00:00 - 21:59:59 | 906 | 5.1% | 0.25 | 2.4 MB | 5.2% | 0.69 |
| Feb 19 22:00:00 - 22:59:59 | 899 | 5.1% | 0.25 | 2.4 MB | 5.1% | 0.68 |
| Feb 19 23:00:00 - 23:59:59 | 716 | 4.0% | 0.20 | 2.1 MB | 4.6% | 0.60 |
| Feb 20 00:00:00 - 00:59:59 | 503 | 2.8% | 0.14 | 1.4 MB | 3.1% | 0.41 |
| Feb 20 01:00:00 - 01:59:59 | 535 | 3.0% | 0.15 | 1.6 MB | 3.4% | 0.44 |
| Feb 20 02:00:00 - 02:59:59 | 385 | 2.2% | 0.11 | 1.1 MB | 2.4% | 0.32 |
| Feb 20 03:00:00 - 03:59:59 | 379 | 2.1% | 0.11 | 1.1 MB | 2.3% | 0.31 |
| Feb 20 04:00:00 - 04:15:01 | 92 | 0.5% | 0.10 | 274.4 KB | 0.6% | 0.30 |
| TOTAL: 23:59:59 | 17689 | 100.0% | 0.20 | 46.3 MB | 100.0% | 0.55 |

Sites sending bad articles:
| Server | Total | Group | Dist | Duplic | Unapp | TooOld | Site | Line | Other | |
|---|---|---|---|---|---|---|---|---|---|---|
| 1 | i2pn | 666 | 13 | 0 | 5 | 0 | 0 | 0 | 0 | 648 |
| 2 | novabbs | 1 | 0 | 0 | 0 | 0 | 0 | 0 | 0 | 1 |
| TOTAL: 2 | 667 | 13 | 0 | 5 | 0 | 0 | 0 | 0 | 649 | |
Unwanted newsgroups [Top 20]:
| Newsgroup | Count |
|---|---|
| alt.politics.scorched-earth | 9 |
| hk.politics | 1 |
| alt.2600 | 1 |
| lada.music | 1 |
| a.bsu.religion | 1 |
| TOTAL: 5 | 13 |
INND Perl filter [Top 20]:
| Reason | Count |
|---|---|
| Scoring filter (s5) | 139 |
| Scoring filter (s6) | 18 |
| Scoring filter (n6) | 4 |
| TOTAL: 3 | 161 |
Miscellaneous innd statistics [Top 10]:
| Event | Server | Number |
|---|---|---|
| Including strange strings | ||
| i2pn | 487 | |
| novabbs | 1 | |
| TOTAL: 2 | 488 | |
| TOTAL: 1 | 488 | |
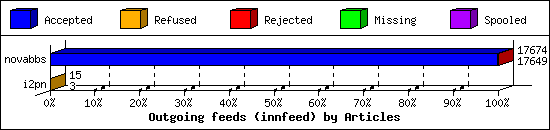
Outgoing Feeds (innfeed) by Articles:
| Server | Offered | Taken | Refused | Reject | Miss | Spool | %Took | Elapsed | |
|---|---|---|---|---|---|---|---|---|---|
| 1 | novabbs | 17677 | 17649 | 2 | 23 | 0 | 0 | 99% | 23:59:57 |
| 2 | i2pn | 19 | 3 | 12 | 0 | 0 | 0 | 15% | 01:21:25 |
| TOTAL: 2 | 17696 | 17652 | 14 | 23 | 0 | 0 | 99% | 25:21:22 | |
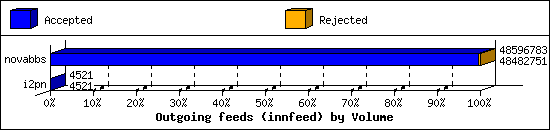
Outgoing Feeds (innfeed) by Volume:
| Server | AcceptVol | RejectVol | TotalVol | Volume/sec | Vol/Art | Elapsed | |
|---|---|---|---|---|---|---|---|
| 1 | novabbs | 46.2 MB | 111.4 KB | 46.3 MB | 0.5 KB/s | 2.7 KB | 23:59:57 |
| 2 | i2pn | 4.4 KB | 0.0 KB | 4.4 KB | 0.0 KB/s | 1.5 KB | 01:21:25 |
| TOTAL: 2 | 46.2 MB | 111.4 KB | 46.3 MB | 0.5 KB/s | 2.7 KB | 25:21:22 | |
NNRP readership statistics:
| System | Conn | Arts | Size | Groups | Post | Rej | Elapsed | |
|---|---|---|---|---|---|---|---|---|
| 1 | 192.241.215.144 | 1 | 0 | 0.0 KB | 0 | 0 | 0 | 00:00:09 |
| TOTAL: 1 | 1 | 0 | 0.0 KB | 0 | 0 | 0 | 00:00:09 | |
NNRP readership statistics (by domain):
| System | Conn | Arts | Size | Groups | Post | Rej | Elapsed | |
|---|---|---|---|---|---|---|---|---|
| 1 | unresolved | 1 | 0 | 0.0 KB | 0 | 0 | 0 | 00:00:09 |
| TOTAL: 1 | 1 | 0 | 0.0 KB | 0 | 0 | 0 | 00:00:09 | |
NNRP total resource statistics [Top 20]:
| System | User(ms) | System(ms) | Idle(ms) | Elapsed |
|---|---|---|---|---|
| 192.241.215.144 | 0.056 | 0.016 | 0.000 | 00:00:09 |
| TOTAL: 1 | 0.056 | 0.016 | 0.000 | 00:00:09 |
