
Log entries by program:
| Program name | Lines | %Lines | Size | %Size |
|---|---|---|---|---|
| inn | 19197 | 90.3% | 1.6 MB | 85.2% |
| innd | 1254 | 5.9% | 181.3 KB | 9.6% |
| innfeed | 803 | 3.8% | 95.3 KB | 5.1% |
| nnrpd | 8 | 0.0% | 0.8 KB | 0.0% |
| controlchan | 2 | 0.0% | 0.1 KB | 0.0% |
| nocem | 2 | 0.0% | 0.1 KB | 0.0% |
| TOTAL: 6 | 21266 | 100.0% | 1.8 MB | 100.0% |
History cache:
| Reason | Count | %Count |
|---|---|---|
| Do not exist | 18579 | 97.9% |
| Negative hits | 329 | 1.7% |
| Positive hits | 40 | 0.2% |
| Cache misses | 25 | 0.1% |
| TOTAL: 4 | 18973 | 100.0% |
INND timer:
| Code region | Time | Pct | Invoked | Min(ms) | Avg(ms) | Max(ms) |
|---|---|---|---|---|---|---|
| article cancel | 00:00:00.023 | 0.0% | 70 | 0.000 | 0.329 | 1.000 |
| article cleanup | 00:00:00.113 | 0.0% | 18594 | 0.000 | 0.006 | 0.034 |
| article logging | 00:00:00.591 | 0.0% | 19117 | 0.000 | 0.031 | 0.075 |
| article parse | 00:00:00.285 | 0.0% | 20255 | 0.000 | 0.014 | 0.041 |
| article write | 00:00:03.165 | 0.0% | 18432 | 0.074 | 0.172 | 0.313 |
| artlog/artcncl | 00:00:00.001 | 0.0% | 70 | 0.000 | 0.014 | 0.500 |
| data move | 00:00:00.008 | 0.0% | 22204 | 0.000 | 0.000 | 0.012 |
| hisgrep/artcncl | 00:00:00.000 | 0.0% | 60 | 0.000 | 0.000 | 0.000 |
| hishave/artcncl | 00:00:00.000 | 0.0% | 70 | 0.000 | 0.000 | 0.000 |
| history grep | 00:00:00.000 | 0.0% | 0 | 0.000 | 0.000 | 0.000 |
| history lookup | 00:00:00.085 | 0.0% | 18934 | 0.000 | 0.004 | 0.034 |
| history sync | 00:00:00.016 | 0.0% | 313 | 0.000 | 0.051 | 1.000 |
| history write | 00:00:00.712 | 0.0% | 18591 | 0.000 | 0.038 | 0.100 |
| hiswrite/artcncl | 00:00:00.000 | 0.0% | 10 | 0.000 | 0.000 | 0.000 |
| idle | 24:00:01.683 | 100.0% | 20924 | 2325.562 | 4129.310 | 10172.085 |
| nntp read | 00:00:00.622 | 0.0% | 20673 | 0.000 | 0.030 | 0.085 |
| overview write | 00:00:01.984 | 0.0% | 18432 | 0.016 | 0.108 | 1.664 |
| perl filter | 00:00:12.709 | 0.0% | 18591 | 0.541 | 0.684 | 0.924 |
| python filter | 00:00:00.000 | 0.0% | 0 | 0.000 | 0.000 | 0.000 |
| site send | 00:00:00.779 | 0.0% | 18432 | 0.000 | 0.042 | 0.117 |
| TOTAL: 24:00:26.380 | 24:00:22.776 | 100.0% | - | - | - | - |
INNfeed timer:
| Code region | Time | Pct | Invoked | Min(ms) | Avg(ms) | Max(ms) |
|---|---|---|---|---|---|---|
| article new | 00:00:00.039 | 0.0% | 18328 | 0.000 | 0.002 | 0.022 |
| article prepare | 00:00:00.008 | 0.0% | 73244 | 0.000 | 0.000 | 0.002 |
| article read | 00:00:00.812 | 0.0% | 18311 | 0.011 | 0.044 | 0.382 |
| backlog stats | 00:00:00.022 | 0.0% | 60106 | 0.000 | 0.000 | 0.005 |
| callbacks | 00:00:00.000 | 0.0% | 0 | 0.000 | 0.000 | 0.000 |
| data read | 00:00:00.312 | 0.0% | 37025 | 0.000 | 0.008 | 0.029 |
| data write | 00:00:00.546 | 0.0% | 18722 | 0.000 | 0.029 | 0.088 |
| idle | 23:49:08.043 | 100.0% | 60106 | 804.239 | 1426.614 | 3461.610 |
| status file | 00:00:00.099 | 0.0% | 239 | 0.000 | 0.414 | 2.000 |
| TOTAL: 23:49:10.957 | 23:49:09.881 | 100.0% | - | - | - | - |
nnrpd timer:
| Code region | Time | Pct | Invoked | Min(ms) | Avg(ms) | Max(ms) |
|---|---|---|---|---|---|---|
| idle | 00:00:10.079 | 98.5% | 2 | 255.000 | 5039.500 | 9824.000 |
| newnews | 00:00:00.000 | 0.0% | 0 | 0.000 | 0.000 | 0.000 |
| nntpwrite | 00:00:00.000 | 0.0% | 4 | 0.000 | 0.000 | 0.000 |
| TOTAL: 00:00:10.233 | 00:00:10.079 | 98.5% | - | - | - | - |
Control commands to INND:
| Command | Number |
|---|---|
| L | 1 |
| flush | 3 |
| flushlogs | 2 |
| go | 2 |
| logmode | 2 |
| mode | 149 |
| name | 2 |
| pause | 2 |
| paused | 2 |
| reload | 4 |
| reserve | 2 |
| TOTAL: 11 | 171 |
Incoming Feeds (INN):
| Server | Connects | Offered | Taken | Refused | Reject | %Accpt | Elapsed | |
|---|---|---|---|---|---|---|---|---|
| 1 | i2pn | 10 | 18650 | 18488 | 0 | 162 | 99% | 25:17:33 |
| 2 | novabbs | 24 | 24 | 20 | 4 | 0 | 83% | 04:07:14 |
| 3 | localhost | 26 | 0 | 0 | 0 | 0 | 0% | 00:00:00 |
| TOTAL: 3 | 60 | 18674 | 18508 | 4 | 162 | 99% | 29:24:47 | |
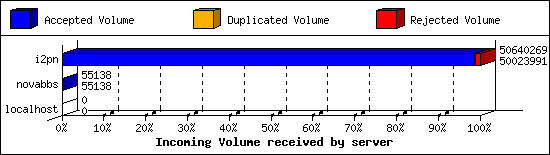
Incoming Volume (INN):
| Server | AcceptVol | DupVol | RejVol | TotalVol | %Acc | Vol/Art | |
|---|---|---|---|---|---|---|---|
| 1 | i2pn | 47.7 MB | 23.1 KB | 578.7 KB | 48.3 MB | 98% | 2.7 KB |
| 2 | novabbs | 53.8 KB | 0.0 KB | 0.0 KB | 53.8 KB | 100% | 2.7 KB |
| 3 | localhost | 0.0 KB | 0.0 KB | 0.0 KB | 0.0 KB | 0% | 0 |
| TOTAL: 3 | 47.8 MB | 23.1 KB | 578.7 KB | 48.3 MB | 98% | 2.7 KB | |
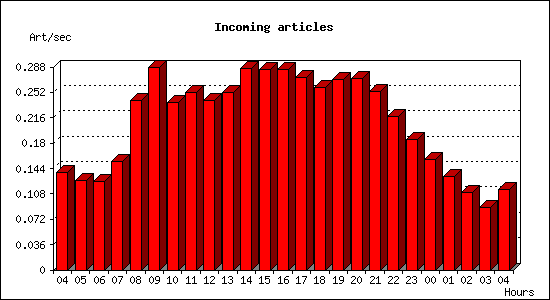
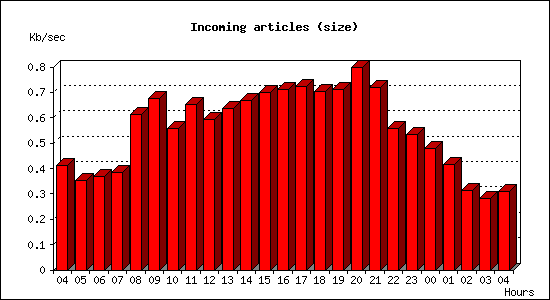
Incoming articles:
| Date | Articles | %Arts | Art/sec | Size | %Size | KB/sec |
|---|---|---|---|---|---|---|
| Feb 22 04:15:01 - 04:59:59 | 373 | 2.0% | 0.14 | 1.1 MB | 2.3% | 0.41 |
| Feb 22 05:00:00 - 05:59:59 | 455 | 2.5% | 0.13 | 1.2 MB | 2.6% | 0.35 |
| Feb 22 06:00:00 - 06:59:59 | 450 | 2.4% | 0.12 | 1.3 MB | 2.7% | 0.37 |
| Feb 22 07:00:00 - 07:59:59 | 555 | 3.0% | 0.15 | 1.3 MB | 2.8% | 0.38 |
| Feb 22 08:00:00 - 08:59:59 | 865 | 4.7% | 0.24 | 2.2 MB | 4.5% | 0.61 |
| Feb 22 09:00:00 - 09:59:59 | 1036 | 5.6% | 0.29 | 2.4 MB | 5.0% | 0.68 |
| Feb 22 10:00:00 - 10:59:59 | 855 | 4.6% | 0.24 | 2.0 MB | 4.1% | 0.56 |
| Feb 22 11:00:00 - 11:59:59 | 905 | 4.9% | 0.25 | 2.3 MB | 4.8% | 0.65 |
| Feb 22 12:00:00 - 12:59:59 | 867 | 4.7% | 0.24 | 2.1 MB | 4.4% | 0.59 |
| Feb 22 13:00:00 - 13:59:59 | 908 | 4.9% | 0.25 | 2.2 MB | 4.7% | 0.64 |
| Feb 22 14:00:00 - 14:59:59 | 1031 | 5.6% | 0.29 | 2.3 MB | 4.9% | 0.67 |
| Feb 22 15:00:00 - 15:59:59 | 1022 | 5.5% | 0.28 | 2.5 MB | 5.2% | 0.70 |
| Feb 22 16:00:00 - 16:59:59 | 1025 | 5.6% | 0.28 | 2.5 MB | 5.3% | 0.71 |
| Feb 22 17:00:00 - 17:59:59 | 985 | 5.3% | 0.27 | 2.5 MB | 5.3% | 0.72 |
| Feb 22 18:00:00 - 18:59:59 | 931 | 5.0% | 0.26 | 2.5 MB | 5.2% | 0.70 |
| Feb 22 19:00:00 - 19:59:59 | 972 | 5.3% | 0.27 | 2.5 MB | 5.3% | 0.71 |
| Feb 22 20:00:00 - 20:59:59 | 979 | 5.3% | 0.27 | 2.8 MB | 5.9% | 0.80 |
| Feb 22 21:00:00 - 21:59:59 | 914 | 5.0% | 0.25 | 2.5 MB | 5.3% | 0.72 |
| Feb 22 22:00:00 - 22:59:59 | 784 | 4.3% | 0.22 | 2.0 MB | 4.1% | 0.56 |
| Feb 22 23:00:00 - 23:59:59 | 667 | 3.6% | 0.19 | 1.9 MB | 3.9% | 0.53 |
| Feb 23 00:00:00 - 00:59:59 | 563 | 3.1% | 0.16 | 1.7 MB | 3.5% | 0.48 |
| Feb 23 01:00:00 - 01:59:59 | 477 | 2.6% | 0.13 | 1.5 MB | 3.1% | 0.42 |
| Feb 23 02:00:00 - 02:59:59 | 398 | 2.2% | 0.11 | 1.1 MB | 2.3% | 0.31 |
| Feb 23 03:00:00 - 03:59:59 | 321 | 1.7% | 0.09 | 1014.8 KB | 2.1% | 0.28 |
| Feb 23 04:00:00 - 04:15:01 | 103 | 0.6% | 0.11 | 278.8 KB | 0.6% | 0.31 |
| TOTAL: 24:00:00 | 18441 | 100.0% | 0.21 | 47.6 MB | 100.0% | 0.56 |
Sites sending bad articles:
| Server | Total | Group | Dist | Duplic | Unapp | TooOld | Site | Line | Other | |
|---|---|---|---|---|---|---|---|---|---|---|
| 1 | i2pn | 686 | 18 | 0 | 3 | 0 | 0 | 0 | 0 | 665 |
| TOTAL: 1 | 686 | 18 | 0 | 3 | 0 | 0 | 0 | 0 | 665 | |
Unwanted newsgroups [Top 20]:
| Newsgroup | Count |
|---|---|
| alt.politics.scorched-earth | 11 |
| hk.politics | 5 |
| 24hoursupport.helpdesk | 1 |
| alt.rec.guns | 1 |
| TOTAL: 4 | 18 |
INND Perl filter [Top 20]:
| Reason | Count |
|---|---|
| Scoring filter (s5) | 121 |
| Scoring filter (s6) | 18 |
| Scoring filter (n6) | 3 |
| TOTAL: 3 | 142 |
NoCeM on Spool:
| Id | Good | Bad | Unique | Total |
|---|---|---|---|---|
| bleachbot@httrack.com | 1 | 0 | 1 | 1 |
| TOTAL: 1 | 1 | 0 | 1 | 1 |
Miscellaneous innd statistics [Top 10]:
| Event | Server | Number |
|---|---|---|
| Including strange strings | ||
| i2pn | 523 | |
| TOTAL: 1 | 523 | |
| TOTAL: 1 | 523 | |
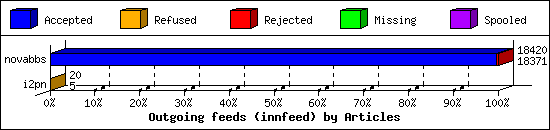
Outgoing Feeds (innfeed) by Articles:
| Server | Offered | Taken | Refused | Reject | Miss | Spool | %Took | Elapsed | |
|---|---|---|---|---|---|---|---|---|---|
| 1 | novabbs | 18423 | 18371 | 2 | 47 | 0 | 0 | 99% | 23:59:56 |
| 2 | i2pn | 23 | 5 | 15 | 0 | 0 | 0 | 21% | 03:16:12 |
| TOTAL: 2 | 18446 | 18376 | 17 | 47 | 0 | 0 | 99% | 27:16:08 | |
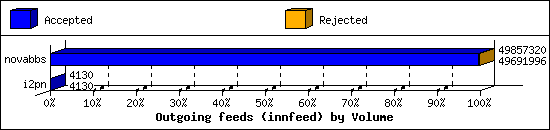
Outgoing Feeds (innfeed) by Volume:
| Server | AcceptVol | RejectVol | TotalVol | Volume/sec | Vol/Art | Elapsed | |
|---|---|---|---|---|---|---|---|
| 1 | novabbs | 47.4 MB | 161.4 KB | 47.5 MB | 0.6 KB/s | 2.6 KB | 23:59:56 |
| 2 | i2pn | 4.0 KB | 0.0 KB | 4.0 KB | 0.0 KB/s | 0.8 KB | 03:16:12 |
| TOTAL: 2 | 47.4 MB | 161.4 KB | 47.6 MB | 0.5 KB/s | 2.6 KB | 27:16:08 | |
NNRP readership statistics:
| System | Conn | Arts | Size | Groups | Post | Rej | Elapsed | |
|---|---|---|---|---|---|---|---|---|
| 1 | 106.75.63.218 | 1 | 0 | 0.0 KB | 0 | 0 | 0 | 00:00:00 |
| 2 | 104.131.145.112 | 1 | 0 | 0.0 KB | 0 | 0 | 0 | 00:00:09 |
| TOTAL: 2 | 2 | 0 | 0.0 KB | 0 | 0 | 0 | 00:00:10 | |
NNRP readership statistics (by domain):
| System | Conn | Arts | Size | Groups | Post | Rej | Elapsed | |
|---|---|---|---|---|---|---|---|---|
| 1 | unresolved | 2 | 0 | 0.0 KB | 0 | 0 | 0 | 00:00:10 |
| TOTAL: 1 | 2 | 0 | 0.0 KB | 0 | 0 | 0 | 00:00:10 | |
NNRP total resource statistics [Top 20]:
| System | User(ms) | System(ms) | Idle(ms) | Elapsed |
|---|---|---|---|---|
| 104.131.145.112 | 0.056 | 0.012 | 0.000 | 00:00:09 |
| 106.75.63.218 | 0.044 | 0.012 | 0.000 | 00:00:00 |
| TOTAL: 2 | 0.100 | 0.024 | 0.000 | 00:00:10 |
