Log entries by program:
| Program name | Lines | %Lines | Size | %Size |
|---|---|---|---|---|
| inn | 16317 | 87.8% | 1.3 MB | 82.2% |
| innd | 1424 | 7.7% | 197.7 KB | 11.8% |
| innfeed | 754 | 4.1% | 90.0 KB | 5.4% |
| nocem | 80 | 0.4% | 8.3 KB | 0.5% |
| nnrpd | 7 | 0.0% | 0.8 KB | 0.0% |
| controlchan | 1 | 0.0% | 0.1 KB | 0.0% |
| TOTAL: 6 | 18583 | 100.0% | 1.6 MB | 100.0% |
History cache:
| Reason | Count | %Count |
|---|---|---|
| Do not exist | 15914 | 98.1% |
| Negative hits | 172 | 1.1% |
| Positive hits | 112 | 0.7% |
| Cache misses | 26 | 0.2% |
| TOTAL: 4 | 16224 | 100.0% |
INND timer:
| Code region | Time | Pct | Invoked | Min(ms) | Avg(ms) | Max(ms) |
|---|---|---|---|---|---|---|
| article cancel | 00:00:00.032 | 0.0% | 165 | 0.000 | 0.194 | 1.250 |
| article cleanup | 00:00:00.082 | 0.0% | 15914 | 0.000 | 0.005 | 0.038 |
| article logging | 00:00:00.545 | 0.0% | 16219 | 0.000 | 0.034 | 0.085 |
| article parse | 00:00:00.256 | 0.0% | 17419 | 0.000 | 0.015 | 0.049 |
| article write | 00:00:03.283 | 0.0% | 15739 | 0.054 | 0.209 | 3.447 |
| artlog/artcncl | 00:00:00.004 | 0.0% | 112 | 0.000 | 0.036 | 1.000 |
| data move | 00:00:00.003 | 0.0% | 19236 | 0.000 | 0.000 | 0.013 |
| hisgrep/artcncl | 00:00:00.002 | 0.0% | 136 | 0.000 | 0.015 | 0.125 |
| hishave/artcncl | 00:00:00.000 | 0.0% | 165 | 0.000 | 0.000 | 0.000 |
| history grep | 00:00:00.000 | 0.0% | 0 | 0.000 | 0.000 | 0.000 |
| history lookup | 00:00:00.086 | 0.0% | 16089 | 0.000 | 0.005 | 0.042 |
| history sync | 00:00:00.012 | 0.0% | 312 | 0.000 | 0.038 | 1.000 |
| history write | 00:00:00.609 | 0.0% | 15912 | 0.000 | 0.038 | 0.132 |
| hiswrite/artcncl | 00:00:00.000 | 0.0% | 29 | 0.000 | 0.000 | 0.000 |
| idle | 24:00:03.984 | 100.0% | 18025 | 2596.667 | 4793.564 | 13336.489 |
| nntp read | 00:00:00.540 | 0.0% | 17768 | 0.000 | 0.030 | 0.072 |
| overview write | 00:00:01.882 | 0.0% | 15739 | 0.021 | 0.120 | 0.800 |
| perl filter | 00:00:11.843 | 0.0% | 15912 | 0.576 | 0.744 | 1.000 |
| python filter | 00:00:00.000 | 0.0% | 0 | 0.000 | 0.000 | 0.000 |
| site send | 00:00:00.766 | 0.0% | 15807 | 0.000 | 0.048 | 0.139 |
| TOTAL: 24:00:27.175 | 24:00:23.929 | 100.0% | - | - | - | - |
INNfeed timer:
| Code region | Time | Pct | Invoked | Min(ms) | Avg(ms) | Max(ms) |
|---|---|---|---|---|---|---|
| article new | 00:00:00.031 | 0.0% | 15714 | 0.000 | 0.002 | 0.034 |
| article prepare | 00:00:00.009 | 0.0% | 62828 | 0.000 | 0.000 | 0.007 |
| article read | 00:00:00.730 | 0.0% | 15707 | 0.000 | 0.046 | 0.925 |
| backlog stats | 00:00:00.023 | 0.0% | 51971 | 0.000 | 0.000 | 0.006 |
| callbacks | 00:00:00.000 | 0.0% | 0 | 0.000 | 0.000 | 0.000 |
| data read | 00:00:00.287 | 0.0% | 31646 | 0.000 | 0.009 | 0.026 |
| data write | 00:00:00.449 | 0.0% | 15947 | 0.000 | 0.028 | 0.109 |
| idle | 23:57:56.998 | 100.0% | 51971 | 962.918 | 1660.099 | 4187.125 |
| status file | 00:00:00.109 | 0.0% | 216 | 0.000 | 0.505 | 2.500 |
| TOTAL: 23:57:59.671 | 23:57:58.636 | 100.0% | - | - | - | - |
nnrpd timer:
| Code region | Time | Pct | Invoked | Min(ms) | Avg(ms) | Max(ms) |
|---|---|---|---|---|---|---|
| idle | 00:00:00.148 | 29.2% | 2 | 74.000 | 74.000 | 74.000 |
| newnews | 00:00:00.000 | 0.0% | 0 | 0.000 | 0.000 | 0.000 |
| nntpwrite | 00:00:00.000 | 0.0% | 11 | 0.000 | 0.000 | 0.000 |
| TOTAL: 00:00:00.506 | 00:00:00.148 | 29.2% | - | - | - | - |
Control commands to INND:
| Command | Number |
|---|---|
| L | 1 |
| flush | 3 |
| flushlogs | 2 |
| go | 2 |
| logmode | 2 |
| mode | 149 |
| name | 2 |
| pause | 2 |
| paused | 2 |
| reload | 4 |
| reserve | 2 |
| TOTAL: 11 | 171 |
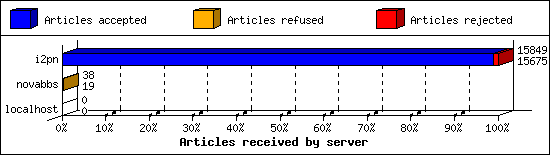
Incoming Feeds (INN):
| Server | Connects | Offered | Taken | Refused | Reject | %Accpt | Elapsed | |
|---|---|---|---|---|---|---|---|---|
| 1 | i2pn | 4 | 15849 | 15675 | 0 | 174 | 98% | 24:13:43 |
| 2 | novabbs | 24 | 38 | 19 | 19 | 0 | 50% | 04:34:35 |
| 3 | localhost | 37 | 0 | 0 | 0 | 0 | 0% | 00:00:00 |
| TOTAL: 3 | 65 | 15887 | 15694 | 19 | 174 | 98% | 28:48:18 | |
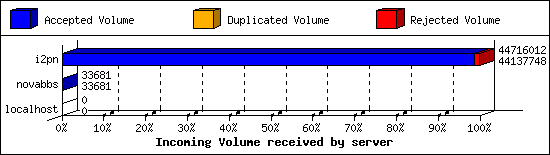
Incoming Volume (INN):
| Server | AcceptVol | DupVol | RejVol | TotalVol | %Acc | Vol/Art | |
|---|---|---|---|---|---|---|---|
| 1 | i2pn | 42.1 MB | 9.6 KB | 555.1 KB | 42.6 MB | 98% | 2.8 KB |
| 2 | novabbs | 32.9 KB | 0.0 KB | 0.0 KB | 32.9 KB | 100% | 1.7 KB |
| 3 | localhost | 0.0 KB | 0.0 KB | 0.0 KB | 0.0 KB | 0% | 0 |
| TOTAL: 3 | 42.1 MB | 9.6 KB | 555.1 KB | 42.7 MB | 98% | 2.8 KB | |
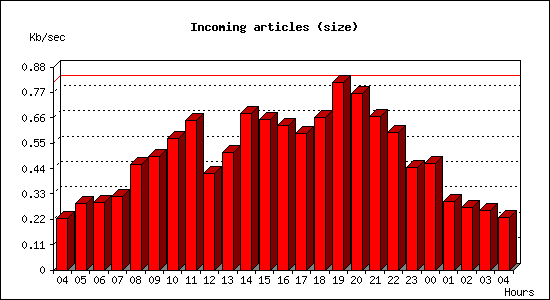
Incoming articles:
| Date | Articles | %Arts | Art/sec | Size | %Size | KB/sec |
|---|---|---|---|---|---|---|
| Feb 23 04:15:01 - 04:59:59 | 214 | 1.4% | 0.08 | 599.3 KB | 1.4% | 0.22 |
| Feb 23 05:00:00 - 05:59:59 | 323 | 2.1% | 0.09 | 1.0 MB | 2.4% | 0.29 |
| Feb 23 06:00:00 - 06:59:59 | 372 | 2.4% | 0.10 | 1.0 MB | 2.4% | 0.29 |
| Feb 23 07:00:00 - 07:59:59 | 449 | 2.9% | 0.12 | 1.1 MB | 2.6% | 0.32 |
| Feb 23 08:00:00 - 08:59:59 | 609 | 3.9% | 0.17 | 1.6 MB | 3.8% | 0.46 |
| Feb 23 09:00:00 - 09:59:59 | 673 | 4.3% | 0.19 | 1.7 MB | 4.1% | 0.49 |
| Feb 23 10:00:00 - 10:59:59 | 742 | 4.7% | 0.21 | 2.0 MB | 4.7% | 0.57 |
| Feb 23 11:00:00 - 11:59:59 | 805 | 5.1% | 0.22 | 2.3 MB | 5.4% | 0.65 |
| Feb 23 12:00:00 - 12:59:59 | 617 | 3.9% | 0.17 | 1.5 MB | 3.5% | 0.42 |
| Feb 23 13:00:00 - 13:59:59 | 704 | 4.5% | 0.20 | 1.8 MB | 4.2% | 0.51 |
| Feb 23 14:00:00 - 14:59:59 | 895 | 5.7% | 0.25 | 2.4 MB | 5.7% | 0.68 |
| Feb 23 15:00:00 - 15:59:59 | 919 | 5.8% | 0.26 | 2.3 MB | 5.4% | 0.65 |
| Feb 23 16:00:00 - 16:59:59 | 878 | 5.6% | 0.24 | 2.2 MB | 5.2% | 0.62 |
| Feb 23 17:00:00 - 17:59:59 | 837 | 5.3% | 0.23 | 2.1 MB | 4.9% | 0.59 |
| Feb 23 18:00:00 - 18:59:59 | 875 | 5.6% | 0.24 | 2.3 MB | 5.5% | 0.66 |
| Feb 23 19:00:00 - 19:59:59 | 989 | 6.3% | 0.27 | 2.9 MB | 6.8% | 0.81 |
| Feb 23 20:00:00 - 20:59:59 | 929 | 5.9% | 0.26 | 2.7 MB | 6.4% | 0.77 |
| Feb 23 21:00:00 - 21:59:59 | 838 | 5.3% | 0.23 | 2.3 MB | 5.6% | 0.67 |
| Feb 23 22:00:00 - 22:59:59 | 783 | 5.0% | 0.22 | 2.1 MB | 5.0% | 0.60 |
| Feb 23 23:00:00 - 23:59:59 | 596 | 3.8% | 0.17 | 1.6 MB | 3.7% | 0.44 |
| Feb 24 00:00:00 - 00:59:59 | 552 | 3.5% | 0.15 | 1.6 MB | 3.8% | 0.46 |
| Feb 24 01:00:00 - 01:59:59 | 376 | 2.4% | 0.10 | 1.0 MB | 2.5% | 0.30 |
| Feb 24 02:00:00 - 02:59:59 | 367 | 2.3% | 0.10 | 974.5 KB | 2.3% | 0.27 |
| Feb 24 03:00:00 - 03:59:59 | 310 | 2.0% | 0.09 | 930.5 KB | 2.2% | 0.26 |
| Feb 24 04:00:00 - 04:15:01 | 74 | 0.5% | 0.08 | 204.2 KB | 0.5% | 0.23 |
| TOTAL: 24:00:00 | 15726 | 100.0% | 0.18 | 42.2 MB | 100.0% | 0.50 |

Sites sending bad articles:
| Server | Total | Group | Dist | Duplic | Unapp | TooOld | Site | Line | Other | |
|---|---|---|---|---|---|---|---|---|---|---|
| 1 | i2pn | 479 | 19 | 0 | 2 | 0 | 0 | 0 | 0 | 458 |
| TOTAL: 1 | 479 | 19 | 0 | 2 | 0 | 0 | 0 | 0 | 458 | |
Unwanted newsgroups [Top 20]:
| Newsgroup | Count |
|---|---|
| alt.politics.scorched-earth | 16 |
| 24hoursupport.helpdesk | 1 |
| alt.sex.girl | 1 |
| hk.politics | 1 |
| TOTAL: 4 | 19 |
INND Perl filter [Top 20]:
| Reason | Count |
|---|---|
| Scoring filter (s5) | 131 |
| Scoring filter (s6) | 19 |
| Scoring filter (n6) | 3 |
| TOTAL: 3 | 153 |
NoCeM on Spool:
| Id | Good | Bad | Unique | Total |
|---|---|---|---|---|
| bleachbot@httrack.com | 68 | 0 | 74 | 74 |
| TOTAL: 1 | 68 | 0 | 74 | 74 |
Miscellaneous innd statistics [Top 10]:
| Event | Server | Number |
|---|---|---|
| Including strange strings | ||
| i2pn | 305 | |
| TOTAL: 1 | 305 | |
| TOTAL: 1 | 305 | |
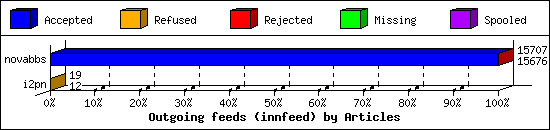
Outgoing Feeds (innfeed) by Articles:
| Server | Offered | Taken | Refused | Reject | Miss | Spool | %Took | Elapsed | |
|---|---|---|---|---|---|---|---|---|---|
| 1 | novabbs | 15708 | 15676 | 0 | 31 | 0 | 0 | 99% | 23:59:58 |
| 2 | i2pn | 20 | 12 | 7 | 0 | 0 | 0 | 60% | 03:04:59 |
| TOTAL: 2 | 15728 | 15688 | 7 | 31 | 0 | 0 | 99% | 27:04:57 | |
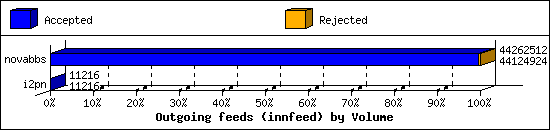
Outgoing Feeds (innfeed) by Volume:
| Server | AcceptVol | RejectVol | TotalVol | Volume/sec | Vol/Art | Elapsed | |
|---|---|---|---|---|---|---|---|
| 1 | novabbs | 42.1 MB | 134.4 KB | 42.2 MB | 0.5 KB/s | 2.8 KB | 23:59:58 |
| 2 | i2pn | 11.0 KB | 0.0 KB | 11.0 KB | 0.0 KB/s | 0.9 KB | 03:04:59 |
| TOTAL: 2 | 42.1 MB | 134.4 KB | 42.2 MB | 0.4 KB/s | 2.8 KB | 27:04:57 | |
NNRP readership statistics:
| System | Conn | Arts | Size | Groups | Post | Rej | Elapsed | |
|---|---|---|---|---|---|---|---|---|
| 1 | scan-141.security.ipip.net | 1 | 0 | 0.0 KB | 0 | 0 | 0 | 00:00:00 |
| TOTAL: 1 | 1 | 0 | 0.0 KB | 0 | 0 | 0 | 00:00:00 | |
NNRP readership statistics (by domain):
| System | Conn | Arts | Size | Groups | Post | Rej | Elapsed | |
|---|---|---|---|---|---|---|---|---|
| 1 | *.security.ipip.net | 1 | 0 | 0.0 KB | 0 | 0 | 0 | 00:00:00 |
| TOTAL: 1 | 1 | 0 | 0.0 KB | 0 | 0 | 0 | 00:00:00 | |
NNRP total resource statistics [Top 20]:
| System | User(ms) | System(ms) | Idle(ms) | Elapsed |
|---|---|---|---|---|
| scan-141.security.ipip.net | 0.040 | 0.012 | 0.000 | 00:00:00 |
| TOTAL: 1 | 0.040 | 0.012 | 0.000 | 00:00:00 |
NNRP unrecognized commands (by host):
| System | Conn |
|---|---|
| scan-141.security.ipip.net | 4 |
| TOTAL: 1 | 4 |
NNRP unrecognized commands (by command):
| Command | Count |
|---|---|
| Host: 157.230.63.40:119 | 1 |
| Connection: close | 1 |
| GET / HTTP/1.1 | 1 |
| User-Agent: HTTP Banner Detection (https... | 1 |
| TOTAL: 4 | 4 |
