
Log entries by program:
| Program name | Lines | %Lines | Size | %Size |
|---|---|---|---|---|
| inn | 18371 | 88.0% | 1.7 MB | 83.7% |
| innd | 1437 | 6.9% | 202.7 KB | 9.6% |
| innfeed | 962 | 4.6% | 129.2 KB | 6.1% |
| nocem | 98 | 0.5% | 11.6 KB | 0.5% |
| nnrpd | 7 | 0.0% | 0.7 KB | 0.0% |
| controlchan | 1 | 0.0% | 0.1 KB | 0.0% |
| TOTAL: 6 | 20876 | 100.0% | 2.1 MB | 100.0% |
History cache:
| Reason | Count | %Count |
|---|---|---|
| Do not exist | 17861 | 97.6% |
| Negative hits | 243 | 1.3% |
| Positive hits | 157 | 0.9% |
| Cache misses | 32 | 0.2% |
| TOTAL: 4 | 18293 | 100.0% |
INND timer:
| Code region | Time | Pct | Invoked | Min(ms) | Avg(ms) | Max(ms) |
|---|---|---|---|---|---|---|
| article cancel | 00:00:00.042 | 0.0% | 209 | 0.000 | 0.201 | 1.000 |
| article cleanup | 00:00:00.079 | 0.0% | 17858 | 0.000 | 0.004 | 0.029 |
| article logging | 00:00:00.570 | 0.0% | 18214 | 0.000 | 0.031 | 0.088 |
| article parse | 00:00:00.279 | 0.0% | 19845 | 0.000 | 0.014 | 0.045 |
| article write | 00:00:02.977 | 0.0% | 17670 | 0.086 | 0.168 | 0.359 |
| artlog/artcncl | 00:00:00.005 | 0.0% | 151 | 0.000 | 0.033 | 1.000 |
| data move | 00:00:00.013 | 0.0% | 22290 | 0.000 | 0.001 | 0.014 |
| hisgrep/artcncl | 00:00:00.000 | 0.0% | 179 | 0.000 | 0.000 | 0.000 |
| hishave/artcncl | 00:00:00.001 | 0.0% | 209 | 0.000 | 0.005 | 0.250 |
| history grep | 00:00:00.000 | 0.0% | 0 | 0.000 | 0.000 | 0.000 |
| history lookup | 00:00:00.076 | 0.0% | 18110 | 0.000 | 0.004 | 0.037 |
| history sync | 00:00:00.013 | 0.0% | 320 | 0.000 | 0.041 | 1.000 |
| history write | 00:00:00.654 | 0.0% | 17850 | 0.000 | 0.037 | 0.088 |
| hiswrite/artcncl | 00:00:00.000 | 0.0% | 30 | 0.000 | 0.000 | 0.000 |
| idle | 24:00:02.368 | 100.0% | 20574 | 2520.660 | 4199.590 | 10171.373 |
| nntp read | 00:00:00.573 | 0.0% | 20304 | 0.000 | 0.028 | 0.069 |
| overview write | 00:00:01.798 | 0.0% | 17670 | 0.016 | 0.102 | 0.977 |
| perl filter | 00:00:12.351 | 0.0% | 17850 | 0.481 | 0.692 | 0.912 |
| python filter | 00:00:00.000 | 0.0% | 0 | 0.000 | 0.000 | 0.000 |
| site send | 00:00:00.819 | 0.0% | 17761 | 0.000 | 0.046 | 0.166 |
| TOTAL: 24:00:26.084 | 24:00:22.618 | 100.0% | - | - | - | - |
INNfeed timer:
| Code region | Time | Pct | Invoked | Min(ms) | Avg(ms) | Max(ms) |
|---|---|---|---|---|---|---|
| article new | 00:00:00.038 | 0.0% | 17662 | 0.000 | 0.002 | 0.018 |
| article prepare | 00:00:00.016 | 0.0% | 141096 | 0.000 | 0.000 | 0.003 |
| article read | 00:00:00.742 | 0.0% | 17656 | 0.000 | 0.042 | 0.580 |
| backlog stats | 00:00:00.031 | 0.0% | 78171 | 0.000 | 0.000 | 0.003 |
| callbacks | 00:00:00.000 | 0.0% | 0 | 0.000 | 0.000 | 0.000 |
| data read | 00:00:00.368 | 0.0% | 54653 | 0.000 | 0.007 | 0.026 |
| data write | 00:00:00.734 | 0.0% | 37031 | 0.000 | 0.020 | 0.046 |
| idle | 23:58:08.208 | 100.0% | 78171 | 662.113 | 1103.839 | 2846.024 |
| status file | 00:00:00.111 | 0.0% | 267 | 0.000 | 0.416 | 2.250 |
| TOTAL: 23:58:11.503 | 23:58:10.248 | 100.0% | - | - | - | - |
nnrpd timer:
| Code region | Time | Pct | Invoked | Min(ms) | Avg(ms) | Max(ms) |
|---|---|---|---|---|---|---|
| idle | 00:00:00.160 | 7.1% | 2 | 80.000 | 80.000 | 80.000 |
| newnews | 00:00:00.000 | 0.0% | 0 | 0.000 | 0.000 | 0.000 |
| nntpwrite | 00:00:00.000 | 0.0% | 11 | 0.000 | 0.000 | 0.000 |
| TOTAL: 00:00:02.243 | 00:00:00.160 | 7.1% | - | - | - | - |
Control commands to INND:
| Command | Number |
|---|---|
| L | 1 |
| flush | 3 |
| flushlogs | 2 |
| go | 2 |
| logmode | 2 |
| mode | 149 |
| name | 2 |
| pause | 2 |
| paused | 2 |
| reload | 6 |
| reserve | 2 |
| TOTAL: 11 | 173 |
Incoming Feeds (INN):
| Server | Connects | Offered | Taken | Refused | Reject | %Accpt | Elapsed | |
|---|---|---|---|---|---|---|---|---|
| 1 | i2pn | 6 | 17801 | 17615 | 1 | 185 | 98% | 24:31:16 |
| 2 | novabbs | 29 | 47 | 18 | 29 | 0 | 38% | 05:56:56 |
| 3 | localhost | 32 | 0 | 0 | 0 | 0 | 0% | 00:00:00 |
| TOTAL: 3 | 67 | 17848 | 17633 | 30 | 185 | 98% | 30:28:12 | |
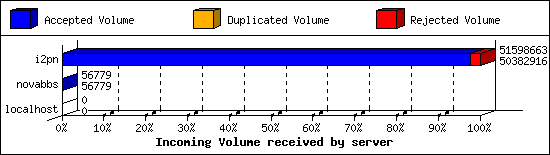
Incoming Volume (INN):
| Server | AcceptVol | DupVol | RejVol | TotalVol | %Acc | Vol/Art | |
|---|---|---|---|---|---|---|---|
| 1 | i2pn | 48.0 MB | 18.9 KB | 1.1 MB | 49.2 MB | 97% | 2.8 KB |
| 2 | novabbs | 55.4 KB | 0.0 KB | 0.0 KB | 55.4 KB | 100% | 3.1 KB |
| 3 | localhost | 0.0 KB | 0.0 KB | 0.0 KB | 0.0 KB | 0% | 0 |
| TOTAL: 3 | 48.1 MB | 18.9 KB | 1.1 MB | 49.3 MB | 97% | 2.8 KB | |
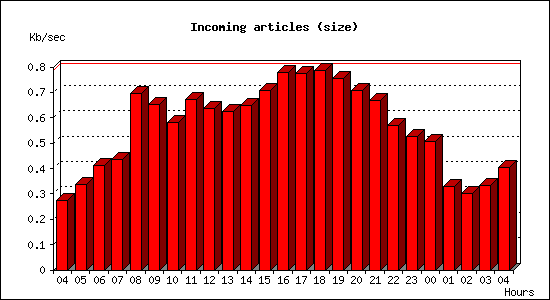
Incoming articles:
| Date | Articles | %Arts | Art/sec | Size | %Size | KB/sec |
|---|---|---|---|---|---|---|
| Feb 27 04:15:01 - 04:59:59 | 270 | 1.5% | 0.10 | 739.8 KB | 1.5% | 0.27 |
| Feb 27 05:00:00 - 05:59:59 | 356 | 2.0% | 0.10 | 1.2 MB | 2.5% | 0.34 |
| Feb 27 06:00:00 - 06:59:59 | 505 | 2.9% | 0.14 | 1.4 MB | 3.0% | 0.41 |
| Feb 27 07:00:00 - 07:59:59 | 662 | 3.7% | 0.18 | 1.5 MB | 3.2% | 0.44 |
| Feb 27 08:00:00 - 08:59:59 | 828 | 4.7% | 0.23 | 2.4 MB | 5.1% | 0.70 |
| Feb 27 09:00:00 - 09:59:59 | 830 | 4.7% | 0.23 | 2.3 MB | 4.7% | 0.65 |
| Feb 27 10:00:00 - 10:59:59 | 824 | 4.7% | 0.23 | 2.0 MB | 4.2% | 0.58 |
| Feb 27 11:00:00 - 11:59:59 | 855 | 4.8% | 0.24 | 2.4 MB | 4.9% | 0.67 |
| Feb 27 12:00:00 - 12:59:59 | 847 | 4.8% | 0.24 | 2.2 MB | 4.6% | 0.64 |
| Feb 27 13:00:00 - 13:59:59 | 857 | 4.8% | 0.24 | 2.2 MB | 4.5% | 0.62 |
| Feb 27 14:00:00 - 14:59:59 | 861 | 4.9% | 0.24 | 2.3 MB | 4.7% | 0.65 |
| Feb 27 15:00:00 - 15:59:59 | 912 | 5.2% | 0.25 | 2.5 MB | 5.2% | 0.71 |
| Feb 27 16:00:00 - 16:59:59 | 986 | 5.6% | 0.27 | 2.7 MB | 5.7% | 0.78 |
| Feb 27 17:00:00 - 17:59:59 | 1008 | 5.7% | 0.28 | 2.7 MB | 5.6% | 0.77 |
| Feb 27 18:00:00 - 18:59:59 | 1002 | 5.7% | 0.28 | 2.8 MB | 5.7% | 0.79 |
| Feb 27 19:00:00 - 19:59:59 | 1028 | 5.8% | 0.29 | 2.7 MB | 5.5% | 0.76 |
| Feb 27 20:00:00 - 20:59:59 | 925 | 5.2% | 0.26 | 2.5 MB | 5.1% | 0.71 |
| Feb 27 21:00:00 - 21:59:59 | 808 | 4.6% | 0.22 | 2.4 MB | 4.9% | 0.67 |
| Feb 27 22:00:00 - 22:59:59 | 752 | 4.3% | 0.21 | 2.0 MB | 4.2% | 0.57 |
| Feb 27 23:00:00 - 23:59:59 | 582 | 3.3% | 0.16 | 1.8 MB | 3.8% | 0.52 |
| Feb 28 00:00:00 - 00:59:59 | 649 | 3.7% | 0.18 | 1.8 MB | 3.7% | 0.51 |
| Feb 28 01:00:00 - 01:59:59 | 423 | 2.4% | 0.12 | 1.2 MB | 2.4% | 0.33 |
| Feb 28 02:00:00 - 02:59:59 | 404 | 2.3% | 0.11 | 1.1 MB | 2.2% | 0.30 |
| Feb 28 03:00:00 - 03:59:59 | 428 | 2.4% | 0.12 | 1.2 MB | 2.4% | 0.33 |
| Feb 28 04:00:00 - 04:15:01 | 75 | 0.4% | 0.08 | 364.1 KB | 0.7% | 0.40 |
| TOTAL: 24:00:00 | 17677 | 100.0% | 0.20 | 48.3 MB | 100.0% | 0.57 |

Sites sending bad articles:
| Server | Total | Group | Dist | Duplic | Unapp | TooOld | Site | Line | Other | |
|---|---|---|---|---|---|---|---|---|---|---|
| 1 | i2pn | 543 | 8 | 0 | 8 | 0 | 0 | 0 | 0 | 527 |
| TOTAL: 1 | 543 | 8 | 0 | 8 | 0 | 0 | 0 | 0 | 527 | |
Unwanted newsgroups [Top 20]:
| Newsgroup | Count |
|---|---|
| alt.fr.outil.thunderbird | 3 |
| hk.politics | 2 |
| alt.social-security-disability | 1 |
| spline.test | 1 |
| alt.politics.scorched-earth | 1 |
| TOTAL: 5 | 8 |
INND Perl filter [Top 20]:
| Reason | Count |
|---|---|
| Scoring filter (s5) | 130 |
| Scoring filter (s6) | 40 |
| EMP (phl) | 1 |
| TOTAL: 3 | 171 |
NoCeM on Spool:
| Id | Good | Bad | Unique | Total |
|---|---|---|---|---|
| bleachbot@httrack.com | 91 | 0 | 96 | 96 |
| TOTAL: 1 | 91 | 0 | 96 | 96 |
Miscellaneous innd statistics [Top 10]:
| Event | Server | Number |
|---|---|---|
| Including strange strings | ||
| i2pn | 356 | |
| TOTAL: 1 | 356 | |
| TOTAL: 1 | 356 | |
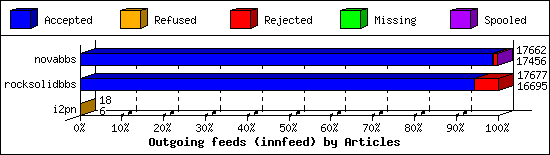
Outgoing Feeds (innfeed) by Articles:
| Server | Offered | Taken | Refused | Reject | Miss | Spool | %Took | Elapsed | |
|---|---|---|---|---|---|---|---|---|---|
| 1 | novabbs | 17688 | 17456 | 29 | 174 | 0 | 3 | 98% | 23:59:40 |
| 2 | rocksolidbbs | 17681 | 16695 | 3 | 979 | 0 | 0 | 94% | 23:59:58 |
| 3 | i2pn | 19 | 6 | 12 | 0 | 0 | 0 | 31% | 02:19:46 |
| TOTAL: 3 | 35388 | 34157 | 44 | 1153 | 0 | 3 | 96% | 50:19:24 | |
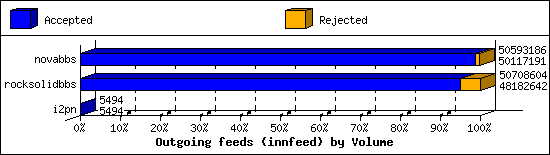
Outgoing Feeds (innfeed) by Volume:
| Server | AcceptVol | RejectVol | TotalVol | Volume/sec | Vol/Art | Elapsed | |
|---|---|---|---|---|---|---|---|
| 1 | novabbs | 47.8 MB | 464.8 KB | 48.2 MB | 0.6 KB/s | 2.8 KB | 23:59:40 |
| 2 | rocksolidbbs | 46.0 MB | 2.4 MB | 48.4 MB | 0.6 KB/s | 2.8 KB | 23:59:58 |
| 3 | i2pn | 5.4 KB | 0.0 KB | 5.4 KB | 0.0 KB/s | 0.9 KB | 02:19:46 |
| TOTAL: 3 | 93.8 MB | 2.9 MB | 96.6 MB | 0.5 KB/s | 2.8 KB | 50:19:24 | |
NNRP readership statistics:
| System | Conn | Arts | Size | Groups | Post | Rej | Elapsed | |
|---|---|---|---|---|---|---|---|---|
| 1 | scan-141.security.ipip.net | 1 | 0 | 0.0 KB | 0 | 0 | 0 | 00:00:02 |
| TOTAL: 1 | 1 | 0 | 0.0 KB | 0 | 0 | 0 | 00:00:02 | |
NNRP readership statistics (by domain):
| System | Conn | Arts | Size | Groups | Post | Rej | Elapsed | |
|---|---|---|---|---|---|---|---|---|
| 1 | *.security.ipip.net | 1 | 0 | 0.0 KB | 0 | 0 | 0 | 00:00:02 |
| TOTAL: 1 | 1 | 0 | 0.0 KB | 0 | 0 | 0 | 00:00:02 | |
NNRP total resource statistics [Top 20]:
| System | User(ms) | System(ms) | Idle(ms) | Elapsed |
|---|---|---|---|---|
| scan-141.security.ipip.net | 0.048 | 0.000 | 0.000 | 00:00:02 |
| TOTAL: 1 | 0.048 | 0.000 | 0.000 | 00:00:02 |
NNRP unrecognized commands (by host):
| System | Conn |
|---|---|
| scan-141.security.ipip.net | 4 |
| TOTAL: 1 | 4 |
NNRP unrecognized commands (by command):
| Command | Count |
|---|---|
| Host: 157.230.63.40:119 | 1 |
| User-Agent: HTTP Banner Detection (https... | 1 |
| GET / HTTP/1.1 | 1 |
| Connection: close | 1 |
| TOTAL: 4 | 4 |
