Log entries by program:
| Program name | Lines | %Lines | Size | %Size |
|---|---|---|---|---|
| inn | 16909 | 87.8% | 1.6 MB | 83.7% |
| innd | 1337 | 6.9% | 188.4 KB | 9.5% |
| innfeed | 920 | 4.8% | 123.8 KB | 6.3% |
| nocem | 69 | 0.4% | 7.5 KB | 0.4% |
| controlchan | 12 | 0.1% | 2.2 KB | 0.1% |
| nnrpd | 7 | 0.0% | 0.8 KB | 0.0% |
| pgpverify | 1 | 0.0% | 0.2 KB | 0.0% |
| TOTAL: 7 | 19255 | 100.0% | 1.9 MB | 100.0% |
History cache:
| Reason | Count | %Count |
|---|---|---|
| Do not exist | 16187 | 96.3% |
| Cache misses | 324 | 1.9% |
| Negative hits | 197 | 1.2% |
| Positive hits | 106 | 0.6% |
| TOTAL: 4 | 16814 | 100.0% |
INND timer:
| Code region | Time | Pct | Invoked | Min(ms) | Avg(ms) | Max(ms) |
|---|---|---|---|---|---|---|
| article cancel | 00:00:00.260 | 0.0% | 451 | 0.000 | 0.576 | 1.100 |
| article cleanup | 00:00:00.080 | 0.0% | 16172 | 0.000 | 0.005 | 0.035 |
| article logging | 00:00:00.531 | 0.0% | 16503 | 0.000 | 0.032 | 0.073 |
| article parse | 00:00:00.222 | 0.0% | 17913 | 0.000 | 0.012 | 0.058 |
| article write | 00:00:02.829 | 0.0% | 16057 | 0.067 | 0.176 | 0.911 |
| artlog/artcncl | 00:00:00.007 | 0.0% | 407 | 0.000 | 0.017 | 0.500 |
| data move | 00:00:00.005 | 0.0% | 19891 | 0.000 | 0.000 | 0.016 |
| hisgrep/artcncl | 00:00:00.006 | 0.0% | 426 | 0.000 | 0.014 | 0.250 |
| hishave/artcncl | 00:00:00.003 | 0.0% | 451 | 0.000 | 0.007 | 0.500 |
| history grep | 00:00:00.000 | 0.0% | 0 | 0.000 | 0.000 | 0.000 |
| history lookup | 00:00:00.075 | 0.0% | 16380 | 0.000 | 0.005 | 0.026 |
| history sync | 00:00:00.013 | 0.0% | 313 | 0.000 | 0.042 | 0.500 |
| history write | 00:00:00.740 | 0.0% | 16172 | 0.000 | 0.046 | 1.065 |
| hiswrite/artcncl | 00:00:00.000 | 0.0% | 25 | 0.000 | 0.000 | 0.000 |
| idle | 24:00:02.757 | 100.0% | 18493 | 1346.573 | 4672.187 | 11540.462 |
| nntp read | 00:00:00.545 | 0.0% | 18241 | 0.000 | 0.030 | 0.066 |
| overview write | 00:00:01.957 | 0.0% | 16057 | 0.016 | 0.122 | 1.106 |
| perl filter | 00:00:12.020 | 0.0% | 16172 | 0.585 | 0.743 | 1.772 |
| python filter | 00:00:00.000 | 0.0% | 0 | 0.000 | 0.000 | 0.000 |
| site send | 00:00:01.056 | 0.0% | 16118 | 0.000 | 0.066 | 0.174 |
| TOTAL: 24:00:26.218 | 24:00:23.106 | 100.0% | - | - | - | - |
INNfeed timer:
| Code region | Time | Pct | Invoked | Min(ms) | Avg(ms) | Max(ms) |
|---|---|---|---|---|---|---|
| article new | 00:00:00.029 | 0.0% | 16223 | 0.000 | 0.002 | 0.021 |
| article prepare | 00:00:00.009 | 0.0% | 127496 | 0.000 | 0.000 | 0.002 |
| article read | 00:00:00.710 | 0.0% | 16041 | 0.000 | 0.044 | 0.706 |
| backlog stats | 00:00:00.024 | 0.0% | 73164 | 0.000 | 0.000 | 0.004 |
| callbacks | 00:00:00.000 | 0.0% | 0 | 0.000 | 0.000 | 0.000 |
| data read | 00:00:00.394 | 0.0% | 50345 | 0.000 | 0.008 | 0.026 |
| data write | 00:00:00.728 | 0.0% | 34487 | 0.000 | 0.021 | 0.047 |
| idle | 23:57:12.037 | 100.0% | 73164 | 296.250 | 1178.613 | 2600.758 |
| status file | 00:00:00.228 | 0.0% | 241 | 0.000 | 0.946 | 115.000 |
| TOTAL: 23:57:15.234 | 23:57:14.159 | 100.0% | - | - | - | - |
nnrpd timer:
| Code region | Time | Pct | Invoked | Min(ms) | Avg(ms) | Max(ms) |
|---|---|---|---|---|---|---|
| idle | 00:00:00.162 | 25.7% | 2 | 81.000 | 81.000 | 81.000 |
| newnews | 00:00:00.000 | 0.0% | 0 | 0.000 | 0.000 | 0.000 |
| nntpwrite | 00:00:00.000 | 0.0% | 11 | 0.000 | 0.000 | 0.000 |
| TOTAL: 00:00:00.630 | 00:00:00.162 | 25.7% | - | - | - | - |
Control commands to INND:
| Command | Number |
|---|---|
| L | 1 |
| flush | 3 |
| flushlogs | 2 |
| go | 2 |
| logmode | 2 |
| mode | 149 |
| name | 2 |
| pause | 2 |
| paused | 2 |
| reload | 4 |
| reserve | 2 |
| TOTAL: 11 | 171 |
Control Channel:
| Sender | newgroup | rmgroup | Other | Bad PGP | DoIt | OK |
|---|---|---|---|---|---|---|
| moderator@dana.de | 0 | 0 | 1 | 1 | 0 | 1 |
| TOTAL | 0 | 0 | 1 | 1 | 0 | 1 |
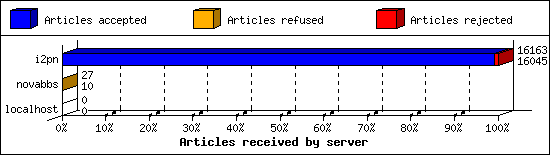
Incoming Feeds (INN):
| Server | Connects | Offered | Taken | Refused | Reject | %Accpt | Elapsed | |
|---|---|---|---|---|---|---|---|---|
| 1 | i2pn | 7 | 16163 | 16045 | 2 | 116 | 99% | 24:42:11 |
| 2 | novabbs | 17 | 27 | 10 | 17 | 0 | 37% | 03:21:16 |
| 3 | localhost | 34 | 0 | 0 | 0 | 0 | 0% | 00:00:00 |
| TOTAL: 3 | 58 | 16190 | 16055 | 19 | 116 | 99% | 28:03:27 | |
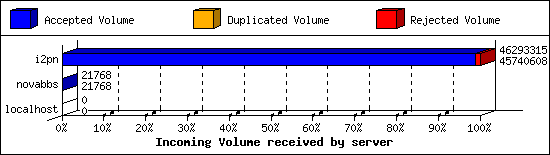
Incoming Volume (INN):
| Server | AcceptVol | DupVol | RejVol | TotalVol | %Acc | Vol/Art | |
|---|---|---|---|---|---|---|---|
| 1 | i2pn | 43.6 MB | 0.0 KB | 539.8 KB | 44.1 MB | 98% | 2.8 KB |
| 2 | novabbs | 21.3 KB | 0.0 KB | 0.0 KB | 21.3 KB | 100% | 2.1 KB |
| 3 | localhost | 0.0 KB | 0.0 KB | 0.0 KB | 0.0 KB | 0% | 0 |
| TOTAL: 3 | 43.6 MB | 0.0 KB | 539.8 KB | 44.2 MB | 98% | 2.8 KB | |
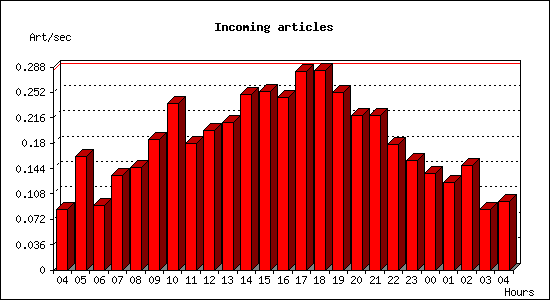
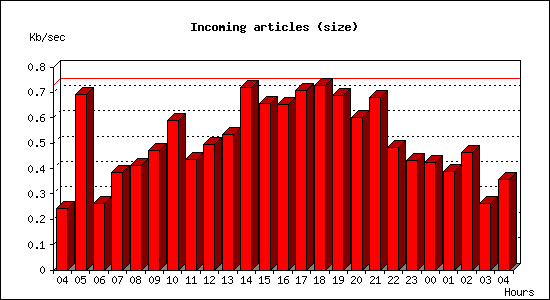
Incoming articles:
| Date | Articles | %Arts | Art/sec | Size | %Size | KB/sec |
|---|---|---|---|---|---|---|
| Mar 2 04:15:02 - 04:59:59 | 231 | 1.4% | 0.09 | 651.7 KB | 1.5% | 0.24 |
| Mar 2 05:00:00 - 05:59:59 | 582 | 3.6% | 0.16 | 2.4 MB | 5.6% | 0.69 |
| Mar 2 06:00:00 - 06:59:59 | 330 | 2.1% | 0.09 | 941.4 KB | 2.1% | 0.26 |
| Mar 2 07:00:00 - 07:59:59 | 481 | 3.0% | 0.13 | 1.3 MB | 3.1% | 0.38 |
| Mar 2 08:00:00 - 08:59:59 | 522 | 3.3% | 0.14 | 1.4 MB | 3.3% | 0.41 |
| Mar 2 09:00:00 - 09:59:59 | 669 | 4.2% | 0.19 | 1.7 MB | 3.8% | 0.47 |
| Mar 2 10:00:00 - 10:59:59 | 851 | 5.3% | 0.24 | 2.1 MB | 4.7% | 0.59 |
| Mar 2 11:00:00 - 11:59:59 | 645 | 4.0% | 0.18 | 1.5 MB | 3.5% | 0.44 |
| Mar 2 12:00:00 - 12:59:59 | 714 | 4.4% | 0.20 | 1.7 MB | 4.0% | 0.49 |
| Mar 2 13:00:00 - 13:59:59 | 752 | 4.7% | 0.21 | 1.9 MB | 4.3% | 0.54 |
| Mar 2 14:00:00 - 14:59:59 | 895 | 5.6% | 0.25 | 2.5 MB | 5.8% | 0.72 |
| Mar 2 15:00:00 - 15:59:59 | 914 | 5.7% | 0.25 | 2.3 MB | 5.3% | 0.66 |
| Mar 2 16:00:00 - 16:59:59 | 879 | 5.5% | 0.24 | 2.3 MB | 5.2% | 0.65 |
| Mar 2 17:00:00 - 17:59:59 | 1015 | 6.3% | 0.28 | 2.5 MB | 5.7% | 0.71 |
| Mar 2 18:00:00 - 18:59:59 | 1019 | 6.3% | 0.28 | 2.6 MB | 5.9% | 0.73 |
| Mar 2 19:00:00 - 19:59:59 | 906 | 5.6% | 0.25 | 2.4 MB | 5.6% | 0.69 |
| Mar 2 20:00:00 - 20:59:59 | 789 | 4.9% | 0.22 | 2.1 MB | 4.8% | 0.60 |
| Mar 2 21:00:00 - 21:59:59 | 789 | 4.9% | 0.22 | 2.4 MB | 5.5% | 0.68 |
| Mar 2 22:00:00 - 22:59:59 | 642 | 4.0% | 0.18 | 1.7 MB | 3.9% | 0.48 |
| Mar 2 23:00:00 - 23:59:59 | 560 | 3.5% | 0.16 | 1.5 MB | 3.5% | 0.43 |
| Mar 3 00:00:00 - 00:59:59 | 495 | 3.1% | 0.14 | 1.5 MB | 3.4% | 0.42 |
| Mar 3 01:00:00 - 01:59:59 | 445 | 2.8% | 0.12 | 1.4 MB | 3.1% | 0.39 |
| Mar 3 02:00:00 - 02:59:59 | 535 | 3.3% | 0.15 | 1.6 MB | 3.7% | 0.46 |
| Mar 3 03:00:00 - 03:59:59 | 307 | 1.9% | 0.09 | 943.9 KB | 2.1% | 0.26 |
| Mar 3 04:00:00 - 04:15:01 | 88 | 0.5% | 0.10 | 321.1 KB | 0.7% | 0.36 |
| TOTAL: 23:59:59 | 16055 | 100.0% | 0.19 | 43.6 MB | 100.0% | 0.52 |
Sites sending bad articles:
| Server | Total | Group | Dist | Duplic | Unapp | TooOld | Site | Line | Other | |
|---|---|---|---|---|---|---|---|---|---|---|
| 1 | i2pn | 447 | 1 | 0 | 0 | 0 | 0 | 0 | 0 | 446 |
| TOTAL: 1 | 447 | 1 | 0 | 0 | 0 | 0 | 0 | 0 | 446 | |
Unwanted newsgroups [Top 20]:
| Newsgroup | Count |
|---|---|
| mozilla.dev.super-review | 1 |
| TOTAL: 1 | 1 |
INND Perl filter [Top 20]:
| Reason | Count |
|---|---|
| Scoring filter (s5) | 89 |
| Scoring filter (s6) | 23 |
| Scoring filter (n4) | 2 |
| Scoring filter (n6) | 1 |
| TOTAL: 4 | 115 |
NoCeM on Spool:
| Id | Good | Bad | Unique | Total |
|---|---|---|---|---|
| bleachbot@httrack.com | 60 | 0 | 63 | 63 |
| TOTAL: 1 | 60 | 0 | 63 | 63 |
Miscellaneous innd statistics [Top 10]:
| Event | Server | Number |
|---|---|---|
| Including strange strings | ||
| i2pn | 331 | |
| TOTAL: 1 | 331 | |
| TOTAL: 1 | 331 | |
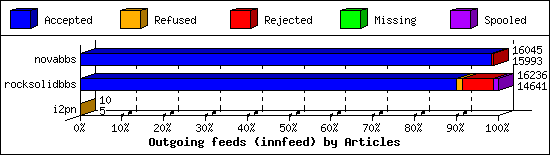
Outgoing Feeds (innfeed) by Articles:
| Server | Offered | Taken | Refused | Reject | Miss | Spool | %Took | Elapsed | |
|---|---|---|---|---|---|---|---|---|---|
| 1 | novabbs | 16050 | 15993 | 4 | 48 | 0 | 0 | 99% | 23:59:57 |
| 2 | rocksolidbbs | 16089 | 14641 | 218 | 1196 | 0 | 181 | 91% | 23:59:57 |
| 3 | i2pn | 10 | 5 | 5 | 0 | 0 | 0 | 50% | 01:35:07 |
| TOTAL: 3 | 32149 | 30639 | 227 | 1244 | 0 | 181 | 95% | 49:35:01 | |
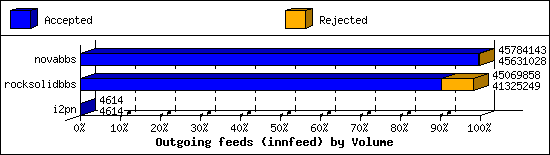
Outgoing Feeds (innfeed) by Volume:
| Server | AcceptVol | RejectVol | TotalVol | Volume/sec | Vol/Art | Elapsed | |
|---|---|---|---|---|---|---|---|
| 1 | novabbs | 43.5 MB | 149.5 KB | 43.7 MB | 0.5 KB/s | 2.8 KB | 23:59:57 |
| 2 | rocksolidbbs | 39.4 MB | 3.6 MB | 43.0 MB | 0.5 KB/s | 2.8 KB | 23:59:57 |
| 3 | i2pn | 4.5 KB | 0.0 KB | 4.5 KB | 0.0 KB/s | 0.9 KB | 01:35:07 |
| TOTAL: 3 | 82.9 MB | 3.7 MB | 86.6 MB | 0.5 KB/s | 2.8 KB | 49:35:01 | |
NNRP readership statistics:
| System | Conn | Arts | Size | Groups | Post | Rej | Elapsed | |
|---|---|---|---|---|---|---|---|---|
| 1 | scan-141.security.ipip.net | 1 | 0 | 0.0 KB | 0 | 0 | 0 | 00:00:00 |
| TOTAL: 1 | 1 | 0 | 0.0 KB | 0 | 0 | 0 | 00:00:00 | |
NNRP readership statistics (by domain):
| System | Conn | Arts | Size | Groups | Post | Rej | Elapsed | |
|---|---|---|---|---|---|---|---|---|
| 1 | *.security.ipip.net | 1 | 0 | 0.0 KB | 0 | 0 | 0 | 00:00:00 |
| TOTAL: 1 | 1 | 0 | 0.0 KB | 0 | 0 | 0 | 00:00:00 | |
NNRP total resource statistics [Top 20]:
| System | User(ms) | System(ms) | Idle(ms) | Elapsed |
|---|---|---|---|---|
| scan-141.security.ipip.net | 0.060 | 0.004 | 0.000 | 00:00:00 |
| TOTAL: 1 | 0.060 | 0.004 | 0.000 | 00:00:00 |
NNRP unrecognized commands (by host):
| System | Conn |
|---|---|
| scan-141.security.ipip.net | 4 |
| TOTAL: 1 | 4 |
NNRP unrecognized commands (by command):
| Command | Count |
|---|---|
| GET / HTTP/1.1 | 1 |
| Host: 157.230.63.40:119 | 1 |
| Connection: close | 1 |
| User-Agent: HTTP Banner Detection (https... | 1 |
| TOTAL: 4 | 4 |
