Log entries by program:
| Program name | Lines | %Lines | Size | %Size |
|---|---|---|---|---|
| inn | 17426 | 87.4% | 1.7 MB | 83.2% |
| innd | 1417 | 7.1% | 207.7 KB | 10.2% |
| innfeed | 1016 | 5.1% | 123.7 KB | 6.1% |
| nocem | 74 | 0.4% | 8.4 KB | 0.4% |
| nnrpd | 4 | 0.0% | 0.5 KB | 0.0% |
| controlchan | 2 | 0.0% | 0.1 KB | 0.0% |
| TOTAL: 6 | 19939 | 100.0% | 2.0 MB | 100.0% |
History cache:
| Reason | Count | %Count |
|---|---|---|
| Do not exist | 16912 | 97.0% |
| Negative hits | 363 | 2.1% |
| Positive hits | 144 | 0.8% |
| Cache misses | 25 | 0.1% |
| TOTAL: 4 | 17444 | 100.0% |
INND timer:
| Code region | Time | Pct | Invoked | Min(ms) | Avg(ms) | Max(ms) |
|---|---|---|---|---|---|---|
| article cancel | 00:00:00.060 | 0.0% | 170 | 0.000 | 0.353 | 7.333 |
| article cleanup | 00:00:00.083 | 0.0% | 16945 | 0.000 | 0.005 | 0.026 |
| article logging | 00:00:00.441 | 0.0% | 17256 | 0.000 | 0.026 | 0.096 |
| article parse | 00:00:00.264 | 0.0% | 19403 | 0.000 | 0.014 | 0.047 |
| article write | 00:00:02.946 | 0.0% | 16809 | 0.051 | 0.175 | 2.438 |
| artlog/artcncl | 00:00:00.003 | 0.0% | 137 | 0.000 | 0.022 | 0.333 |
| data move | 00:00:00.008 | 0.0% | 21999 | 0.000 | 0.000 | 0.009 |
| hisgrep/artcncl | 00:00:00.002 | 0.0% | 159 | 0.000 | 0.013 | 0.167 |
| hishave/artcncl | 00:00:00.001 | 0.0% | 170 | 0.000 | 0.006 | 0.125 |
| history grep | 00:00:00.000 | 0.0% | 0 | 0.000 | 0.000 | 0.000 |
| history lookup | 00:00:00.054 | 0.0% | 17321 | 0.000 | 0.003 | 0.033 |
| history sync | 00:00:00.006 | 0.0% | 419 | 0.000 | 0.014 | 0.333 |
| history write | 00:00:00.509 | 0.0% | 16943 | 0.000 | 0.030 | 0.077 |
| hiswrite/artcncl | 00:00:00.000 | 0.0% | 11 | 0.000 | 0.000 | 0.000 |
| idle | 24:00:45.370 | 100.0% | 20298 | 2272.000 | 4258.812 | 12512.583 |
| nntp read | 00:00:00.481 | 0.0% | 19933 | 0.000 | 0.024 | 0.078 |
| overview write | 00:00:02.091 | 0.0% | 16809 | 0.000 | 0.124 | 3.392 |
| perl filter | 00:00:09.944 | 0.0% | 16943 | 0.442 | 0.587 | 0.938 |
| python filter | 00:00:00.000 | 0.0% | 0 | 0.000 | 0.000 | 0.000 |
| site send | 00:00:00.773 | 0.0% | 16874 | 0.000 | 0.046 | 0.103 |
| TOTAL: 24:01:05.870 | 24:01:03.036 | 100.0% | - | - | - | - |
INNfeed timer:
| Code region | Time | Pct | Invoked | Min(ms) | Avg(ms) | Max(ms) |
|---|---|---|---|---|---|---|
| article new | 00:00:00.031 | 0.0% | 16769 | 0.000 | 0.002 | 0.019 |
| article prepare | 00:00:00.013 | 0.0% | 133968 | 0.000 | 0.000 | 0.002 |
| article read | 00:00:00.616 | 0.0% | 16758 | 0.000 | 0.037 | 0.550 |
| backlog stats | 00:00:00.023 | 0.0% | 75550 | 0.000 | 0.000 | 0.004 |
| callbacks | 00:00:00.000 | 0.0% | 0 | 0.000 | 0.000 | 0.000 |
| data read | 00:00:00.287 | 0.0% | 52284 | 0.000 | 0.005 | 0.022 |
| data write | 00:00:00.612 | 0.0% | 35550 | 0.000 | 0.017 | 0.043 |
| idle | 23:49:06.176 | 100.0% | 75550 | 470.451 | 1134.959 | 3127.865 |
| status file | 00:00:00.107 | 0.0% | 278 | 0.000 | 0.385 | 1.000 |
| TOTAL: 23:49:08.817 | 23:49:07.865 | 100.0% | - | - | - | - |
nnrpd timer:
| Code region | Time | Pct | Invoked | Min(ms) | Avg(ms) | Max(ms) |
|---|---|---|---|---|---|---|
| idle | 00:00:09.743 | 98.2% | 1 | 9743.000 | 9743.000 | 9743.000 |
| newnews | 00:00:00.000 | 0.0% | 0 | 0.000 | 0.000 | 0.000 |
| nntpwrite | 00:00:00.000 | 0.0% | 2 | 0.000 | 0.000 | 0.000 |
| TOTAL: 00:00:09.925 | 00:00:09.743 | 98.2% | - | - | - | - |
Control commands to INND:
| Command | Number |
|---|---|
| L | 1 |
| flush | 3 |
| flushlogs | 2 |
| go | 2 |
| logmode | 2 |
| mode | 149 |
| name | 2 |
| pause | 2 |
| paused | 2 |
| reload | 2 |
| reserve | 2 |
| shutdown | 3 |
| TOTAL: 12 | 172 |
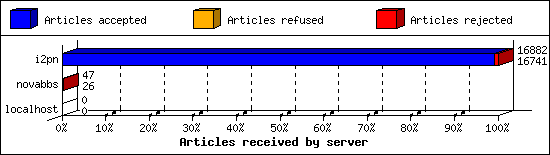
Incoming Feeds (INN):
| Server | Connects | Offered | Taken | Refused | Reject | %Accpt | Elapsed | |
|---|---|---|---|---|---|---|---|---|
| 1 | i2pn | 14 | 16882 | 16741 | 6 | 135 | 99% | 25:05:56 |
| 2 | novabbs | 21 | 47 | 26 | 20 | 1 | 55% | 04:28:40 |
| 3 | localhost | 34 | 0 | 0 | 0 | 0 | 0% | 00:00:00 |
| TOTAL: 3 | 69 | 16929 | 16767 | 26 | 136 | 99% | 29:34:36 | |
Incoming Volume (INN):
| Server | AcceptVol | DupVol | RejVol | TotalVol | %Acc | Vol/Art | |
|---|---|---|---|---|---|---|---|
| 1 | i2pn | 46.4 MB | 6.4 KB | 1.1 MB | 47.5 MB | 97% | 2.9 KB |
| 2 | novabbs | 109.6 KB | 0.0 KB | 3.6 KB | 113.2 KB | 96% | 4.2 KB |
| 3 | localhost | 0.0 KB | 0.0 KB | 0.0 KB | 0.0 KB | 0% | 0 |
| TOTAL: 3 | 46.5 MB | 6.4 KB | 1.1 MB | 47.6 MB | 97% | 2.9 KB | |

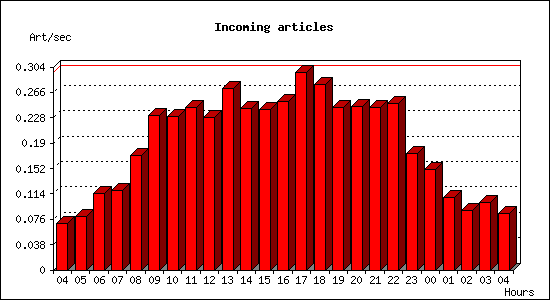
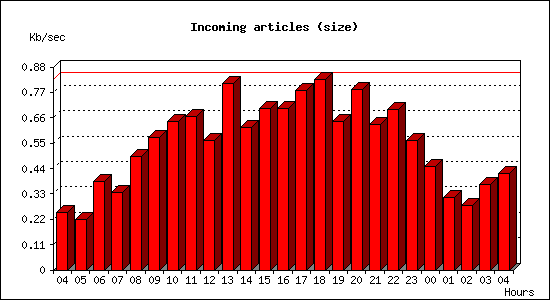
Incoming articles:
| Date | Articles | %Arts | Art/sec | Size | %Size | KB/sec |
|---|---|---|---|---|---|---|
| Mar 10 04:15:01 - 04:59:59 | 186 | 1.1% | 0.07 | 669.0 KB | 1.4% | 0.25 |
| Mar 10 05:00:00 - 05:59:59 | 287 | 1.7% | 0.08 | 781.2 KB | 1.6% | 0.22 |
| Mar 10 06:00:00 - 06:59:59 | 411 | 2.4% | 0.11 | 1.3 MB | 2.9% | 0.38 |
| Mar 10 07:00:00 - 07:59:59 | 431 | 2.6% | 0.12 | 1.2 MB | 2.5% | 0.34 |
| Mar 10 08:00:00 - 08:59:59 | 615 | 3.7% | 0.17 | 1.7 MB | 3.7% | 0.49 |
| Mar 10 09:00:00 - 09:59:59 | 835 | 5.0% | 0.23 | 2.0 MB | 4.3% | 0.57 |
| Mar 10 10:00:00 - 10:59:59 | 829 | 4.9% | 0.23 | 2.3 MB | 4.8% | 0.64 |
| Mar 10 11:00:00 - 11:59:59 | 875 | 5.2% | 0.24 | 2.3 MB | 5.0% | 0.67 |
| Mar 10 12:00:00 - 12:59:59 | 823 | 4.9% | 0.23 | 2.0 MB | 4.2% | 0.56 |
| Mar 10 13:00:00 - 13:59:59 | 980 | 5.8% | 0.27 | 2.8 MB | 6.1% | 0.81 |
| Mar 10 14:00:00 - 14:59:59 | 872 | 5.2% | 0.24 | 2.2 MB | 4.6% | 0.62 |
| Mar 10 15:00:00 - 15:59:59 | 866 | 5.1% | 0.24 | 2.5 MB | 5.3% | 0.70 |
| Mar 10 16:00:00 - 16:59:59 | 906 | 5.4% | 0.25 | 2.5 MB | 5.3% | 0.70 |
| Mar 10 17:00:00 - 17:59:59 | 1067 | 6.3% | 0.30 | 2.7 MB | 5.8% | 0.78 |
| Mar 10 18:00:00 - 18:59:59 | 1002 | 5.9% | 0.28 | 2.9 MB | 6.2% | 0.82 |
| Mar 10 19:00:00 - 19:59:59 | 876 | 5.2% | 0.24 | 2.3 MB | 4.8% | 0.64 |
| Mar 10 20:00:00 - 20:59:59 | 879 | 5.2% | 0.24 | 2.8 MB | 5.9% | 0.78 |
| Mar 10 21:00:00 - 21:59:59 | 878 | 5.2% | 0.24 | 2.2 MB | 4.7% | 0.63 |
| Mar 10 22:00:00 - 22:59:59 | 899 | 5.3% | 0.25 | 2.4 MB | 5.2% | 0.69 |
| Mar 10 23:00:00 - 23:59:59 | 628 | 3.7% | 0.17 | 2.0 MB | 4.2% | 0.56 |
| Mar 11 00:00:00 - 00:59:59 | 544 | 3.2% | 0.15 | 1.6 MB | 3.4% | 0.45 |
| Mar 11 01:00:00 - 01:59:59 | 392 | 2.3% | 0.11 | 1.1 MB | 2.4% | 0.31 |
| Mar 11 02:00:00 - 02:59:59 | 323 | 1.9% | 0.09 | 1013.9 KB | 2.1% | 0.28 |
| Mar 11 03:00:00 - 03:59:59 | 363 | 2.2% | 0.10 | 1.3 MB | 2.8% | 0.37 |
| Mar 11 04:00:00 - 04:15:01 | 76 | 0.5% | 0.08 | 377.1 KB | 0.8% | 0.42 |
| TOTAL: 24:00:00 | 16843 | 100.0% | 0.19 | 46.8 MB | 100.0% | 0.56 |
Sites sending bad articles:
| Server | Total | Group | Dist | Duplic | Unapp | TooOld | Site | Line | Other | |
|---|---|---|---|---|---|---|---|---|---|---|
| 1 | i2pn | 445 | 1 | 0 | 2 | 0 | 0 | 0 | 0 | 442 |
| 2 | novabbs | 1 | 0 | 0 | 0 | 0 | 0 | 0 | 0 | 1 |
| TOTAL: 2 | 446 | 1 | 0 | 2 | 0 | 0 | 0 | 0 | 443 | |
Unwanted newsgroups [Top 20]:
| Newsgroup | Count |
|---|---|
| hk.politics | 1 |
| TOTAL: 1 | 1 |
INND Perl filter [Top 20]:
| Reason | Count |
|---|---|
| Scoring filter (s5) | 79 |
| Scoring filter (s6) | 30 |
| Scoring filter (n4) | 10 |
| Scoring filter (s1) | 10 |
| EMP (md5) | 2 |
| Scoring filter (n6) | 1 |
| TOTAL: 6 | 132 |
NoCeM on Spool:
| Id | Good | Bad | Unique | Total |
|---|---|---|---|---|
| bleachbot@httrack.com | 65 | 0 | 65 | 65 |
| TOTAL: 1 | 65 | 0 | 65 | 65 |
Miscellaneous innd statistics [Top 10]:
| Event | Server | Number |
|---|---|---|
| Including strange strings | ||
| i2pn | 311 | |
| TOTAL: 1 | 311 | |
| TOTAL: 1 | 311 | |
Outgoing Feeds (innfeed) by Articles:
| Server | Offered | Taken | Refused | Reject | Miss | Spool | %Took | Elapsed | |
|---|---|---|---|---|---|---|---|---|---|
| 1 | novabbs | 16824 | 16759 | 8 | 50 | 0 | 2 | 99% | 23:59:51 |
| 2 | rocksolidbbs | 16850 | 15789 | 9 | 1045 | 0 | 0 | 93% | 23:59:51 |
| 3 | i2pn | 29 | 1 | 25 | 0 | 0 | 0 | 3% | 02:51:37 |
| TOTAL: 3 | 33703 | 32549 | 42 | 1095 | 0 | 2 | 96% | 50:51:19 | |

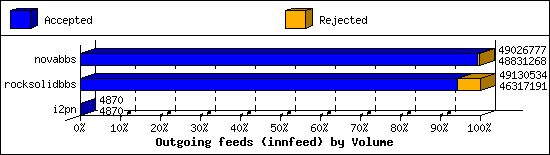
Outgoing Feeds (innfeed) by Volume:
| Server | AcceptVol | RejectVol | TotalVol | Volume/sec | Vol/Art | Elapsed | |
|---|---|---|---|---|---|---|---|
| 1 | novabbs | 46.6 MB | 190.9 KB | 46.8 MB | 0.6 KB/s | 2.8 KB | 23:59:51 |
| 2 | rocksolidbbs | 44.2 MB | 2.7 MB | 46.9 MB | 0.6 KB/s | 2.9 KB | 23:59:51 |
| 3 | i2pn | 4.8 KB | 0.0 KB | 4.8 KB | 0.0 KB/s | 4.8 KB | 02:51:37 |
| TOTAL: 3 | 90.7 MB | 2.9 MB | 93.6 MB | 0.5 KB/s | 2.8 KB | 50:51:19 | |
NNRP readership statistics:
| System | Conn | Arts | Size | Groups | Post | Rej | Elapsed | |
|---|---|---|---|---|---|---|---|---|
| 1 | 107.170.238.113 | 1 | 0 | 0.0 KB | 0 | 0 | 0 | 00:00:09 |
| TOTAL: 1 | 1 | 0 | 0.0 KB | 0 | 0 | 0 | 00:00:09 | |
NNRP readership statistics (by domain):
| System | Conn | Arts | Size | Groups | Post | Rej | Elapsed | |
|---|---|---|---|---|---|---|---|---|
| 1 | unresolved | 1 | 0 | 0.0 KB | 0 | 0 | 0 | 00:00:09 |
| TOTAL: 1 | 1 | 0 | 0.0 KB | 0 | 0 | 0 | 00:00:09 | |
NNRP total resource statistics [Top 20]:
| System | User(ms) | System(ms) | Idle(ms) | Elapsed |
|---|---|---|---|---|
| 107.170.238.113 | 0.040 | 0.004 | 0.000 | 00:00:09 |
| TOTAL: 1 | 0.040 | 0.004 | 0.000 | 00:00:09 |
