Log entries by program:
| Program name | Lines | %Lines | Size | %Size |
|---|---|---|---|---|
| inn | 17306 | 86.0% | 1.6 MB | 81.5% |
| innd | 1544 | 7.7% | 223.0 KB | 10.8% |
| innfeed | 1171 | 5.8% | 146.6 KB | 7.1% |
| nocem | 77 | 0.4% | 9.1 KB | 0.4% |
| nnrpd | 17 | 0.1% | 1.8 KB | 0.1% |
| controlchan | 2 | 0.0% | 0.2 KB | 0.0% |
| TOTAL: 6 | 20117 | 100.0% | 2.0 MB | 100.0% |
History cache:
| Reason | Count | %Count |
|---|---|---|
| Do not exist | 16667 | 95.4% |
| Negative hits | 568 | 3.3% |
| Positive hits | 195 | 1.1% |
| Cache misses | 37 | 0.2% |
| TOTAL: 4 | 17467 | 100.0% |
INND timer:
| Code region | Time | Pct | Invoked | Min(ms) | Avg(ms) | Max(ms) |
|---|---|---|---|---|---|---|
| article cancel | 00:00:00.058 | 0.0% | 198 | 0.000 | 0.293 | 2.300 |
| article cleanup | 00:00:00.080 | 0.0% | 16692 | 0.000 | 0.005 | 0.039 |
| article logging | 00:00:00.433 | 0.0% | 17097 | 0.000 | 0.025 | 0.071 |
| article parse | 00:00:00.241 | 0.0% | 18983 | 0.000 | 0.013 | 0.058 |
| article write | 00:00:02.403 | 0.0% | 16483 | 0.036 | 0.146 | 1.234 |
| artlog/artcncl | 00:00:00.001 | 0.0% | 165 | 0.000 | 0.006 | 0.062 |
| artlog/artwrite | 00:00:00.000 | 0.0% | 9 | 0.000 | 0.000 | 0.000 |
| data move | 00:00:00.011 | 0.0% | 21421 | 0.000 | 0.001 | 0.020 |
| hisgrep/artcncl | 00:00:00.005 | 0.0% | 163 | 0.000 | 0.031 | 0.333 |
| hishave/artcncl | 00:00:00.001 | 0.0% | 198 | 0.000 | 0.005 | 0.062 |
| history grep | 00:00:00.000 | 0.0% | 0 | 0.000 | 0.000 | 0.000 |
| history lookup | 00:00:00.066 | 0.0% | 17338 | 0.000 | 0.004 | 0.046 |
| history sync | 00:00:00.017 | 0.0% | 421 | 0.000 | 0.040 | 0.667 |
| history write | 00:00:00.528 | 0.0% | 16682 | 0.000 | 0.032 | 0.156 |
| hiswrite/artcncl | 00:00:00.001 | 0.0% | 35 | 0.000 | 0.029 | 0.143 |
| idle | 24:00:50.254 | 100.0% | 20194 | 1948.896 | 4280.987 | 12246.714 |
| nntp read | 00:00:00.445 | 0.0% | 19815 | 0.000 | 0.022 | 0.060 |
| overview write | 00:00:01.658 | 0.0% | 16474 | 0.000 | 0.101 | 0.960 |
| perl filter | 00:00:09.884 | 0.0% | 16691 | 0.437 | 0.592 | 0.797 |
| python filter | 00:00:00.000 | 0.0% | 0 | 0.000 | 0.000 | 0.000 |
| site send | 00:00:00.239 | 0.0% | 16545 | 0.000 | 0.014 | 0.087 |
| TOTAL: 24:01:08.833 | 24:01:06.325 | 100.0% | - | - | - | - |
INNfeed timer:
| Code region | Time | Pct | Invoked | Min(ms) | Avg(ms) | Max(ms) |
|---|---|---|---|---|---|---|
| article new | 00:00:00.029 | 0.0% | 16546 | 0.000 | 0.002 | 0.018 |
| article prepare | 00:00:00.016 | 0.0% | 131184 | 0.000 | 0.000 | 0.002 |
| article read | 00:00:00.626 | 0.0% | 16497 | 0.000 | 0.038 | 0.447 |
| backlog stats | 00:00:00.025 | 0.0% | 75448 | 0.000 | 0.000 | 0.007 |
| callbacks | 00:00:00.000 | 0.0% | 0 | 0.000 | 0.000 | 0.000 |
| data read | 00:00:00.265 | 0.0% | 52000 | 0.000 | 0.005 | 0.017 |
| data write | 00:00:00.549 | 0.0% | 35584 | 0.000 | 0.015 | 0.037 |
| idle | 23:57:56.398 | 100.0% | 75448 | 516.753 | 1143.521 | 3640.309 |
| status file | 00:00:00.227 | 0.0% | 355 | 0.000 | 0.639 | 6.400 |
| TOTAL: 23:57:59.139 | 23:57:58.135 | 100.0% | - | - | - | - |
nnrpd timer:
| Code region | Time | Pct | Invoked | Min(ms) | Avg(ms) | Max(ms) |
|---|---|---|---|---|---|---|
| idle | 00:00:15.800 | 83.0% | 6 | 83.000 | 2633.333 | 9841.000 |
| newnews | 00:00:00.000 | 0.0% | 0 | 0.000 | 0.000 | 0.000 |
| nntpwrite | 00:00:00.651 | 3.4% | 42542 | 0.000 | 0.015 | 0.015 |
| TOTAL: 00:00:19.030 | 00:00:16.451 | 86.4% | - | - | - | - |
Control commands to INND:
| Command | Number |
|---|---|
| L | 1 |
| flush | 3 |
| flushlogs | 2 |
| go | 2 |
| logmode | 2 |
| mode | 149 |
| name | 2 |
| pause | 2 |
| paused | 2 |
| reload | 2 |
| reserve | 2 |
| shutdown | 3 |
| TOTAL: 12 | 172 |
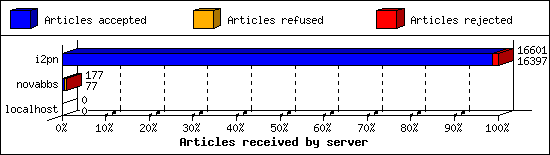
Incoming Feeds (INN):
| Server | Connects | Offered | Taken | Refused | Reject | %Accpt | Elapsed | |
|---|---|---|---|---|---|---|---|---|
| 1 | i2pn | 11 | 16601 | 16397 | 1 | 203 | 98% | 24:56:19 |
| 2 | novabbs | 39 | 177 | 77 | 85 | 15 | 43% | 10:09:30 |
| 3 | localhost | 30 | 0 | 0 | 0 | 0 | 0% | 00:00:00 |
| TOTAL: 3 | 80 | 16778 | 16474 | 86 | 218 | 98% | 35:05:49 | |
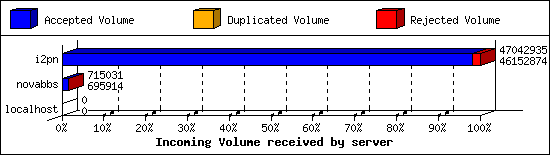
Incoming Volume (INN):
| Server | AcceptVol | DupVol | RejVol | TotalVol | %Acc | Vol/Art | |
|---|---|---|---|---|---|---|---|
| 1 | i2pn | 44.0 MB | 4.2 KB | 865.0 KB | 44.9 MB | 98% | 2.8 KB |
| 2 | novabbs | 679.6 KB | 0.0 KB | 18.7 KB | 698.3 KB | 97% | 7.6 KB |
| 3 | localhost | 0.0 KB | 0.0 KB | 0.0 KB | 0.0 KB | 0% | 0 |
| TOTAL: 3 | 44.7 MB | 4.2 KB | 883.7 KB | 45.5 MB | 98% | 2.8 KB | |
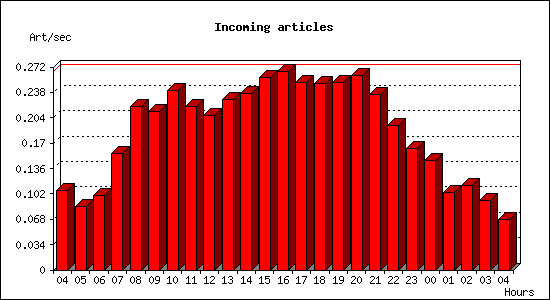
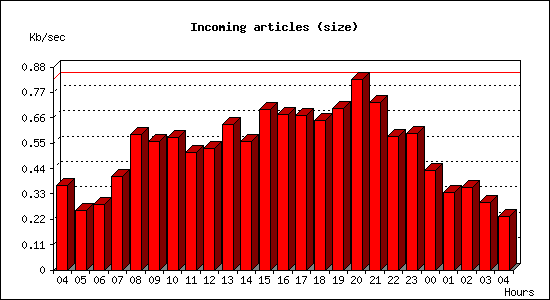
Incoming articles:
| Date | Articles | %Arts | Art/sec | Size | %Size | KB/sec |
|---|---|---|---|---|---|---|
| Mar 16 04:15:01 - 04:59:59 | 287 | 1.7% | 0.11 | 984.0 KB | 2.1% | 0.36 |
| Mar 16 05:00:00 - 05:59:59 | 306 | 1.9% | 0.09 | 927.7 KB | 2.0% | 0.26 |
| Mar 16 06:00:00 - 06:59:59 | 358 | 2.2% | 0.10 | 1.0 MB | 2.2% | 0.28 |
| Mar 16 07:00:00 - 07:59:59 | 562 | 3.4% | 0.16 | 1.4 MB | 3.2% | 0.41 |
| Mar 16 08:00:00 - 08:59:59 | 788 | 4.8% | 0.22 | 2.1 MB | 4.6% | 0.59 |
| Mar 16 09:00:00 - 09:59:59 | 766 | 4.6% | 0.21 | 2.0 MB | 4.4% | 0.56 |
| Mar 16 10:00:00 - 10:59:59 | 866 | 5.2% | 0.24 | 2.0 MB | 4.5% | 0.57 |
| Mar 16 11:00:00 - 11:59:59 | 787 | 4.8% | 0.22 | 1.8 MB | 4.0% | 0.51 |
| Mar 16 12:00:00 - 12:59:59 | 747 | 4.5% | 0.21 | 1.9 MB | 4.1% | 0.53 |
| Mar 16 13:00:00 - 13:59:59 | 823 | 5.0% | 0.23 | 2.2 MB | 4.9% | 0.63 |
| Mar 16 14:00:00 - 14:59:59 | 849 | 5.1% | 0.24 | 2.0 MB | 4.4% | 0.56 |
| Mar 16 15:00:00 - 15:59:59 | 929 | 5.6% | 0.26 | 2.4 MB | 5.5% | 0.70 |
| Mar 16 16:00:00 - 16:59:59 | 956 | 5.8% | 0.27 | 2.4 MB | 5.3% | 0.67 |
| Mar 16 17:00:00 - 17:59:59 | 905 | 5.5% | 0.25 | 2.4 MB | 5.3% | 0.67 |
| Mar 16 18:00:00 - 18:59:59 | 899 | 5.4% | 0.25 | 2.3 MB | 5.1% | 0.65 |
| Mar 16 19:00:00 - 19:59:59 | 905 | 5.5% | 0.25 | 2.5 MB | 5.5% | 0.70 |
| Mar 16 20:00:00 - 20:59:59 | 936 | 5.7% | 0.26 | 2.9 MB | 6.5% | 0.83 |
| Mar 16 21:00:00 - 21:59:59 | 846 | 5.1% | 0.23 | 2.6 MB | 5.7% | 0.73 |
| Mar 16 22:00:00 - 22:59:59 | 699 | 4.2% | 0.19 | 2.0 MB | 4.5% | 0.58 |
| Mar 16 23:00:00 - 23:59:59 | 587 | 3.6% | 0.16 | 2.1 MB | 4.7% | 0.59 |
| Mar 17 00:00:00 - 00:59:59 | 526 | 3.2% | 0.15 | 1.5 MB | 3.4% | 0.43 |
| Mar 17 01:00:00 - 01:59:59 | 374 | 2.3% | 0.10 | 1.2 MB | 2.6% | 0.33 |
| Mar 17 02:00:00 - 02:59:59 | 408 | 2.5% | 0.11 | 1.3 MB | 2.8% | 0.36 |
| Mar 17 03:00:00 - 03:59:59 | 334 | 2.0% | 0.09 | 1.0 MB | 2.3% | 0.29 |
| Mar 17 04:00:00 - 04:15:01 | 61 | 0.4% | 0.07 | 208.8 KB | 0.5% | 0.23 |
| TOTAL: 24:00:00 | 16504 | 100.0% | 0.19 | 44.8 MB | 100.0% | 0.53 |
Sites sending bad articles:
| Server | Total | Group | Dist | Duplic | Unapp | TooOld | Site | Line | Other | |
|---|---|---|---|---|---|---|---|---|---|---|
| 1 | i2pn | 622 | 2 | 0 | 1 | 0 | 0 | 0 | 0 | 619 |
| 2 | novabbs | 15 | 0 | 0 | 0 | 0 | 0 | 0 | 0 | 15 |
| TOTAL: 2 | 637 | 2 | 0 | 1 | 0 | 0 | 0 | 0 | 634 | |
Unwanted newsgroups [Top 20]:
| Newsgroup | Count |
|---|---|
| alt.2600 | 2 |
| TOTAL: 1 | 2 |
INND Perl filter [Top 20]:
| Reason | Count |
|---|---|
| Scoring filter (s5) | 142 |
| Scoring filter (s6) | 32 |
| EMP (phl) | 15 |
| Scoring filter (n4) | 12 |
| Scoring filter (s1) | 5 |
| TOTAL: 5 | 206 |
NoCeM on Spool:
| Id | Good | Bad | Unique | Total |
|---|---|---|---|---|
| bleachbot@httrack.com | 71 | 0 | 83 | 83 |
| TOTAL: 1 | 71 | 0 | 83 | 83 |
Miscellaneous innd statistics [Top 10]:
| Event | Server | Number |
|---|---|---|
| Including strange strings | ||
| i2pn | 419 | |
| TOTAL: 1 | 419 | |
| TOTAL: 1 | 419 | |
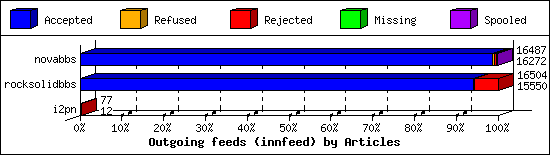
Outgoing Feeds (innfeed) by Articles:
| Server | Offered | Taken | Refused | Reject | Miss | Spool | %Took | Elapsed | |
|---|---|---|---|---|---|---|---|---|---|
| 1 | novabbs | 16465 | 16272 | 111 | 44 | 0 | 60 | 98% | 23:59:43 |
| 2 | rocksolidbbs | 16517 | 15550 | 16 | 938 | 0 | 0 | 94% | 23:59:51 |
| 3 | i2pn | 78 | 12 | 64 | 1 | 0 | 0 | 15% | 06:32:23 |
| TOTAL: 3 | 33060 | 31834 | 191 | 983 | 0 | 60 | 96% | 54:31:57 | |
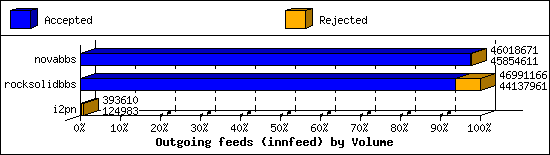
Outgoing Feeds (innfeed) by Volume:
| Server | AcceptVol | RejectVol | TotalVol | Volume/sec | Vol/Art | Elapsed | |
|---|---|---|---|---|---|---|---|
| 1 | novabbs | 43.7 MB | 160.2 KB | 43.9 MB | 0.5 KB/s | 2.8 KB | 23:59:43 |
| 2 | rocksolidbbs | 42.1 MB | 2.7 MB | 44.8 MB | 0.5 KB/s | 2.8 KB | 23:59:51 |
| 3 | i2pn | 122.1 KB | 262.3 KB | 384.4 KB | 0.0 KB/s | 29.6 KB | 06:32:23 |
| TOTAL: 3 | 85.9 MB | 3.1 MB | 89.1 MB | 0.5 KB/s | 2.8 KB | 54:31:57 | |
NNRP readership statistics:
| System | Conn | Arts | Size | Groups | Post | Rej | Elapsed | |
|---|---|---|---|---|---|---|---|---|
| 1 | ip68-2-45-86.ph.ph.cox.net | 2 | 0 | 0.0 KB | 0 | 0 | 0 | 00:00:08 |
| 2 | 107.170.234.235 | 1 | 0 | 0.0 KB | 0 | 0 | 0 | 00:00:09 |
| 3 | scan-141.security.ipip.net | 1 | 0 | 0.0 KB | 0 | 0 | 0 | 00:00:00 |
| TOTAL: 3 | 4 | 0 | 0.0 KB | 0 | 0 | 0 | 00:00:19 | |
NNRP readership statistics (by domain):
| System | Conn | Arts | Size | Groups | Post | Rej | Elapsed | |
|---|---|---|---|---|---|---|---|---|
| 1 | *.ph.ph.cox.net | 2 | 0 | 0.0 KB | 0 | 0 | 0 | 00:00:08 |
| 2 | unresolved | 1 | 0 | 0.0 KB | 0 | 0 | 0 | 00:00:09 |
| 3 | *.security.ipip.net | 1 | 0 | 0.0 KB | 0 | 0 | 0 | 00:00:00 |
| TOTAL: 3 | 4 | 0 | 0.0 KB | 0 | 0 | 0 | 00:00:19 | |
NNRP total resource statistics [Top 20]:
| System | User(ms) | System(ms) | Idle(ms) | Elapsed |
|---|---|---|---|---|
| 107.170.234.235 | 0.064 | 0.004 | 0.000 | 00:00:09 |
| ip68-2-45-86.ph.ph.cox.net | 0.136 | 0.020 | 0.000 | 00:00:08 |
| scan-141.security.ipip.net | 0.040 | 0.004 | 0.000 | 00:00:00 |
| TOTAL: 3 | 0.240 | 0.028 | 0.000 | 00:00:19 |
NNRP unrecognized commands (by host):
| System | Conn |
|---|---|
| scan-141.security.ipip.net | 4 |
| TOTAL: 1 | 4 |
NNRP unrecognized commands (by command):
| Command | Count |
|---|---|
| Host: 157.230.63.40:119 | 1 |
| Connection: close | 1 |
| User-Agent: HTTP Banner Detection (https... | 1 |
| GET / HTTP/1.1 | 1 |
| TOTAL: 4 | 4 |
