Log entries by program:
| Program name | Lines | %Lines | Size | %Size |
|---|---|---|---|---|
| inn | 17891 | 88.5% | 1.7 MB | 84.2% |
| innd | 1367 | 6.8% | 193.7 KB | 9.5% |
| innfeed | 856 | 4.2% | 116.2 KB | 5.7% |
| nocem | 68 | 0.3% | 7.3 KB | 0.4% |
| controlchan | 12 | 0.1% | 2.2 KB | 0.1% |
| nnrpd | 11 | 0.1% | 1.1 KB | 0.1% |
| pgpverify | 1 | 0.0% | 0.2 KB | 0.0% |
| TOTAL: 7 | 20206 | 100.0% | 2.0 MB | 100.0% |
History cache:
| Reason | Count | %Count |
|---|---|---|
| Do not exist | 17313 | 98.3% |
| Negative hits | 173 | 1.0% |
| Positive hits | 98 | 0.6% |
| Cache misses | 25 | 0.1% |
| TOTAL: 4 | 17609 | 100.0% |
INND timer:
| Code region | Time | Pct | Invoked | Min(ms) | Avg(ms) | Max(ms) |
|---|---|---|---|---|---|---|
| article cancel | 00:00:00.026 | 0.0% | 132 | 0.000 | 0.197 | 1.500 |
| article cleanup | 00:00:00.097 | 0.0% | 17315 | 0.000 | 0.006 | 0.043 |
| article logging | 00:00:00.526 | 0.0% | 17801 | 0.000 | 0.030 | 0.077 |
| article parse | 00:00:00.261 | 0.0% | 20127 | 0.000 | 0.013 | 0.057 |
| article write | 00:00:02.431 | 0.0% | 17151 | 0.067 | 0.142 | 0.711 |
| artlog/artcncl | 00:00:00.000 | 0.0% | 89 | 0.000 | 0.000 | 0.000 |
| artlog/artwrite | 00:00:00.000 | 0.0% | 0 | 0.000 | 0.000 | 0.000 |
| data move | 00:00:00.010 | 0.0% | 22769 | 0.000 | 0.000 | 0.014 |
| hisgrep/artcncl | 00:00:00.000 | 0.0% | 123 | 0.000 | 0.000 | 0.000 |
| hishave/artcncl | 00:00:00.000 | 0.0% | 132 | 0.000 | 0.000 | 0.000 |
| history grep | 00:00:00.000 | 0.0% | 0 | 0.000 | 0.000 | 0.000 |
| history lookup | 00:00:00.075 | 0.0% | 17493 | 0.000 | 0.004 | 0.028 |
| history sync | 00:00:00.012 | 0.0% | 306 | 0.000 | 0.039 | 0.500 |
| history write | 00:00:00.556 | 0.0% | 17315 | 0.000 | 0.032 | 0.219 |
| hiswrite/artcncl | 00:00:00.000 | 0.0% | 9 | 0.000 | 0.000 | 0.000 |
| idle | 24:00:01.743 | 100.0% | 20728 | 2083.323 | 4168.359 | 13335.089 |
| nntp read | 00:00:00.521 | 0.0% | 20482 | 0.000 | 0.025 | 0.067 |
| overview write | 00:00:01.857 | 0.0% | 17151 | 0.000 | 0.108 | 2.842 |
| perl filter | 00:00:10.429 | 0.0% | 17315 | 0.439 | 0.602 | 1.024 |
| python filter | 00:00:00.000 | 0.0% | 0 | 0.000 | 0.000 | 0.000 |
| site send | 00:00:00.420 | 0.0% | 17211 | 0.000 | 0.024 | 0.076 |
| TOTAL: 24:00:21.408 | 24:00:18.964 | 100.0% | - | - | - | - |
INNfeed timer:
| Code region | Time | Pct | Invoked | Min(ms) | Avg(ms) | Max(ms) |
|---|---|---|---|---|---|---|
| article new | 00:00:00.021 | 0.0% | 17144 | 0.000 | 0.001 | 0.013 |
| article prepare | 00:00:00.015 | 0.0% | 137128 | 0.000 | 0.000 | 0.002 |
| article read | 00:00:00.640 | 0.0% | 17144 | 0.000 | 0.037 | 0.636 |
| backlog stats | 00:00:00.031 | 0.0% | 76419 | 0.000 | 0.000 | 0.004 |
| callbacks | 00:00:00.000 | 0.0% | 0 | 0.000 | 0.000 | 0.000 |
| data read | 00:00:00.313 | 0.0% | 53248 | 0.000 | 0.006 | 0.030 |
| data write | 00:00:00.567 | 0.0% | 36118 | 0.000 | 0.016 | 0.043 |
| idle | 23:58:53.432 | 100.0% | 76419 | 537.446 | 1129.738 | 3718.744 |
| status file | 00:00:00.076 | 0.0% | 199 | 0.000 | 0.382 | 6.000 |
| TOTAL: 23:58:56.144 | 23:58:55.095 | 100.0% | - | - | - | - |
nnrpd timer:
| Code region | Time | Pct | Invoked | Min(ms) | Avg(ms) | Max(ms) |
|---|---|---|---|---|---|---|
| idle | 00:00:09.931 | 95.2% | 3 | 81.000 | 3310.333 | 9769.000 |
| newnews | 00:00:00.000 | 0.0% | 0 | 0.000 | 0.000 | 0.000 |
| nntpwrite | 00:00:00.000 | 0.0% | 13 | 0.000 | 0.000 | 0.000 |
| TOTAL: 00:00:10.434 | 00:00:09.931 | 95.2% | - | - | - | - |
Control commands to INND:
| Command | Number |
|---|---|
| L | 1 |
| flush | 3 |
| flushlogs | 2 |
| go | 2 |
| logmode | 2 |
| mode | 149 |
| name | 2 |
| pause | 2 |
| paused | 2 |
| reload | 2 |
| reserve | 2 |
| TOTAL: 11 | 169 |
Control Channel:
| Sender | newgroup | rmgroup | Other | Bad PGP | DoIt | OK |
|---|---|---|---|---|---|---|
| ba-mod@panix.com | 0 | 0 | 1 | 1 | 0 | 1 |
| TOTAL | 0 | 0 | 1 | 1 | 0 | 1 |
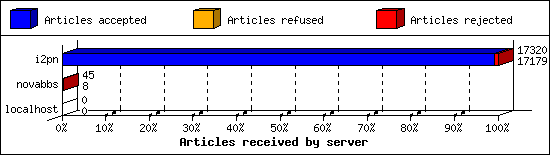
Incoming Feeds (INN):
| Server | Connects | Offered | Taken | Refused | Reject | %Accpt | Elapsed | |
|---|---|---|---|---|---|---|---|---|
| 1 | i2pn | 6 | 17320 | 17179 | 0 | 141 | 99% | 24:45:31 |
| 2 | novabbs | 30 | 45 | 8 | 17 | 20 | 17% | 03:41:02 |
| 3 | localhost | 33 | 0 | 0 | 0 | 0 | 0% | 00:00:00 |
| TOTAL: 3 | 69 | 17365 | 17187 | 17 | 161 | 98% | 28:26:33 | |
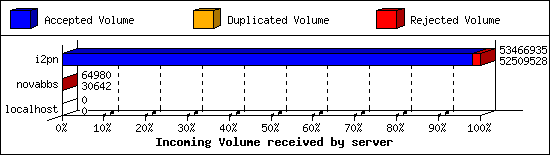
Incoming Volume (INN):
| Server | AcceptVol | DupVol | RejVol | TotalVol | %Acc | Vol/Art | |
|---|---|---|---|---|---|---|---|
| 1 | i2pn | 50.1 MB | 0.0 KB | 935.0 KB | 51.0 MB | 98% | 3.0 KB |
| 2 | novabbs | 29.9 KB | 0.0 KB | 33.5 KB | 63.5 KB | 47% | 2.3 KB |
| 3 | localhost | 0.0 KB | 0.0 KB | 0.0 KB | 0.0 KB | 0% | 0 |
| TOTAL: 3 | 50.1 MB | 0.0 KB | 968.5 KB | 51.1 MB | 98% | 3.0 KB | |
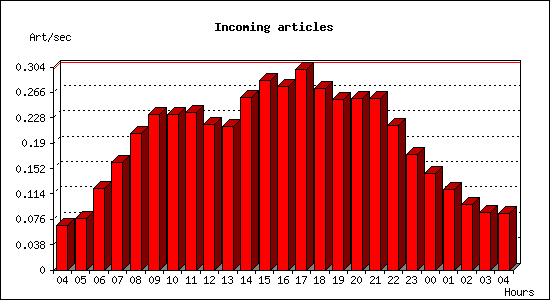
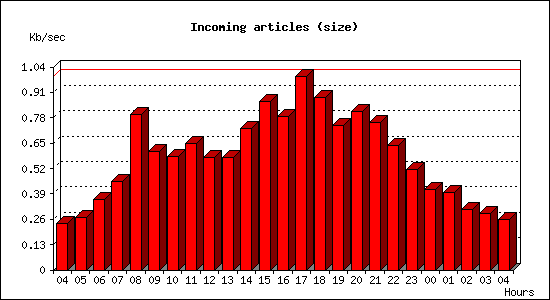
Incoming articles:
| Date | Articles | %Arts | Art/sec | Size | %Size | KB/sec |
|---|---|---|---|---|---|---|
| Mar 22 04:15:01 - 04:59:59 | 178 | 1.0% | 0.07 | 647.3 KB | 1.3% | 0.24 |
| Mar 22 05:00:00 - 05:59:59 | 275 | 1.6% | 0.08 | 974.1 KB | 1.9% | 0.27 |
| Mar 22 06:00:00 - 06:59:59 | 439 | 2.6% | 0.12 | 1.3 MB | 2.5% | 0.36 |
| Mar 22 07:00:00 - 07:59:59 | 580 | 3.4% | 0.16 | 1.6 MB | 3.2% | 0.45 |
| Mar 22 08:00:00 - 08:59:59 | 737 | 4.3% | 0.20 | 2.8 MB | 5.6% | 0.80 |
| Mar 22 09:00:00 - 09:59:59 | 841 | 4.9% | 0.23 | 2.1 MB | 4.3% | 0.61 |
| Mar 22 10:00:00 - 10:59:59 | 839 | 4.9% | 0.23 | 2.1 MB | 4.1% | 0.58 |
| Mar 22 11:00:00 - 11:59:59 | 848 | 4.9% | 0.24 | 2.3 MB | 4.5% | 0.65 |
| Mar 22 12:00:00 - 12:59:59 | 784 | 4.6% | 0.22 | 2.0 MB | 4.1% | 0.58 |
| Mar 22 13:00:00 - 13:59:59 | 771 | 4.5% | 0.21 | 2.0 MB | 4.0% | 0.57 |
| Mar 22 14:00:00 - 14:59:59 | 931 | 5.4% | 0.26 | 2.5 MB | 5.1% | 0.72 |
| Mar 22 15:00:00 - 15:59:59 | 1022 | 6.0% | 0.28 | 3.0 MB | 6.1% | 0.86 |
| Mar 22 16:00:00 - 16:59:59 | 990 | 5.8% | 0.28 | 2.8 MB | 5.5% | 0.78 |
| Mar 22 17:00:00 - 17:59:59 | 1081 | 6.3% | 0.30 | 3.5 MB | 7.0% | 0.99 |
| Mar 22 18:00:00 - 18:59:59 | 979 | 5.7% | 0.27 | 3.1 MB | 6.2% | 0.89 |
| Mar 22 19:00:00 - 19:59:59 | 919 | 5.4% | 0.26 | 2.6 MB | 5.2% | 0.74 |
| Mar 22 20:00:00 - 20:59:59 | 923 | 5.4% | 0.26 | 2.9 MB | 5.7% | 0.81 |
| Mar 22 21:00:00 - 21:59:59 | 927 | 5.4% | 0.26 | 2.6 MB | 5.3% | 0.75 |
| Mar 22 22:00:00 - 22:59:59 | 777 | 4.5% | 0.22 | 2.2 MB | 4.5% | 0.64 |
| Mar 22 23:00:00 - 23:59:59 | 622 | 3.6% | 0.17 | 1.8 MB | 3.6% | 0.51 |
| Mar 23 00:00:00 - 00:59:59 | 519 | 3.0% | 0.14 | 1.5 MB | 2.9% | 0.41 |
| Mar 23 01:00:00 - 01:59:59 | 433 | 2.5% | 0.12 | 1.4 MB | 2.8% | 0.40 |
| Mar 23 02:00:00 - 02:59:59 | 352 | 2.1% | 0.10 | 1.1 MB | 2.2% | 0.31 |
| Mar 23 03:00:00 - 03:59:59 | 309 | 1.8% | 0.09 | 1.0 MB | 2.1% | 0.29 |
| Mar 23 04:00:00 - 04:15:01 | 76 | 0.4% | 0.08 | 234.2 KB | 0.5% | 0.26 |
| TOTAL: 24:00:00 | 17152 | 100.0% | 0.20 | 50.0 MB | 100.0% | 0.59 |
Sites sending bad articles:
| Server | Total | Group | Dist | Duplic | Unapp | TooOld | Site | Line | Other | |
|---|---|---|---|---|---|---|---|---|---|---|
| 1 | i2pn | 630 | 5 | 0 | 0 | 0 | 0 | 0 | 0 | 625 |
| 2 | novabbs | 20 | 20 | 0 | 0 | 0 | 0 | 0 | 0 | 0 |
| TOTAL: 2 | 650 | 25 | 0 | 0 | 0 | 0 | 0 | 0 | 625 | |
Unwanted newsgroups [Top 20]:
| Newsgroup | Count |
|---|---|
| rocksolid2.postman.tracker2 | 20 |
| alt.2600 | 3 |
| lada.politics | 2 |
| TOTAL: 3 | 25 |
INND Perl filter [Top 20]:
| Reason | Count |
|---|---|
| Scoring filter (s5) | 98 |
| Scoring filter (s6) | 28 |
| Scoring filter (s1) | 13 |
| TOTAL: 3 | 139 |
NoCeM on Spool:
| Id | Good | Bad | Unique | Total |
|---|---|---|---|---|
| bleachbot@httrack.com | 59 | 0 | 62 | 62 |
| TOTAL: 1 | 59 | 0 | 62 | 62 |
Miscellaneous innd statistics [Top 10]:
| Event | Server | Number |
|---|---|---|
| Including strange strings | ||
| i2pn | 486 | |
| TOTAL: 1 | 486 | |
| TOTAL: 1 | 486 | |
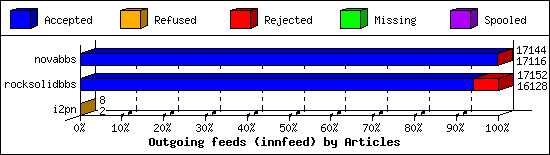
Outgoing Feeds (innfeed) by Articles:
| Server | Offered | Taken | Refused | Reject | Miss | Spool | %Took | Elapsed | |
|---|---|---|---|---|---|---|---|---|---|
| 1 | novabbs | 17145 | 17116 | 0 | 28 | 0 | 0 | 99% | 23:59:58 |
| 2 | rocksolidbbs | 17162 | 16128 | 0 | 1024 | 0 | 0 | 93% | 23:59:58 |
| 3 | i2pn | 8 | 2 | 6 | 0 | 0 | 0 | 25% | 00:58:21 |
| TOTAL: 3 | 34315 | 33246 | 6 | 1052 | 0 | 0 | 96% | 48:58:17 | |
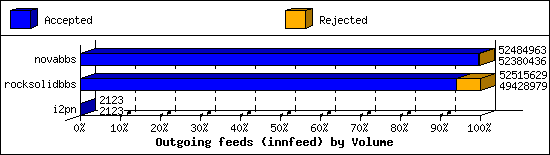
Outgoing Feeds (innfeed) by Volume:
| Server | AcceptVol | RejectVol | TotalVol | Volume/sec | Vol/Art | Elapsed | |
|---|---|---|---|---|---|---|---|
| 1 | novabbs | 50.0 MB | 102.1 KB | 50.1 MB | 0.6 KB/s | 3.0 KB | 23:59:58 |
| 2 | rocksolidbbs | 47.1 MB | 2.9 MB | 50.1 MB | 0.6 KB/s | 3.0 KB | 23:59:58 |
| 3 | i2pn | 2.1 KB | 0.0 KB | 2.1 KB | 0.0 KB/s | 1.0 KB | 00:58:21 |
| TOTAL: 3 | 97.1 MB | 3.0 MB | 100.1 MB | 0.6 KB/s | 3.0 KB | 48:58:17 | |
NNRP readership statistics:
| System | Conn | Arts | Size | Groups | Post | Rej | Elapsed | |
|---|---|---|---|---|---|---|---|---|
| 1 | 107.170.198.19 | 1 | 0 | 0.0 KB | 0 | 0 | 0 | 00:00:09 |
| 2 | scan-141.security.ipip.net | 1 | 0 | 0.0 KB | 0 | 0 | 0 | 00:00:00 |
| TOTAL: 2 | 2 | 0 | 0.0 KB | 0 | 0 | 0 | 00:00:10 | |
NNRP readership statistics (by domain):
| System | Conn | Arts | Size | Groups | Post | Rej | Elapsed | |
|---|---|---|---|---|---|---|---|---|
| 1 | unresolved | 1 | 0 | 0.0 KB | 0 | 0 | 0 | 00:00:09 |
| 2 | *.security.ipip.net | 1 | 0 | 0.0 KB | 0 | 0 | 0 | 00:00:00 |
| TOTAL: 2 | 2 | 0 | 0.0 KB | 0 | 0 | 0 | 00:00:10 | |
NNRP total resource statistics [Top 20]:
| System | User(ms) | System(ms) | Idle(ms) | Elapsed |
|---|---|---|---|---|
| 107.170.198.19 | 0.064 | 0.004 | 0.000 | 00:00:09 |
| scan-141.security.ipip.net | 0.040 | 0.008 | 0.000 | 00:00:00 |
| TOTAL: 2 | 0.104 | 0.012 | 0.000 | 00:00:10 |
NNRP unrecognized commands (by host):
| System | Conn |
|---|---|
| scan-141.security.ipip.net | 4 |
| TOTAL: 1 | 4 |
NNRP unrecognized commands (by command):
| Command | Count |
|---|---|
| User-Agent: HTTP Banner Detection (https... | 1 |
| Host: 157.230.63.40:119 | 1 |
| GET / HTTP/1.1 | 1 |
| Connection: close | 1 |
| TOTAL: 4 | 4 |
