Log entries by program:
| Program name | Lines | %Lines | Size | %Size |
|---|---|---|---|---|
| inn | 18901 | 89.0% | 1.8 MB | 84.8% |
| innd | 1337 | 6.3% | 193.7 KB | 9.0% |
| innfeed | 899 | 4.2% | 121.0 KB | 5.7% |
| nocem | 85 | 0.4% | 10.0 KB | 0.5% |
| nnrpd | 4 | 0.0% | 0.4 KB | 0.0% |
| controlchan | 1 | 0.0% | 0.1 KB | 0.0% |
| TOTAL: 6 | 21227 | 100.0% | 2.1 MB | 100.0% |
History cache:
| Reason | Count | %Count |
|---|---|---|
| Do not exist | 18255 | 97.5% |
| Negative hits | 324 | 1.7% |
| Positive hits | 115 | 0.6% |
| Cache misses | 23 | 0.1% |
| TOTAL: 4 | 18717 | 100.0% |
INND timer:
| Code region | Time | Pct | Invoked | Min(ms) | Avg(ms) | Max(ms) |
|---|---|---|---|---|---|---|
| article cancel | 00:00:00.021 | 0.0% | 157 | 0.000 | 0.134 | 2.000 |
| article cleanup | 00:00:00.096 | 0.0% | 18246 | 0.000 | 0.005 | 0.035 |
| article logging | 00:00:00.492 | 0.0% | 18751 | 0.000 | 0.026 | 0.130 |
| article parse | 00:00:00.257 | 0.0% | 20984 | 0.000 | 0.012 | 0.049 |
| article write | 00:00:02.727 | 0.0% | 18085 | 0.032 | 0.151 | 0.537 |
| artlog/artcncl | 00:00:00.002 | 0.0% | 101 | 0.000 | 0.020 | 0.250 |
| artlog/artwrite | 00:00:00.000 | 0.0% | 2 | 0.000 | 0.000 | 0.000 |
| data move | 00:00:00.009 | 0.0% | 23622 | 0.000 | 0.000 | 0.022 |
| hisgrep/artcncl | 00:00:00.004 | 0.0% | 136 | 0.000 | 0.029 | 1.000 |
| hishave/artcncl | 00:00:00.000 | 0.0% | 157 | 0.000 | 0.000 | 0.000 |
| history grep | 00:00:00.000 | 0.0% | 0 | 0.000 | 0.000 | 0.000 |
| history lookup | 00:00:00.084 | 0.0% | 18575 | 0.000 | 0.005 | 0.027 |
| history sync | 00:00:00.013 | 0.0% | 302 | 0.000 | 0.043 | 0.500 |
| history write | 00:00:00.519 | 0.0% | 18242 | 0.000 | 0.028 | 0.079 |
| hiswrite/artcncl | 00:00:00.000 | 0.0% | 21 | 0.000 | 0.000 | 0.000 |
| idle | 23:50:00.005 | 100.0% | 21720 | 1886.654 | 3950.276 | 10527.807 |
| nntp read | 00:00:00.521 | 0.0% | 21487 | 0.000 | 0.024 | 0.069 |
| overview write | 00:00:02.408 | 0.0% | 18083 | 0.032 | 0.133 | 1.514 |
| perl filter | 00:00:11.244 | 0.0% | 18244 | 0.419 | 0.616 | 0.868 |
| python filter | 00:00:00.000 | 0.0% | 0 | 0.000 | 0.000 | 0.000 |
| site send | 00:00:00.380 | 0.0% | 18160 | 0.000 | 0.021 | 0.066 |
| TOTAL: 23:50:21.388 | 23:50:18.782 | 100.0% | - | - | - | - |
INNfeed timer:
| Code region | Time | Pct | Invoked | Min(ms) | Avg(ms) | Max(ms) |
|---|---|---|---|---|---|---|
| article new | 00:00:00.039 | 0.0% | 18128 | 0.000 | 0.002 | 0.027 |
| article prepare | 00:00:00.011 | 0.0% | 144968 | 0.000 | 0.000 | 0.002 |
| article read | 00:00:00.647 | 0.0% | 18128 | 0.000 | 0.036 | 1.000 |
| backlog stats | 00:00:00.018 | 0.0% | 81088 | 0.000 | 0.000 | 0.004 |
| callbacks | 00:00:00.000 | 0.0% | 0 | 0.000 | 0.000 | 0.000 |
| data read | 00:00:00.306 | 0.0% | 56622 | 0.000 | 0.005 | 0.015 |
| data write | 00:00:00.672 | 0.0% | 38520 | 0.000 | 0.017 | 0.037 |
| idle | 23:59:02.600 | 100.0% | 81088 | 543.556 | 1064.801 | 2830.670 |
| status file | 00:00:00.078 | 0.0% | 217 | 0.000 | 0.359 | 1.000 |
| TOTAL: 23:59:05.534 | 23:59:04.371 | 100.0% | - | - | - | - |
nnrpd timer:
| Code region | Time | Pct | Invoked | Min(ms) | Avg(ms) | Max(ms) |
|---|---|---|---|---|---|---|
| idle | 00:00:09.738 | 98.2% | 1 | 9738.000 | 9738.000 | 9738.000 |
| newnews | 00:00:00.000 | 0.0% | 0 | 0.000 | 0.000 | 0.000 |
| nntpwrite | 00:00:00.000 | 0.0% | 2 | 0.000 | 0.000 | 0.000 |
| TOTAL: 00:00:09.918 | 00:00:09.738 | 98.2% | - | - | - | - |
Control commands to INND:
| Command | Number |
|---|---|
| L | 1 |
| flush | 3 |
| flushlogs | 2 |
| go | 2 |
| logmode | 2 |
| mode | 148 |
| name | 2 |
| pause | 2 |
| paused | 2 |
| reload | 2 |
| reserve | 2 |
| TOTAL: 11 | 168 |
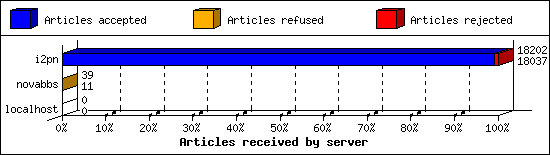
Incoming Feeds (INN):
| Server | Connects | Offered | Taken | Refused | Reject | %Accpt | Elapsed | |
|---|---|---|---|---|---|---|---|---|
| 1 | i2pn | 5 | 18202 | 18037 | 2 | 163 | 99% | 24:14:58 |
| 2 | novabbs | 15 | 39 | 11 | 28 | 0 | 28% | 03:31:18 |
| 3 | localhost | 33 | 0 | 0 | 0 | 0 | 0% | 00:00:00 |
| TOTAL: 3 | 53 | 18241 | 18048 | 30 | 163 | 98% | 27:46:16 | |
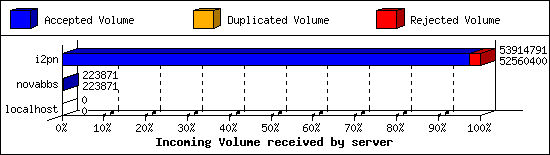
Incoming Volume (INN):
| Server | AcceptVol | DupVol | RejVol | TotalVol | %Acc | Vol/Art | |
|---|---|---|---|---|---|---|---|
| 1 | i2pn | 50.1 MB | 6.0 KB | 1.3 MB | 51.4 MB | 97% | 2.9 KB |
| 2 | novabbs | 218.6 KB | 0.0 KB | 0.0 KB | 218.6 KB | 100% | 19.9 KB |
| 3 | localhost | 0.0 KB | 0.0 KB | 0.0 KB | 0.0 KB | 0% | 0 |
| TOTAL: 3 | 50.3 MB | 6.0 KB | 1.3 MB | 51.6 MB | 97% | 2.9 KB | |
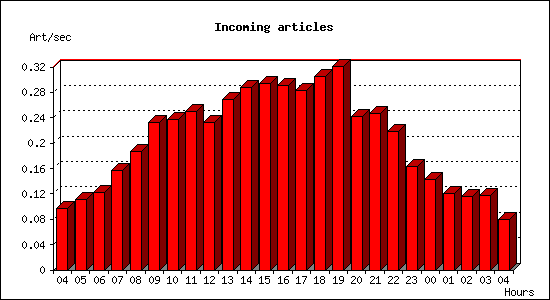
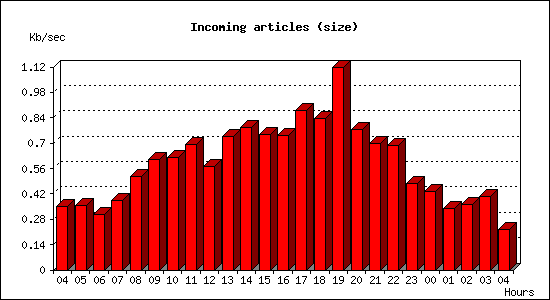
Incoming articles:
| Date | Articles | %Arts | Art/sec | Size | %Size | KB/sec |
|---|---|---|---|---|---|---|
| Mar 25 04:15:02 - 04:59:59 | 263 | 1.5% | 0.10 | 944.7 KB | 1.8% | 0.35 |
| Mar 25 05:00:00 - 05:59:59 | 399 | 2.2% | 0.11 | 1.2 MB | 2.5% | 0.36 |
| Mar 25 06:00:00 - 06:59:59 | 439 | 2.4% | 0.12 | 1.1 MB | 2.1% | 0.31 |
| Mar 25 07:00:00 - 07:59:59 | 566 | 3.1% | 0.16 | 1.3 MB | 2.7% | 0.38 |
| Mar 25 08:00:00 - 08:59:59 | 672 | 3.7% | 0.19 | 1.8 MB | 3.6% | 0.52 |
| Mar 25 09:00:00 - 09:59:59 | 836 | 4.6% | 0.23 | 2.1 MB | 4.2% | 0.61 |
| Mar 25 10:00:00 - 10:59:59 | 854 | 4.7% | 0.24 | 2.2 MB | 4.3% | 0.62 |
| Mar 25 11:00:00 - 11:59:59 | 902 | 5.0% | 0.25 | 2.4 MB | 4.8% | 0.69 |
| Mar 25 12:00:00 - 12:59:59 | 837 | 4.6% | 0.23 | 2.0 MB | 4.0% | 0.57 |
| Mar 25 13:00:00 - 13:59:59 | 966 | 5.3% | 0.27 | 2.6 MB | 5.1% | 0.74 |
| Mar 25 14:00:00 - 14:59:59 | 1036 | 5.7% | 0.29 | 2.8 MB | 5.5% | 0.78 |
| Mar 25 15:00:00 - 15:59:59 | 1057 | 5.8% | 0.29 | 2.6 MB | 5.2% | 0.75 |
| Mar 25 16:00:00 - 16:59:59 | 1048 | 5.8% | 0.29 | 2.6 MB | 5.2% | 0.74 |
| Mar 25 17:00:00 - 17:59:59 | 1021 | 5.6% | 0.28 | 3.1 MB | 6.1% | 0.88 |
| Mar 25 18:00:00 - 18:59:59 | 1098 | 6.1% | 0.30 | 2.9 MB | 5.8% | 0.83 |
| Mar 25 19:00:00 - 19:59:59 | 1152 | 6.4% | 0.32 | 3.9 MB | 7.8% | 1.12 |
| Mar 25 20:00:00 - 20:59:59 | 870 | 4.8% | 0.24 | 2.7 MB | 5.4% | 0.77 |
| Mar 25 21:00:00 - 21:59:59 | 887 | 4.9% | 0.25 | 2.5 MB | 4.9% | 0.70 |
| Mar 25 22:00:00 - 22:59:59 | 787 | 4.3% | 0.22 | 2.4 MB | 4.8% | 0.69 |
| Mar 25 23:00:00 - 23:59:59 | 587 | 3.2% | 0.16 | 1.7 MB | 3.3% | 0.47 |
| Mar 26 00:00:00 - 00:59:59 | 511 | 2.8% | 0.14 | 1.5 MB | 3.0% | 0.43 |
| Mar 26 01:00:00 - 01:59:59 | 432 | 2.4% | 0.12 | 1.2 MB | 2.3% | 0.34 |
| Mar 26 02:00:00 - 02:59:59 | 418 | 2.3% | 0.12 | 1.3 MB | 2.5% | 0.36 |
| Mar 26 03:00:00 - 03:59:59 | 420 | 2.3% | 0.12 | 1.4 MB | 2.8% | 0.40 |
| Mar 26 04:00:00 - 04:15:01 | 72 | 0.4% | 0.08 | 200.2 KB | 0.4% | 0.22 |
| TOTAL: 23:59:59 | 18130 | 100.0% | 0.21 | 50.6 MB | 100.0% | 0.60 |
Sites sending bad articles:
| Server | Total | Group | Dist | Duplic | Unapp | TooOld | Site | Line | Other | |
|---|---|---|---|---|---|---|---|---|---|---|
| 1 | i2pn | 670 | 14 | 0 | 2 | 0 | 0 | 0 | 0 | 654 |
| TOTAL: 1 | 670 | 14 | 0 | 2 | 0 | 0 | 0 | 0 | 654 | |
Unwanted newsgroups [Top 20]:
| Newsgroup | Count |
|---|---|
| alt.pl.nieruchomosci.gielda | 12 |
| a.bsu.religion | 1 |
| lada.politics | 1 |
| TOTAL: 3 | 14 |
INND Perl filter [Top 20]:
| Reason | Count |
|---|---|
| Scoring filter (s5) | 96 |
| Scoring filter (s6) | 40 |
| Scoring filter (n4) | 8 |
| Cancel for rejected article | 1 |
| TOTAL: 4 | 145 |
NoCeM on Spool:
| Id | Good | Bad | Unique | Total |
|---|---|---|---|---|
| bleachbot@httrack.com | 77 | 0 | 80 | 80 |
| TOTAL: 1 | 77 | 0 | 80 | 80 |
Miscellaneous innd statistics [Top 10]:
| Event | Server | Number |
|---|---|---|
| Including strange strings | ||
| i2pn | 507 | |
| TOTAL: 1 | 507 | |
| TOTAL: 1 | 507 | |
Outgoing Feeds (innfeed) by Articles:
| Server | Offered | Taken | Refused | Reject | Miss | Spool | %Took | Elapsed | |
|---|---|---|---|---|---|---|---|---|---|
| 1 | novabbs | 18126 | 18023 | 4 | 92 | 0 | 0 | 99% | 23:59:43 |
| 2 | rocksolidbbs | 18140 | 16894 | 0 | 1236 | 0 | 0 | 93% | 23:59:57 |
| 3 | i2pn | 12 | 1 | 10 | 0 | 0 | 0 | 8% | 01:40:38 |
| TOTAL: 3 | 36278 | 34918 | 14 | 1328 | 0 | 0 | 96% | 49:40:18 | |

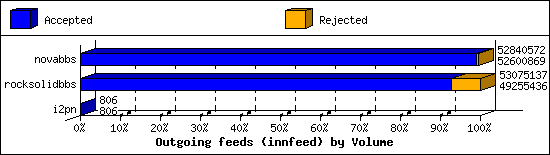
Outgoing Feeds (innfeed) by Volume:
| Server | AcceptVol | RejectVol | TotalVol | Volume/sec | Vol/Art | Elapsed | |
|---|---|---|---|---|---|---|---|
| 1 | novabbs | 50.2 MB | 234.1 KB | 50.4 MB | 0.6 KB/s | 2.8 KB | 23:59:43 |
| 2 | rocksolidbbs | 47.0 MB | 3.6 MB | 50.6 MB | 0.6 KB/s | 2.9 KB | 23:59:57 |
| 3 | i2pn | 0.8 KB | 0.0 KB | 0.8 KB | 0.0 KB/s | 0.8 KB | 01:40:38 |
| TOTAL: 3 | 97.1 MB | 3.9 MB | 101.0 MB | 0.6 KB/s | 2.9 KB | 49:40:18 | |
NNRP readership statistics:
| System | Conn | Arts | Size | Groups | Post | Rej | Elapsed | |
|---|---|---|---|---|---|---|---|---|
| 1 | 107.170.194.203 | 1 | 0 | 0.0 KB | 0 | 0 | 0 | 00:00:09 |
| TOTAL: 1 | 1 | 0 | 0.0 KB | 0 | 0 | 0 | 00:00:09 | |
NNRP readership statistics (by domain):
| System | Conn | Arts | Size | Groups | Post | Rej | Elapsed | |
|---|---|---|---|---|---|---|---|---|
| 1 | unresolved | 1 | 0 | 0.0 KB | 0 | 0 | 0 | 00:00:09 |
| TOTAL: 1 | 1 | 0 | 0.0 KB | 0 | 0 | 0 | 00:00:09 | |
NNRP total resource statistics [Top 20]:
| System | User(ms) | System(ms) | Idle(ms) | Elapsed |
|---|---|---|---|---|
| 107.170.194.203 | 0.044 | 0.008 | 0.000 | 00:00:09 |
| TOTAL: 1 | 0.044 | 0.008 | 0.000 | 00:00:09 |
