Log entries by program:
| Program name | Lines | %Lines | Size | %Size |
|---|---|---|---|---|
| inn | 20018 | 89.3% | 1.9 MB | 85.3% |
| innd | 1410 | 6.3% | 191.8 KB | 8.5% |
| innfeed | 889 | 4.0% | 128.6 KB | 5.7% |
| nocem | 79 | 0.4% | 8.8 KB | 0.4% |
| nnrpd | 7 | 0.0% | 0.8 KB | 0.0% |
| controlchan | 2 | 0.0% | 0.2 KB | 0.0% |
| TOTAL: 6 | 22405 | 100.0% | 2.2 MB | 100.0% |
History cache:
| Reason | Count | %Count |
|---|---|---|
| Do not exist | 19173 | 97.6% |
| Negative hits | 325 | 1.7% |
| Positive hits | 124 | 0.6% |
| Cache misses | 17 | 0.1% |
| TOTAL: 4 | 19639 | 100.0% |
INND timer:
| Code region | Time | Pct | Invoked | Min(ms) | Avg(ms) | Max(ms) |
|---|---|---|---|---|---|---|
| article cancel | 00:00:00.025 | 0.0% | 154 | 0.000 | 0.162 | 1.000 |
| article cleanup | 00:00:00.092 | 0.0% | 19214 | 0.000 | 0.005 | 0.031 |
| article logging | 00:00:00.549 | 0.0% | 19890 | 0.000 | 0.028 | 0.091 |
| article parse | 00:00:00.282 | 0.0% | 21934 | 0.000 | 0.013 | 0.046 |
| article write | 00:00:02.658 | 0.0% | 19034 | 0.045 | 0.140 | 0.371 |
| artlog/artcncl | 00:00:00.004 | 0.0% | 120 | 0.000 | 0.033 | 1.000 |
| artlog/artwrite | 00:00:00.000 | 0.0% | 0 | 0.000 | 0.000 | 0.000 |
| data move | 00:00:00.008 | 0.0% | 24642 | 0.000 | 0.000 | 0.018 |
| hisgrep/artcncl | 00:00:00.000 | 0.0% | 139 | 0.000 | 0.000 | 0.000 |
| hishave/artcncl | 00:00:00.000 | 0.0% | 154 | 0.000 | 0.000 | 0.000 |
| history grep | 00:00:00.000 | 0.0% | 0 | 0.000 | 0.000 | 0.000 |
| history lookup | 00:00:00.067 | 0.0% | 19548 | 0.000 | 0.003 | 0.025 |
| history sync | 00:00:00.012 | 0.0% | 413 | 0.000 | 0.029 | 0.500 |
| history write | 00:00:00.532 | 0.0% | 19213 | 0.000 | 0.028 | 0.082 |
| hiswrite/artcncl | 00:00:00.000 | 0.0% | 15 | 0.000 | 0.000 | 0.000 |
| idle | 24:00:37.417 | 100.0% | 22765 | 2310.423 | 3796.943 | 11322.208 |
| nntp read | 00:00:00.549 | 0.0% | 22418 | 0.000 | 0.024 | 0.069 |
| overview write | 00:00:02.021 | 0.0% | 19034 | 0.000 | 0.106 | 1.500 |
| perl filter | 00:00:11.602 | 0.0% | 19213 | 0.476 | 0.604 | 0.834 |
| python filter | 00:00:00.000 | 0.0% | 0 | 0.000 | 0.000 | 0.000 |
| site send | 00:00:00.347 | 0.0% | 19103 | 0.000 | 0.018 | 0.116 |
| TOTAL: 24:00:58.977 | 24:00:56.165 | 100.0% | - | - | - | - |
INNfeed timer:
| Code region | Time | Pct | Invoked | Min(ms) | Avg(ms) | Max(ms) |
|---|---|---|---|---|---|---|
| article new | 00:00:00.023 | 0.0% | 19013 | 0.000 | 0.001 | 0.014 |
| article prepare | 00:00:00.015 | 0.0% | 152092 | 0.000 | 0.000 | 0.002 |
| article read | 00:00:00.695 | 0.0% | 19013 | 0.000 | 0.037 | 0.688 |
| backlog stats | 00:00:00.036 | 0.0% | 87730 | 0.000 | 0.000 | 0.004 |
| callbacks | 00:00:00.000 | 0.0% | 0 | 0.000 | 0.000 | 0.000 |
| data read | 00:00:00.360 | 0.0% | 60818 | 0.000 | 0.006 | 0.022 |
| data write | 00:00:00.718 | 0.0% | 41829 | 0.000 | 0.017 | 0.053 |
| idle | 23:57:02.964 | 100.0% | 87730 | 464.162 | 982.822 | 2786.176 |
| status file | 00:00:00.092 | 0.0% | 211 | 0.000 | 0.436 | 2.000 |
| TOTAL: 23:57:05.982 | 23:57:04.903 | 100.0% | - | - | - | - |
nnrpd timer:
| Code region | Time | Pct | Invoked | Min(ms) | Avg(ms) | Max(ms) |
|---|---|---|---|---|---|---|
| idle | 00:00:00.165 | 41.2% | 2 | 82.500 | 82.500 | 82.500 |
| newnews | 00:00:00.000 | 0.0% | 0 | 0.000 | 0.000 | 0.000 |
| nntpwrite | 00:00:00.000 | 0.0% | 11 | 0.000 | 0.000 | 0.000 |
| TOTAL: 00:00:00.400 | 00:00:00.165 | 41.2% | - | - | - | - |
Control commands to INND:
| Command | Number |
|---|---|
| L | 1 |
| flush | 3 |
| flushlogs | 2 |
| go | 2 |
| logmode | 2 |
| mode | 148 |
| name | 2 |
| pause | 2 |
| paused | 2 |
| reload | 2 |
| reserve | 2 |
| TOTAL: 11 | 168 |
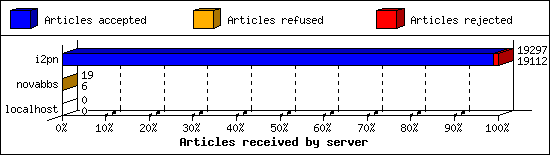
Incoming Feeds (INN):
| Server | Connects | Offered | Taken | Refused | Reject | %Accpt | Elapsed | |
|---|---|---|---|---|---|---|---|---|
| 1 | i2pn | 8 | 19297 | 19112 | 4 | 181 | 99% | 25:04:06 |
| 2 | novabbs | 13 | 19 | 6 | 13 | 0 | 31% | 02:21:49 |
| 3 | localhost | 35 | 0 | 0 | 0 | 0 | 0% | 00:00:00 |
| TOTAL: 3 | 56 | 19316 | 19118 | 17 | 181 | 98% | 27:25:55 | |
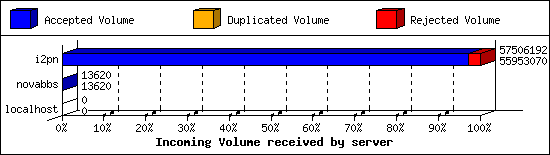
Incoming Volume (INN):
| Server | AcceptVol | DupVol | RejVol | TotalVol | %Acc | Vol/Art | |
|---|---|---|---|---|---|---|---|
| 1 | i2pn | 53.4 MB | 3.1 KB | 1.5 MB | 54.8 MB | 97% | 2.9 KB |
| 2 | novabbs | 13.3 KB | 0.0 KB | 0.0 KB | 13.3 KB | 100% | 2.2 KB |
| 3 | localhost | 0.0 KB | 0.0 KB | 0.0 KB | 0.0 KB | 0% | 0 |
| TOTAL: 3 | 53.4 MB | 3.1 KB | 1.5 MB | 54.9 MB | 97% | 2.9 KB | |
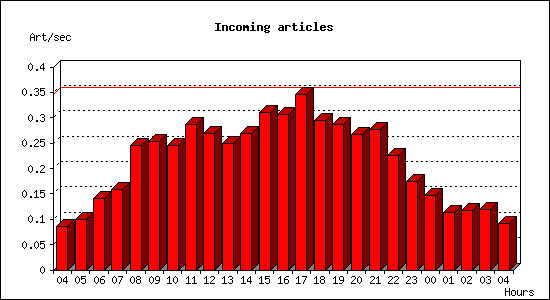
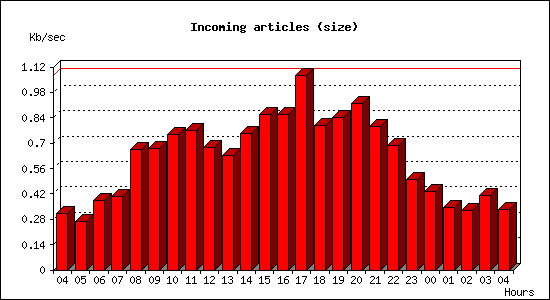
Incoming articles:
| Date | Articles | %Arts | Art/sec | Size | %Size | KB/sec |
|---|---|---|---|---|---|---|
| Mar 26 04:15:01 - 04:59:59 | 230 | 1.2% | 0.09 | 835.7 KB | 1.5% | 0.31 |
| Mar 26 05:00:00 - 05:59:59 | 359 | 1.9% | 0.10 | 970.9 KB | 1.8% | 0.27 |
| Mar 26 06:00:00 - 06:59:59 | 509 | 2.7% | 0.14 | 1.4 MB | 2.6% | 0.39 |
| Mar 26 07:00:00 - 07:59:59 | 569 | 3.0% | 0.16 | 1.4 MB | 2.7% | 0.41 |
| Mar 26 08:00:00 - 08:59:59 | 884 | 4.6% | 0.25 | 2.3 MB | 4.4% | 0.66 |
| Mar 26 09:00:00 - 09:59:59 | 909 | 4.8% | 0.25 | 2.3 MB | 4.4% | 0.67 |
| Mar 26 10:00:00 - 10:59:59 | 883 | 4.6% | 0.25 | 2.6 MB | 4.9% | 0.75 |
| Mar 26 11:00:00 - 11:59:59 | 1032 | 5.4% | 0.29 | 2.7 MB | 5.1% | 0.77 |
| Mar 26 12:00:00 - 12:59:59 | 970 | 5.1% | 0.27 | 2.4 MB | 4.5% | 0.67 |
| Mar 26 13:00:00 - 13:59:59 | 900 | 4.7% | 0.25 | 2.2 MB | 4.2% | 0.63 |
| Mar 26 14:00:00 - 14:59:59 | 968 | 5.1% | 0.27 | 2.6 MB | 5.0% | 0.75 |
| Mar 26 15:00:00 - 15:59:59 | 1114 | 5.9% | 0.31 | 3.0 MB | 5.7% | 0.86 |
| Mar 26 16:00:00 - 16:59:59 | 1101 | 5.8% | 0.31 | 3.0 MB | 5.7% | 0.86 |
| Mar 26 17:00:00 - 17:59:59 | 1245 | 6.5% | 0.35 | 3.8 MB | 7.1% | 1.07 |
| Mar 26 18:00:00 - 18:59:59 | 1063 | 5.6% | 0.30 | 2.8 MB | 5.3% | 0.80 |
| Mar 26 19:00:00 - 19:59:59 | 1031 | 5.4% | 0.29 | 3.0 MB | 5.6% | 0.84 |
| Mar 26 20:00:00 - 20:59:59 | 964 | 5.1% | 0.27 | 3.2 MB | 6.1% | 0.92 |
| Mar 26 21:00:00 - 21:59:59 | 995 | 5.2% | 0.28 | 2.8 MB | 5.2% | 0.79 |
| Mar 26 22:00:00 - 22:59:59 | 812 | 4.3% | 0.23 | 2.4 MB | 4.5% | 0.69 |
| Mar 26 23:00:00 - 23:59:59 | 626 | 3.3% | 0.17 | 1.8 MB | 3.3% | 0.50 |
| Mar 27 00:00:00 - 00:59:59 | 528 | 2.8% | 0.15 | 1.5 MB | 2.9% | 0.44 |
| Mar 27 01:00:00 - 01:59:59 | 410 | 2.2% | 0.11 | 1.2 MB | 2.3% | 0.34 |
| Mar 27 02:00:00 - 02:59:59 | 421 | 2.2% | 0.12 | 1.2 MB | 2.2% | 0.33 |
| Mar 27 03:00:00 - 03:59:59 | 430 | 2.3% | 0.12 | 1.4 MB | 2.7% | 0.41 |
| Mar 27 04:00:00 - 04:15:01 | 83 | 0.4% | 0.09 | 299.5 KB | 0.6% | 0.33 |
| TOTAL: 24:00:00 | 19036 | 100.0% | 0.22 | 53.2 MB | 100.0% | 0.63 |
Sites sending bad articles:
| Server | Total | Group | Dist | Duplic | Unapp | TooOld | Site | Line | Other | |
|---|---|---|---|---|---|---|---|---|---|---|
| 1 | i2pn | 860 | 6 | 0 | 1 | 0 | 0 | 0 | 0 | 853 |
| TOTAL: 1 | 860 | 6 | 0 | 1 | 0 | 0 | 0 | 0 | 853 | |
Unwanted newsgroups [Top 20]:
| Newsgroup | Count |
|---|---|
| hk.politics | 2 |
| adobe.illustrator.windows | 1 |
| lada.politics | 1 |
| alt.sex.girl | 1 |
| alt.social-security-disability | 1 |
| TOTAL: 5 | 6 |
INND Perl filter [Top 20]:
| Reason | Count |
|---|---|
| Scoring filter (s5) | 116 |
| Scoring filter (s6) | 50 |
| Scoring filter (n4) | 8 |
| TOTAL: 3 | 174 |
NoCeM on Spool:
| Id | Good | Bad | Unique | Total |
|---|---|---|---|---|
| bleachbot@httrack.com | 69 | 0 | 74 | 74 |
| TOTAL: 1 | 69 | 0 | 74 | 74 |
Miscellaneous innd statistics [Top 10]:
| Event | Server | Number |
|---|---|---|
| Including strange strings | ||
| i2pn | 679 | |
| TOTAL: 1 | 679 | |
| TOTAL: 1 | 679 | |
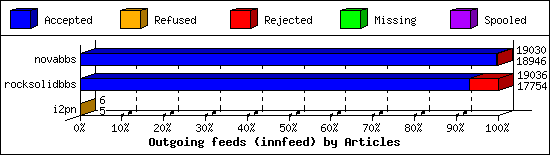
Outgoing Feeds (innfeed) by Articles:
| Server | Offered | Taken | Refused | Reject | Miss | Spool | %Took | Elapsed | |
|---|---|---|---|---|---|---|---|---|---|
| 1 | novabbs | 19037 | 18946 | 2 | 82 | 0 | 0 | 99% | 23:59:58 |
| 2 | rocksolidbbs | 19049 | 17754 | 0 | 1282 | 0 | 0 | 93% | 23:59:50 |
| 3 | i2pn | 7 | 5 | 1 | 0 | 0 | 0 | 71% | 01:10:05 |
| TOTAL: 3 | 38093 | 36705 | 3 | 1364 | 0 | 0 | 96% | 49:09:53 | |
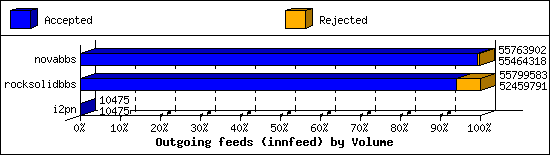
Outgoing Feeds (innfeed) by Volume:
| Server | AcceptVol | RejectVol | TotalVol | Volume/sec | Vol/Art | Elapsed | |
|---|---|---|---|---|---|---|---|
| 1 | novabbs | 52.9 MB | 292.6 KB | 53.2 MB | 0.6 KB/s | 2.9 KB | 23:59:58 |
| 2 | rocksolidbbs | 50.0 MB | 3.2 MB | 53.2 MB | 0.6 KB/s | 2.9 KB | 23:59:50 |
| 3 | i2pn | 10.2 KB | 0.0 KB | 10.2 KB | 0.0 KB/s | 2.0 KB | 01:10:05 |
| TOTAL: 3 | 102.9 MB | 3.5 MB | 106.4 MB | 0.6 KB/s | 2.9 KB | 49:09:53 | |
NNRP readership statistics:
| System | Conn | Arts | Size | Groups | Post | Rej | Elapsed | |
|---|---|---|---|---|---|---|---|---|
| 1 | scan-141.security.ipip.net | 1 | 0 | 0.0 KB | 0 | 0 | 0 | 00:00:00 |
| TOTAL: 1 | 1 | 0 | 0.0 KB | 0 | 0 | 0 | 00:00:00 | |
NNRP readership statistics (by domain):
| System | Conn | Arts | Size | Groups | Post | Rej | Elapsed | |
|---|---|---|---|---|---|---|---|---|
| 1 | *.security.ipip.net | 1 | 0 | 0.0 KB | 0 | 0 | 0 | 00:00:00 |
| TOTAL: 1 | 1 | 0 | 0.0 KB | 0 | 0 | 0 | 00:00:00 | |
NNRP total resource statistics [Top 20]:
| System | User(ms) | System(ms) | Idle(ms) | Elapsed |
|---|---|---|---|---|
| scan-141.security.ipip.net | 0.044 | 0.000 | 0.000 | 00:00:00 |
| TOTAL: 1 | 0.044 | 0.000 | 0.000 | 00:00:00 |
NNRP unrecognized commands (by host):
| System | Conn |
|---|---|
| scan-141.security.ipip.net | 4 |
| TOTAL: 1 | 4 |
NNRP unrecognized commands (by command):
| Command | Count |
|---|---|
| User-Agent: HTTP Banner Detection (https... | 1 |
| GET / HTTP/1.1 | 1 |
| Host: 157.230.63.40:119 | 1 |
| Connection: close | 1 |
| TOTAL: 4 | 4 |
