Log entries by program:
| Program name | Lines | %Lines | Size | %Size |
|---|---|---|---|---|
| inn | 18937 | 89.6% | 1.8 MB | 85.4% |
| innd | 1271 | 6.0% | 178.9 KB | 8.4% |
| innfeed | 869 | 4.1% | 123.6 KB | 5.8% |
| nocem | 59 | 0.3% | 6.1 KB | 0.3% |
| nnrpd | 9 | 0.0% | 0.9 KB | 0.0% |
| controlchan | 1 | 0.0% | 0.0 KB | 0.0% |
| TOTAL: 6 | 21146 | 100.0% | 2.1 MB | 100.0% |
History cache:
| Reason | Count | %Count |
|---|---|---|
| Do not exist | 18180 | 98.1% |
| Negative hits | 220 | 1.2% |
| Positive hits | 100 | 0.5% |
| Cache misses | 27 | 0.1% |
| TOTAL: 4 | 18527 | 100.0% |
INND timer:
| Code region | Time | Pct | Invoked | Min(ms) | Avg(ms) | Max(ms) |
|---|---|---|---|---|---|---|
| article cancel | 00:00:00.027 | 0.0% | 137 | 0.000 | 0.197 | 1.000 |
| article cleanup | 00:00:00.102 | 0.0% | 18205 | 0.000 | 0.006 | 0.022 |
| article logging | 00:00:00.528 | 0.0% | 18825 | 0.000 | 0.028 | 0.091 |
| article parse | 00:00:00.259 | 0.0% | 20588 | 0.000 | 0.013 | 0.053 |
| article write | 00:00:02.844 | 0.0% | 18070 | 0.062 | 0.157 | 1.401 |
| artlog/artcncl | 00:00:00.001 | 0.0% | 109 | 0.000 | 0.009 | 0.333 |
| artlog/artwrite | 00:00:00.000 | 0.0% | 0 | 0.000 | 0.000 | 0.000 |
| data move | 00:00:00.014 | 0.0% | 22935 | 0.000 | 0.001 | 0.013 |
| hisgrep/artcncl | 00:00:00.002 | 0.0% | 127 | 0.000 | 0.016 | 0.250 |
| hishave/artcncl | 00:00:00.000 | 0.0% | 137 | 0.000 | 0.000 | 0.000 |
| history grep | 00:00:00.000 | 0.0% | 0 | 0.000 | 0.000 | 0.000 |
| history lookup | 00:00:00.075 | 0.0% | 18436 | 0.000 | 0.004 | 0.035 |
| history sync | 00:00:00.013 | 0.0% | 412 | 0.000 | 0.032 | 0.667 |
| history write | 00:00:00.595 | 0.0% | 18205 | 0.000 | 0.033 | 0.267 |
| hiswrite/artcncl | 00:00:00.000 | 0.0% | 10 | 0.000 | 0.000 | 0.000 |
| idle | 24:00:47.930 | 100.0% | 21267 | 2014.557 | 4064.886 | 12006.020 |
| nntp read | 00:00:00.527 | 0.0% | 20926 | 0.000 | 0.025 | 0.099 |
| overview write | 00:00:02.199 | 0.0% | 18070 | 0.036 | 0.122 | 3.395 |
| perl filter | 00:00:10.978 | 0.0% | 18205 | 0.470 | 0.603 | 1.312 |
| python filter | 00:00:00.000 | 0.0% | 0 | 0.000 | 0.000 | 0.000 |
| site send | 00:00:00.485 | 0.0% | 18121 | 0.000 | 0.027 | 0.077 |
| TOTAL: 24:01:09.443 | 24:01:06.579 | 100.0% | - | - | - | - |
INNfeed timer:
| Code region | Time | Pct | Invoked | Min(ms) | Avg(ms) | Max(ms) |
|---|---|---|---|---|---|---|
| article new | 00:00:00.035 | 0.0% | 18065 | 0.000 | 0.002 | 0.031 |
| article prepare | 00:00:00.013 | 0.0% | 144472 | 0.000 | 0.000 | 0.002 |
| article read | 00:00:00.680 | 0.0% | 18064 | 0.000 | 0.038 | 0.635 |
| backlog stats | 00:00:00.024 | 0.0% | 85460 | 0.000 | 0.000 | 0.004 |
| callbacks | 00:00:00.000 | 0.0% | 0 | 0.000 | 0.000 | 0.000 |
| data read | 00:00:00.305 | 0.0% | 58685 | 0.000 | 0.005 | 0.018 |
| data write | 00:00:00.670 | 0.0% | 40667 | 0.000 | 0.016 | 0.039 |
| idle | 23:58:21.516 | 100.0% | 85460 | 475.797 | 1009.847 | 2554.885 |
| status file | 00:00:00.090 | 0.0% | 202 | 0.000 | 0.446 | 5.000 |
| TOTAL: 23:58:24.357 | 23:58:23.333 | 100.0% | - | - | - | - |
nnrpd timer:
| Code region | Time | Pct | Invoked | Min(ms) | Avg(ms) | Max(ms) |
|---|---|---|---|---|---|---|
| idle | 00:00:09.738 | 96.3% | 3 | 11.000 | 3246.000 | 9716.000 |
| newnews | 00:00:00.000 | 0.0% | 0 | 0.000 | 0.000 | 0.000 |
| nntpwrite | 00:00:00.000 | 0.0% | 5 | 0.000 | 0.000 | 0.000 |
| TOTAL: 00:00:10.108 | 00:00:09.738 | 96.3% | - | - | - | - |
Control commands to INND:
| Command | Number |
|---|---|
| L | 1 |
| flush | 3 |
| flushlogs | 2 |
| go | 2 |
| logmode | 2 |
| mode | 148 |
| name | 2 |
| pause | 2 |
| paused | 2 |
| reload | 2 |
| reserve | 2 |
| TOTAL: 11 | 168 |
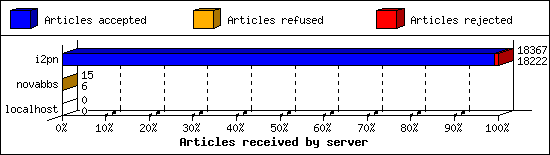
Incoming Feeds (INN):
| Server | Connects | Offered | Taken | Refused | Reject | %Accpt | Elapsed | |
|---|---|---|---|---|---|---|---|---|
| 1 | i2pn | 6 | 18367 | 18222 | 2 | 143 | 99% | 25:13:32 |
| 2 | novabbs | 9 | 15 | 6 | 9 | 0 | 40% | 01:53:13 |
| 3 | localhost | 33 | 0 | 0 | 0 | 0 | 0% | 00:00:00 |
| TOTAL: 3 | 48 | 18382 | 18228 | 11 | 143 | 99% | 27:06:45 | |
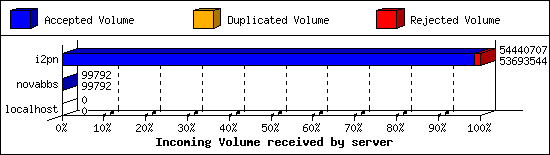
Incoming Volume (INN):
| Server | AcceptVol | DupVol | RejVol | TotalVol | %Acc | Vol/Art | |
|---|---|---|---|---|---|---|---|
| 1 | i2pn | 51.2 MB | 0.0 KB | 729.7 KB | 51.9 MB | 98% | 2.9 KB |
| 2 | novabbs | 97.5 KB | 0.0 KB | 0.0 KB | 97.5 KB | 100% | 16.2 KB |
| 3 | localhost | 0.0 KB | 0.0 KB | 0.0 KB | 0.0 KB | 0% | 0 |
| TOTAL: 3 | 51.3 MB | 0.0 KB | 729.7 KB | 52.0 MB | 98% | 2.9 KB | |
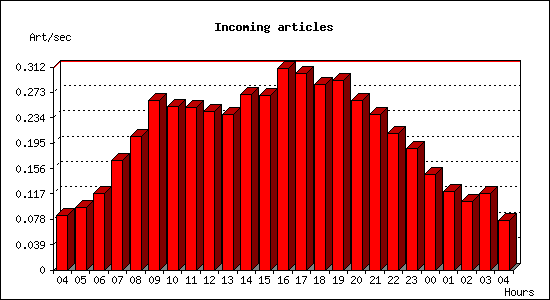
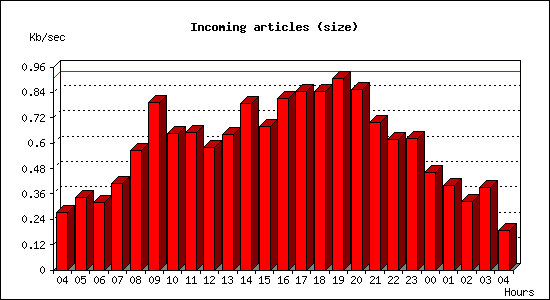
Incoming articles:
| Date | Articles | %Arts | Art/sec | Size | %Size | KB/sec |
|---|---|---|---|---|---|---|
| Mar 28 04:15:01 - 04:59:59 | 225 | 1.2% | 0.08 | 735.7 KB | 1.4% | 0.27 |
| Mar 28 05:00:00 - 05:59:59 | 344 | 1.9% | 0.10 | 1.2 MB | 2.4% | 0.34 |
| Mar 28 06:00:00 - 06:59:59 | 423 | 2.3% | 0.12 | 1.1 MB | 2.2% | 0.32 |
| Mar 28 07:00:00 - 07:59:59 | 604 | 3.3% | 0.17 | 1.4 MB | 2.8% | 0.41 |
| Mar 28 08:00:00 - 08:59:59 | 737 | 4.1% | 0.20 | 2.0 MB | 3.9% | 0.56 |
| Mar 28 09:00:00 - 09:59:59 | 940 | 5.2% | 0.26 | 2.8 MB | 5.5% | 0.79 |
| Mar 28 10:00:00 - 10:59:59 | 905 | 5.0% | 0.25 | 2.3 MB | 4.5% | 0.65 |
| Mar 28 11:00:00 - 11:59:59 | 899 | 5.0% | 0.25 | 2.3 MB | 4.5% | 0.65 |
| Mar 28 12:00:00 - 12:59:59 | 875 | 4.8% | 0.24 | 2.0 MB | 4.0% | 0.58 |
| Mar 28 13:00:00 - 13:59:59 | 858 | 4.7% | 0.24 | 2.2 MB | 4.4% | 0.64 |
| Mar 28 14:00:00 - 14:59:59 | 969 | 5.4% | 0.27 | 2.8 MB | 5.5% | 0.79 |
| Mar 28 15:00:00 - 15:59:59 | 964 | 5.3% | 0.27 | 2.4 MB | 4.7% | 0.68 |
| Mar 28 16:00:00 - 16:59:59 | 1113 | 6.2% | 0.31 | 2.8 MB | 5.6% | 0.81 |
| Mar 28 17:00:00 - 17:59:59 | 1085 | 6.0% | 0.30 | 3.0 MB | 5.9% | 0.84 |
| Mar 28 18:00:00 - 18:59:59 | 1029 | 5.7% | 0.29 | 3.0 MB | 5.8% | 0.84 |
| Mar 28 19:00:00 - 19:59:59 | 1049 | 5.8% | 0.29 | 3.2 MB | 6.3% | 0.91 |
| Mar 28 20:00:00 - 20:59:59 | 937 | 5.2% | 0.26 | 3.0 MB | 5.9% | 0.85 |
| Mar 28 21:00:00 - 21:59:59 | 858 | 4.7% | 0.24 | 2.5 MB | 4.8% | 0.70 |
| Mar 28 22:00:00 - 22:59:59 | 755 | 4.2% | 0.21 | 2.2 MB | 4.3% | 0.62 |
| Mar 28 23:00:00 - 23:59:59 | 670 | 3.7% | 0.19 | 2.2 MB | 4.3% | 0.62 |
| Mar 29 00:00:00 - 00:59:59 | 530 | 2.9% | 0.15 | 1.6 MB | 3.2% | 0.46 |
| Mar 29 01:00:00 - 01:59:59 | 433 | 2.4% | 0.12 | 1.4 MB | 2.8% | 0.40 |
| Mar 29 02:00:00 - 02:59:59 | 378 | 2.1% | 0.10 | 1.1 MB | 2.2% | 0.32 |
| Mar 29 03:00:00 - 03:59:59 | 425 | 2.4% | 0.12 | 1.4 MB | 2.7% | 0.39 |
| Mar 29 04:00:00 - 04:15:01 | 68 | 0.4% | 0.08 | 168.8 KB | 0.3% | 0.19 |
| TOTAL: 24:00:00 | 18073 | 100.0% | 0.21 | 50.7 MB | 100.0% | 0.60 |
Sites sending bad articles:
| Server | Total | Group | Dist | Duplic | Unapp | TooOld | Site | Line | Other | |
|---|---|---|---|---|---|---|---|---|---|---|
| 1 | i2pn | 755 | 14 | 0 | 0 | 0 | 0 | 0 | 0 | 741 |
| TOTAL: 1 | 755 | 14 | 0 | 0 | 0 | 0 | 0 | 0 | 741 | |
Unwanted newsgroups [Top 20]:
| Newsgroup | Count |
|---|---|
| a.bsu.religion | 10 |
| hk.politics | 2 |
| alt.2600 | 1 |
| 24hoursupport.helpdesk | 1 |
| TOTAL: 4 | 14 |
INND Perl filter [Top 20]:
| Reason | Count |
|---|---|
| Scoring filter (s5) | 91 |
| Scoring filter (s6) | 22 |
| Scoring filter (n4) | 6 |
| Scoring filter (s1) | 2 |
| TOTAL: 4 | 121 |
NoCeM on Spool:
| Id | Good | Bad | Unique | Total |
|---|---|---|---|---|
| bleachbot@httrack.com | 51 | 0 | 53 | 53 |
| TOTAL: 1 | 51 | 0 | 53 | 53 |
Miscellaneous innd statistics [Top 10]:
| Event | Server | Number |
|---|---|---|
| Including strange strings | ||
| i2pn | 620 | |
| TOTAL: 1 | 620 | |
| TOTAL: 1 | 620 | |
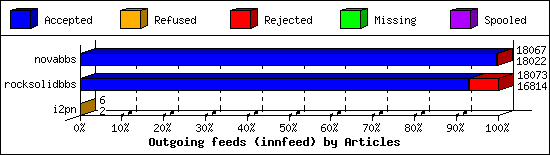
Outgoing Feeds (innfeed) by Articles:
| Server | Offered | Taken | Refused | Reject | Miss | Spool | %Took | Elapsed | |
|---|---|---|---|---|---|---|---|---|---|
| 1 | novabbs | 18069 | 18022 | 0 | 45 | 0 | 0 | 99% | 23:59:52 |
| 2 | rocksolidbbs | 18092 | 16814 | 8 | 1251 | 0 | 0 | 92% | 23:59:58 |
| 3 | i2pn | 6 | 2 | 4 | 0 | 0 | 0 | 33% | 01:00:01 |
| TOTAL: 3 | 36167 | 34838 | 12 | 1296 | 0 | 0 | 96% | 48:59:51 | |
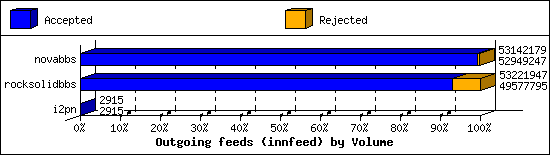
Outgoing Feeds (innfeed) by Volume:
| Server | AcceptVol | RejectVol | TotalVol | Volume/sec | Vol/Art | Elapsed | |
|---|---|---|---|---|---|---|---|
| 1 | novabbs | 50.5 MB | 188.4 KB | 50.7 MB | 0.6 KB/s | 2.9 KB | 23:59:52 |
| 2 | rocksolidbbs | 47.3 MB | 3.5 MB | 50.8 MB | 0.6 KB/s | 2.9 KB | 23:59:58 |
| 3 | i2pn | 2.8 KB | 0.0 KB | 2.8 KB | 0.0 KB/s | 1.4 KB | 01:00:01 |
| TOTAL: 3 | 97.8 MB | 3.7 MB | 101.4 MB | 0.6 KB/s | 2.9 KB | 48:59:51 | |
NNRP readership statistics:
| System | Conn | Arts | Size | Groups | Post | Rej | Elapsed | |
|---|---|---|---|---|---|---|---|---|
| 1 | 107.170.192.139 | 1 | 0 | 0.0 KB | 0 | 0 | 0 | 00:00:09 |
| 2 | worker-18.sfj.corp.censys.io | 1 | 0 | 0.0 KB | 0 | 0 | 0 | 00:00:00 |
| TOTAL: 2 | 2 | 0 | 0.0 KB | 0 | 0 | 0 | 00:00:10 | |
NNRP readership statistics (by domain):
| System | Conn | Arts | Size | Groups | Post | Rej | Elapsed | |
|---|---|---|---|---|---|---|---|---|
| 1 | *.sfj.corp.censys.io | 1 | 0 | 0.0 KB | 0 | 0 | 0 | 00:00:00 |
| 2 | unresolved | 1 | 0 | 0.0 KB | 0 | 0 | 0 | 00:00:09 |
| TOTAL: 2 | 2 | 0 | 0.0 KB | 0 | 0 | 0 | 00:00:10 | |
NNRP total resource statistics [Top 20]:
| System | User(ms) | System(ms) | Idle(ms) | Elapsed |
|---|---|---|---|---|
| 107.170.192.139 | 0.072 | 0.000 | 0.000 | 00:00:09 |
| worker-18.sfj.corp.censys.io | 0.040 | 0.004 | 0.000 | 00:00:00 |
| TOTAL: 2 | 0.112 | 0.004 | 0.000 | 00:00:10 |
NNRP client timeouts [Top 20]:
| System | Conn | Peer |
|---|---|---|
| worker-18.sfj.corp.censys.io | 1 | 1 |
| TOTAL: 1 | 1 | 1 |
