Log entries by program:
| Program name | Lines | %Lines | Size | %Size |
|---|---|---|---|---|
| inn | 15631 | 87.5% | 1.5 MB | 82.8% |
| innd | 1292 | 7.2% | 183.3 KB | 10.1% |
| innfeed | 869 | 4.9% | 123.2 KB | 6.8% |
| nocem | 63 | 0.4% | 6.7 KB | 0.4% |
| nnrpd | 4 | 0.0% | 0.4 KB | 0.0% |
| controlchan | 1 | 0.0% | 0.1 KB | 0.0% |
| TOTAL: 6 | 17860 | 100.0% | 1.8 MB | 100.0% |
History cache:
| Reason | Count | %Count |
|---|---|---|
| Do not exist | 15228 | 98.2% |
| Negative hits | 150 | 1.0% |
| Positive hits | 94 | 0.6% |
| Cache misses | 34 | 0.2% |
| TOTAL: 4 | 15506 | 100.0% |
INND timer:
| Code region | Time | Pct | Invoked | Min(ms) | Avg(ms) | Max(ms) |
|---|---|---|---|---|---|---|
| article cancel | 00:00:00.037 | 0.0% | 136 | 0.000 | 0.272 | 4.000 |
| article cleanup | 00:00:00.074 | 0.0% | 15249 | 0.000 | 0.005 | 0.061 |
| article logging | 00:00:00.372 | 0.0% | 15530 | 0.000 | 0.024 | 0.125 |
| article parse | 00:00:00.219 | 0.0% | 17559 | 0.000 | 0.012 | 0.048 |
| article write | 00:00:02.230 | 0.0% | 15089 | 0.044 | 0.148 | 0.595 |
| artlog/artcncl | 00:00:00.000 | 0.0% | 96 | 0.000 | 0.000 | 0.000 |
| artlog/artwrite | 00:00:00.000 | 0.0% | 0 | 0.000 | 0.000 | 0.000 |
| data move | 00:00:00.008 | 0.0% | 19698 | 0.000 | 0.000 | 0.012 |
| hisgrep/artcncl | 00:00:00.000 | 0.0% | 125 | 0.000 | 0.000 | 0.000 |
| hishave/artcncl | 00:00:00.000 | 0.0% | 136 | 0.000 | 0.000 | 0.000 |
| history grep | 00:00:00.000 | 0.0% | 0 | 0.000 | 0.000 | 0.000 |
| history lookup | 00:00:00.063 | 0.0% | 15409 | 0.000 | 0.004 | 0.036 |
| history sync | 00:00:00.020 | 0.0% | 414 | 0.000 | 0.048 | 0.500 |
| history write | 00:00:00.477 | 0.0% | 15249 | 0.000 | 0.031 | 0.261 |
| hiswrite/artcncl | 00:00:00.000 | 0.0% | 11 | 0.000 | 0.000 | 0.000 |
| idle | 24:00:45.897 | 100.0% | 18197 | 2690.368 | 4750.558 | 13050.196 |
| nntp read | 00:00:00.445 | 0.0% | 17853 | 0.000 | 0.025 | 0.067 |
| overview write | 00:00:03.453 | 0.0% | 15089 | 0.017 | 0.229 | 11.717 |
| perl filter | 00:00:09.644 | 0.0% | 15249 | 0.425 | 0.632 | 1.079 |
| python filter | 00:00:00.000 | 0.0% | 0 | 0.000 | 0.000 | 0.000 |
| site send | 00:00:00.455 | 0.0% | 15147 | 0.000 | 0.030 | 0.102 |
| TOTAL: 24:01:06.052 | 24:01:03.394 | 100.0% | - | - | - | - |
INNfeed timer:
| Code region | Time | Pct | Invoked | Min(ms) | Avg(ms) | Max(ms) |
|---|---|---|---|---|---|---|
| article new | 00:00:00.019 | 0.0% | 15086 | 0.000 | 0.001 | 0.020 |
| article prepare | 00:00:00.008 | 0.0% | 120612 | 0.000 | 0.000 | 0.003 |
| article read | 00:00:00.597 | 0.0% | 15085 | 0.000 | 0.040 | 2.037 |
| backlog stats | 00:00:00.034 | 0.0% | 71771 | 0.000 | 0.000 | 0.006 |
| callbacks | 00:00:00.000 | 0.0% | 0 | 0.000 | 0.000 | 0.000 |
| data read | 00:00:00.335 | 0.0% | 48810 | 0.000 | 0.007 | 0.022 |
| data write | 00:00:00.591 | 0.0% | 33765 | 0.000 | 0.018 | 0.047 |
| idle | 23:58:56.014 | 100.0% | 71771 | 535.708 | 1202.937 | 3171.289 |
| status file | 00:00:00.063 | 0.0% | 202 | 0.000 | 0.312 | 1.000 |
| TOTAL: 23:58:58.725 | 23:58:57.661 | 100.0% | - | - | - | - |
nnrpd timer:
| Code region | Time | Pct | Invoked | Min(ms) | Avg(ms) | Max(ms) |
|---|---|---|---|---|---|---|
| idle | 00:00:09.759 | 98.8% | 1 | 9759.000 | 9759.000 | 9759.000 |
| newnews | 00:00:00.000 | 0.0% | 0 | 0.000 | 0.000 | 0.000 |
| nntpwrite | 00:00:00.001 | 0.0% | 2 | 0.500 | 0.500 | 0.500 |
| TOTAL: 00:00:09.882 | 00:00:09.760 | 98.8% | - | - | - | - |
Control commands to INND:
| Command | Number |
|---|---|
| L | 1 |
| flush | 3 |
| flushlogs | 2 |
| go | 2 |
| logmode | 2 |
| mode | 148 |
| name | 2 |
| pause | 2 |
| paused | 2 |
| reload | 2 |
| reserve | 2 |
| TOTAL: 11 | 168 |
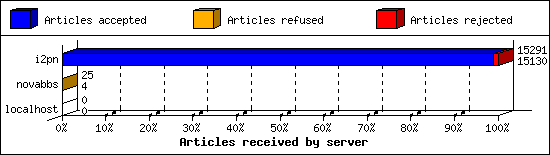
Incoming Feeds (INN):
| Server | Connects | Offered | Taken | Refused | Reject | %Accpt | Elapsed | |
|---|---|---|---|---|---|---|---|---|
| 1 | i2pn | 6 | 15291 | 15130 | 1 | 160 | 98% | 24:52:50 |
| 2 | novabbs | 13 | 25 | 4 | 21 | 0 | 16% | 02:41:15 |
| 3 | localhost | 30 | 0 | 0 | 0 | 0 | 0% | 00:00:00 |
| TOTAL: 3 | 49 | 15316 | 15134 | 22 | 160 | 98% | 27:34:05 | |
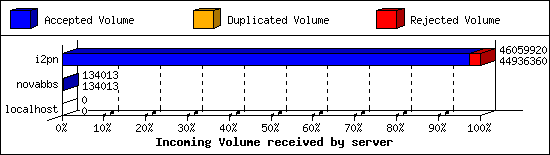
Incoming Volume (INN):
| Server | AcceptVol | DupVol | RejVol | TotalVol | %Acc | Vol/Art | |
|---|---|---|---|---|---|---|---|
| 1 | i2pn | 42.9 MB | 0.0 KB | 1.1 MB | 43.9 MB | 97% | 2.9 KB |
| 2 | novabbs | 130.9 KB | 0.0 KB | 0.0 KB | 130.9 KB | 100% | 32.7 KB |
| 3 | localhost | 0.0 KB | 0.0 KB | 0.0 KB | 0.0 KB | 0% | 0 |
| TOTAL: 3 | 43.0 MB | 0.0 KB | 1.1 MB | 44.1 MB | 97% | 2.9 KB | |
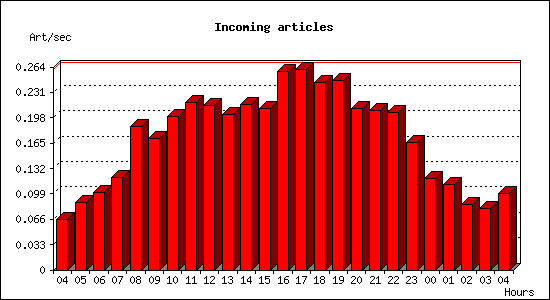
Incoming articles:
| Date | Articles | %Arts | Art/sec | Size | %Size | KB/sec |
|---|---|---|---|---|---|---|
| Mar 30 04:15:01 - 04:59:59 | 176 | 1.2% | 0.07 | 623.0 KB | 1.4% | 0.23 |
| Mar 30 05:00:00 - 05:59:59 | 316 | 2.1% | 0.09 | 928.1 KB | 2.1% | 0.26 |
| Mar 30 06:00:00 - 06:59:59 | 363 | 2.4% | 0.10 | 988.6 KB | 2.3% | 0.27 |
| Mar 30 07:00:00 - 07:59:59 | 431 | 2.9% | 0.12 | 1.2 MB | 2.8% | 0.34 |
| Mar 30 08:00:00 - 08:59:59 | 674 | 4.5% | 0.19 | 1.6 MB | 3.8% | 0.47 |
| Mar 30 09:00:00 - 09:59:59 | 615 | 4.1% | 0.17 | 1.7 MB | 4.0% | 0.49 |
| Mar 30 10:00:00 - 10:59:59 | 720 | 4.8% | 0.20 | 2.7 MB | 6.3% | 0.77 |
| Mar 30 11:00:00 - 11:59:59 | 786 | 5.2% | 0.22 | 2.1 MB | 4.9% | 0.59 |
| Mar 30 12:00:00 - 12:59:59 | 768 | 5.1% | 0.21 | 1.8 MB | 4.3% | 0.52 |
| Mar 30 13:00:00 - 13:59:59 | 729 | 4.8% | 0.20 | 1.8 MB | 4.2% | 0.51 |
| Mar 30 14:00:00 - 14:59:59 | 776 | 5.1% | 0.22 | 2.1 MB | 4.9% | 0.60 |
| Mar 30 15:00:00 - 15:59:59 | 758 | 5.0% | 0.21 | 1.9 MB | 4.5% | 0.55 |
| Mar 30 16:00:00 - 16:59:59 | 928 | 6.1% | 0.26 | 2.6 MB | 6.0% | 0.73 |
| Mar 30 17:00:00 - 17:59:59 | 939 | 6.2% | 0.26 | 2.4 MB | 5.7% | 0.70 |
| Mar 30 18:00:00 - 18:59:59 | 880 | 5.8% | 0.24 | 2.4 MB | 5.6% | 0.68 |
| Mar 30 19:00:00 - 19:59:59 | 885 | 5.9% | 0.25 | 2.8 MB | 6.6% | 0.80 |
| Mar 30 20:00:00 - 20:59:59 | 755 | 5.0% | 0.21 | 2.4 MB | 5.6% | 0.69 |
| Mar 30 21:00:00 - 21:59:59 | 749 | 5.0% | 0.21 | 2.2 MB | 5.1% | 0.62 |
| Mar 30 22:00:00 - 22:59:59 | 736 | 4.9% | 0.20 | 2.2 MB | 5.2% | 0.63 |
| Mar 30 23:00:00 - 23:59:59 | 595 | 3.9% | 0.17 | 1.7 MB | 3.9% | 0.48 |
| Mar 31 00:00:00 - 00:59:59 | 427 | 2.8% | 0.12 | 1.3 MB | 3.0% | 0.37 |
| Mar 31 01:00:00 - 01:59:59 | 401 | 2.7% | 0.11 | 1.2 MB | 2.8% | 0.34 |
| Mar 31 02:00:00 - 02:59:59 | 305 | 2.0% | 0.08 | 900.5 KB | 2.1% | 0.25 |
| Mar 31 03:00:00 - 03:59:59 | 288 | 1.9% | 0.08 | 935.0 KB | 2.1% | 0.26 |
| Mar 31 04:00:00 - 04:15:01 | 90 | 0.6% | 0.10 | 381.0 KB | 0.9% | 0.42 |
| TOTAL: 24:00:00 | 15090 | 100.0% | 0.17 | 42.9 MB | 100.0% | 0.51 |

Sites sending bad articles:
| Server | Total | Group | Dist | Duplic | Unapp | TooOld | Site | Line | Other | |
|---|---|---|---|---|---|---|---|---|---|---|
| 1 | i2pn | 441 | 7 | 0 | 0 | 0 | 0 | 0 | 0 | 434 |
| TOTAL: 1 | 441 | 7 | 0 | 0 | 0 | 0 | 0 | 0 | 434 | |
Unwanted newsgroups [Top 20]:
| Newsgroup | Count |
|---|---|
| alt.2600 | 4 |
| lada.politics | 3 |
| TOTAL: 2 | 7 |
INND Perl filter [Top 20]:
| Reason | Count |
|---|---|
| Scoring filter (s5) | 110 |
| Scoring filter (s6) | 28 |
| Scoring filter (n4) | 15 |
| TOTAL: 3 | 153 |
NoCeM on Spool:
| Id | Good | Bad | Unique | Total |
|---|---|---|---|---|
| bleachbot@httrack.com | 58 | 0 | 59 | 59 |
| TOTAL: 1 | 58 | 0 | 59 | 59 |
Miscellaneous innd statistics [Top 10]:
| Event | Server | Number |
|---|---|---|
| Including strange strings | ||
| i2pn | 281 | |
| TOTAL: 1 | 281 | |
| TOTAL: 1 | 281 | |
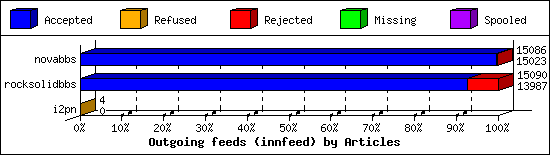
Outgoing Feeds (innfeed) by Articles:
| Server | Offered | Taken | Refused | Reject | Miss | Spool | %Took | Elapsed | |
|---|---|---|---|---|---|---|---|---|---|
| 1 | novabbs | 15090 | 15023 | 2 | 61 | 0 | 0 | 99% | 23:59:53 |
| 2 | rocksolidbbs | 15107 | 13987 | 13 | 1090 | 0 | 0 | 92% | 23:59:58 |
| 3 | i2pn | 5 | 0 | 4 | 0 | 0 | 0 | 0% | 00:45:53 |
| TOTAL: 3 | 30202 | 29010 | 19 | 1151 | 0 | 0 | 96% | 48:45:44 | |
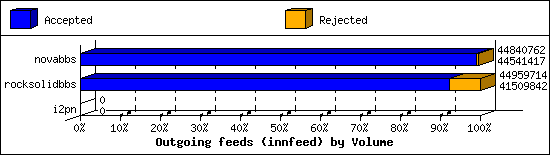
Outgoing Feeds (innfeed) by Volume:
| Server | AcceptVol | RejectVol | TotalVol | Volume/sec | Vol/Art | Elapsed | |
|---|---|---|---|---|---|---|---|
| 1 | novabbs | 42.5 MB | 292.3 KB | 42.8 MB | 0.5 KB/s | 2.9 KB | 23:59:53 |
| 2 | rocksolidbbs | 39.6 MB | 3.3 MB | 42.9 MB | 0.5 KB/s | 2.9 KB | 23:59:58 |
| 3 | i2pn | 0.0 KB | 0.0 KB | 0.0 KB | 0.0 KB/s | 0 | 00:45:53 |
| TOTAL: 3 | 82.1 MB | 3.6 MB | 85.6 MB | 0.5 KB/s | 2.9 KB | 48:45:44 | |
NNRP readership statistics:
| System | Conn | Arts | Size | Groups | Post | Rej | Elapsed | |
|---|---|---|---|---|---|---|---|---|
| 1 | 107.170.200.60 | 1 | 0 | 0.0 KB | 0 | 0 | 0 | 00:00:09 |
| TOTAL: 1 | 1 | 0 | 0.0 KB | 0 | 0 | 0 | 00:00:09 | |
NNRP readership statistics (by domain):
| System | Conn | Arts | Size | Groups | Post | Rej | Elapsed | |
|---|---|---|---|---|---|---|---|---|
| 1 | unresolved | 1 | 0 | 0.0 KB | 0 | 0 | 0 | 00:00:09 |
| TOTAL: 1 | 1 | 0 | 0.0 KB | 0 | 0 | 0 | 00:00:09 | |
NNRP total resource statistics [Top 20]:
| System | User(ms) | System(ms) | Idle(ms) | Elapsed |
|---|---|---|---|---|
| 107.170.200.60 | 0.048 | 0.004 | 0.000 | 00:00:09 |
| TOTAL: 1 | 0.048 | 0.004 | 0.000 | 00:00:09 |
