Log entries by program:
| Program name | Lines | %Lines | Size | %Size |
|---|---|---|---|---|
| inn | 16403 | 88.7% | 1.5 MB | 84.2% |
| innd | 1167 | 6.3% | 168.1 KB | 9.0% |
| innfeed | 850 | 4.6% | 118.6 KB | 6.3% |
| nocem | 43 | 0.2% | 4.5 KB | 0.2% |
| nnrpd | 14 | 0.1% | 1.3 KB | 0.1% |
| controlchan | 13 | 0.1% | 2.8 KB | 0.1% |
| TOTAL: 6 | 18490 | 100.0% | 1.8 MB | 100.0% |
History cache:
| Reason | Count | %Count |
|---|---|---|
| Do not exist | 15930 | 98.6% |
| Negative hits | 162 | 1.0% |
| Positive hits | 58 | 0.4% |
| Cache misses | 10 | 0.1% |
| TOTAL: 4 | 16160 | 100.0% |
INND timer:
| Code region | Time | Pct | Invoked | Min(ms) | Avg(ms) | Max(ms) |
|---|---|---|---|---|---|---|
| article cancel | 00:00:00.022 | 0.0% | 82 | 0.000 | 0.268 | 1.500 |
| article cleanup | 00:00:00.077 | 0.0% | 15961 | 0.000 | 0.005 | 0.041 |
| article logging | 00:00:00.432 | 0.0% | 16338 | 0.000 | 0.026 | 0.077 |
| article parse | 00:00:00.230 | 0.0% | 18234 | 0.000 | 0.013 | 0.063 |
| article write | 00:00:02.858 | 0.0% | 15900 | 0.054 | 0.180 | 0.611 |
| artlog/artcncl | 00:00:00.001 | 0.0% | 67 | 0.000 | 0.015 | 0.333 |
| artlog/artwrite | 00:00:00.000 | 0.0% | 0 | 0.000 | 0.000 | 0.000 |
| data move | 00:00:00.013 | 0.0% | 20319 | 0.000 | 0.001 | 0.022 |
| hisgrep/artcncl | 00:00:00.006 | 0.0% | 74 | 0.000 | 0.081 | 0.500 |
| hishave/artcncl | 00:00:00.000 | 0.0% | 82 | 0.000 | 0.000 | 0.000 |
| history grep | 00:00:00.000 | 0.0% | 0 | 0.000 | 0.000 | 0.000 |
| history lookup | 00:00:00.064 | 0.0% | 16136 | 0.000 | 0.004 | 0.032 |
| history sync | 00:00:00.011 | 0.0% | 415 | 0.000 | 0.027 | 0.667 |
| history write | 00:00:00.480 | 0.0% | 15961 | 0.000 | 0.030 | 0.094 |
| hiswrite/artcncl | 00:00:00.000 | 0.0% | 8 | 0.000 | 0.000 | 0.000 |
| idle | 24:00:44.927 | 100.0% | 18846 | 2199.938 | 4586.911 | 15806.711 |
| nntp read | 00:00:00.447 | 0.0% | 18500 | 0.000 | 0.024 | 0.066 |
| overview write | 00:00:02.134 | 0.0% | 15900 | 0.000 | 0.134 | 1.594 |
| perl filter | 00:00:10.071 | 0.0% | 15961 | 0.476 | 0.631 | 0.909 |
| python filter | 00:00:00.000 | 0.0% | 0 | 0.000 | 0.000 | 0.000 |
| site send | 00:00:00.424 | 0.0% | 15936 | 0.000 | 0.027 | 0.073 |
| TOTAL: 24:01:04.648 | 24:01:02.197 | 100.0% | - | - | - | - |
INNfeed timer:
| Code region | Time | Pct | Invoked | Min(ms) | Avg(ms) | Max(ms) |
|---|---|---|---|---|---|---|
| article new | 00:00:00.020 | 0.0% | 15875 | 0.000 | 0.001 | 0.027 |
| article prepare | 00:00:00.014 | 0.0% | 126980 | 0.000 | 0.000 | 0.002 |
| article read | 00:00:00.626 | 0.0% | 15874 | 0.000 | 0.039 | 1.075 |
| backlog stats | 00:00:00.025 | 0.0% | 69898 | 0.000 | 0.000 | 0.004 |
| callbacks | 00:00:00.000 | 0.0% | 0 | 0.000 | 0.000 | 0.000 |
| data read | 00:00:00.316 | 0.0% | 48732 | 0.000 | 0.006 | 0.024 |
| data write | 00:00:00.572 | 0.0% | 32880 | 0.000 | 0.017 | 0.082 |
| idle | 23:56:56.063 | 100.0% | 69898 | 512.845 | 1233.455 | 4961.174 |
| status file | 00:00:00.077 | 0.0% | 203 | 0.000 | 0.379 | 1.000 |
| TOTAL: 23:56:58.793 | 23:56:57.713 | 100.0% | - | - | - | - |
nnrpd timer:
| Code region | Time | Pct | Invoked | Min(ms) | Avg(ms) | Max(ms) |
|---|---|---|---|---|---|---|
| idle | 00:17:19.247 | 99.9% | 4 | 82.500 | 259811.750 | 519541.000 |
| newnews | 00:00:00.000 | 0.0% | 0 | 0.000 | 0.000 | 0.000 |
| nntpwrite | 00:00:00.000 | 0.0% | 16 | 0.000 | 0.000 | 0.000 |
| TOTAL: 00:17:19.824 | 00:17:19.247 | 99.9% | - | - | - | - |
Control commands to INND:
| Command | Number |
|---|---|
| L | 1 |
| flush | 3 |
| flushlogs | 2 |
| go | 2 |
| logmode | 2 |
| mode | 149 |
| name | 2 |
| pause | 2 |
| paused | 2 |
| reload | 2 |
| reserve | 2 |
| TOTAL: 11 | 169 |
Control Channel:
| Sender | newgroup | rmgroup | Other | Bad PGP | DoIt | OK |
|---|---|---|---|---|---|---|
| usenet@film.rlss.okayama-u.ac.jp | 0 | 0 | 1 | 0 | 1 | 1 |
| TOTAL | 0 | 0 | 1 | 0 | 1 | 1 |
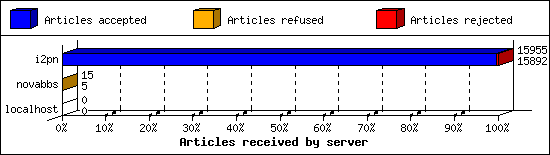
Incoming Feeds (INN):
| Server | Connects | Offered | Taken | Refused | Reject | %Accpt | Elapsed | |
|---|---|---|---|---|---|---|---|---|
| 1 | i2pn | 6 | 15955 | 15892 | 1 | 62 | 99% | 24:39:17 |
| 2 | novabbs | 7 | 15 | 5 | 10 | 0 | 33% | 01:31:37 |
| 3 | localhost | 33 | 0 | 0 | 0 | 0 | 0% | 00:00:00 |
| TOTAL: 3 | 46 | 15970 | 15897 | 11 | 62 | 99% | 26:10:54 | |
Incoming Volume (INN):
| Server | AcceptVol | DupVol | RejVol | TotalVol | %Acc | Vol/Art | |
|---|---|---|---|---|---|---|---|
| 1 | i2pn | 44.4 MB | 0.0 KB | 542.8 KB | 45.0 MB | 98% | 2.9 KB |
| 2 | novabbs | 167.7 KB | 0.0 KB | 0.0 KB | 167.7 KB | 100% | 33.5 KB |
| 3 | localhost | 0.0 KB | 0.0 KB | 0.0 KB | 0.0 KB | 0% | 0 |
| TOTAL: 3 | 44.6 MB | 0.0 KB | 542.8 KB | 45.1 MB | 98% | 2.9 KB | |

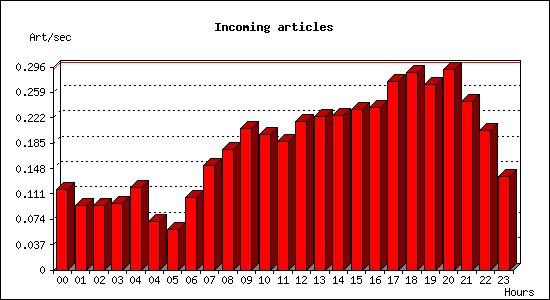
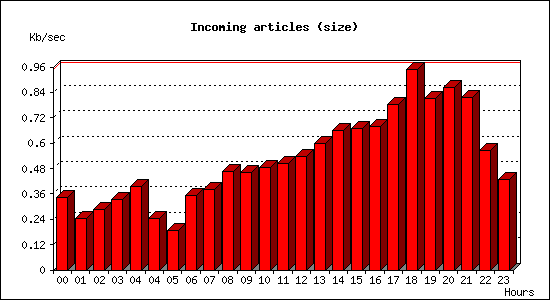
Incoming articles:
| Date | Articles | %Arts | Art/sec | Size | %Size | KB/sec |
|---|---|---|---|---|---|---|
| Mar 31 04:15:01 - 04:59:59 | 189 | 1.2% | 0.07 | 653.1 KB | 1.4% | 0.24 |
| Mar 31 05:00:00 - 05:59:59 | 215 | 1.4% | 0.06 | 664.0 KB | 1.5% | 0.18 |
| Mar 31 06:00:00 - 06:59:59 | 378 | 2.4% | 0.10 | 1.2 MB | 2.8% | 0.35 |
| Mar 31 07:00:00 - 07:59:59 | 550 | 3.5% | 0.15 | 1.3 MB | 3.0% | 0.38 |
| Mar 31 08:00:00 - 08:59:59 | 635 | 4.0% | 0.18 | 1.6 MB | 3.7% | 0.47 |
| Mar 31 09:00:00 - 09:59:59 | 742 | 4.7% | 0.21 | 1.6 MB | 3.6% | 0.46 |
| Mar 31 10:00:00 - 10:59:59 | 709 | 4.5% | 0.20 | 1.7 MB | 3.8% | 0.49 |
| Mar 31 11:00:00 - 11:59:59 | 672 | 4.2% | 0.19 | 1.8 MB | 4.0% | 0.50 |
| Mar 31 12:00:00 - 12:59:59 | 778 | 4.9% | 0.22 | 1.9 MB | 4.2% | 0.54 |
| Mar 31 13:00:00 - 13:59:59 | 807 | 5.1% | 0.22 | 2.1 MB | 4.7% | 0.60 |
| Mar 31 14:00:00 - 14:59:59 | 813 | 5.1% | 0.23 | 2.3 MB | 5.2% | 0.66 |
| Mar 31 15:00:00 - 15:59:59 | 841 | 5.3% | 0.23 | 2.4 MB | 5.3% | 0.67 |
| Mar 31 16:00:00 - 16:59:59 | 855 | 5.4% | 0.24 | 2.4 MB | 5.3% | 0.68 |
| Mar 31 17:00:00 - 17:59:59 | 989 | 6.2% | 0.27 | 2.8 MB | 6.2% | 0.78 |
| Mar 31 18:00:00 - 18:59:59 | 1037 | 6.5% | 0.29 | 3.3 MB | 7.5% | 0.95 |
| Mar 31 19:00:00 - 19:59:59 | 973 | 6.1% | 0.27 | 2.9 MB | 6.4% | 0.81 |
| Mar 31 20:00:00 - 20:59:59 | 1051 | 6.6% | 0.29 | 3.0 MB | 6.8% | 0.86 |
| Mar 31 21:00:00 - 21:59:59 | 883 | 5.6% | 0.25 | 2.9 MB | 6.4% | 0.81 |
| Mar 31 22:00:00 - 22:59:59 | 730 | 4.6% | 0.20 | 2.0 MB | 4.5% | 0.57 |
| Mar 31 23:00:00 - 23:59:59 | 489 | 3.1% | 0.14 | 1.5 MB | 3.4% | 0.43 |
| Apr 1 00:00:00 - 00:59:59 | 425 | 2.7% | 0.12 | 1.2 MB | 2.7% | 0.34 |
| Apr 1 01:00:00 - 01:59:59 | 341 | 2.1% | 0.09 | 873.3 KB | 1.9% | 0.24 |
| Apr 1 02:00:00 - 02:59:59 | 336 | 2.1% | 0.09 | 1.0 MB | 2.3% | 0.29 |
| Apr 1 03:00:00 - 03:59:59 | 350 | 2.2% | 0.10 | 1.2 MB | 2.6% | 0.33 |
| Apr 1 04:00:00 - 04:15:01 | 109 | 0.7% | 0.12 | 354.5 KB | 0.8% | 0.39 |
| TOTAL: 24:00:00 | 15897 | 100.0% | 0.18 | 44.6 MB | 100.0% | 0.53 |
Sites sending bad articles:
| Server | Total | Group | Dist | Duplic | Unapp | TooOld | Site | Line | Other | |
|---|---|---|---|---|---|---|---|---|---|---|
| 1 | i2pn | 440 | 15 | 0 | 0 | 0 | 0 | 0 | 0 | 425 |
| TOTAL: 1 | 440 | 15 | 0 | 0 | 0 | 0 | 0 | 0 | 425 | |
Unwanted newsgroups [Top 20]:
| Newsgroup | Count |
|---|---|
| alt.pl.nieruchomosci.gielda | 11 |
| lada.politics | 4 |
| TOTAL: 2 | 15 |
INND Perl filter [Top 20]:
| Reason | Count |
|---|---|
| Scoring filter (s5) | 29 |
| Scoring filter (s6) | 14 |
| Scoring filter (n4) | 4 |
| TOTAL: 3 | 47 |
NoCeM on Spool:
| Id | Good | Bad | Unique | Total |
|---|---|---|---|---|
| bleachbot@httrack.com | 35 | 0 | 35 | 35 |
| TOTAL: 1 | 35 | 0 | 35 | 35 |
Miscellaneous innd statistics [Top 10]:
| Event | Server | Number |
|---|---|---|
| Including strange strings | ||
| i2pn | 378 | |
| TOTAL: 1 | 378 | |
| TOTAL: 1 | 378 | |
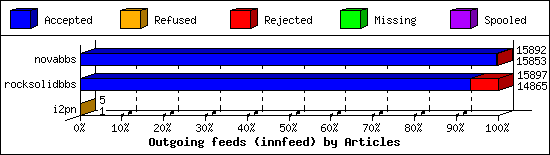
Outgoing Feeds (innfeed) by Articles:
| Server | Offered | Taken | Refused | Reject | Miss | Spool | %Took | Elapsed | |
|---|---|---|---|---|---|---|---|---|---|
| 1 | novabbs | 15894 | 15853 | 0 | 39 | 0 | 0 | 99% | 23:59:55 |
| 2 | rocksolidbbs | 15903 | 14865 | 1 | 1031 | 0 | 0 | 93% | 23:59:57 |
| 3 | i2pn | 5 | 1 | 4 | 0 | 0 | 0 | 20% | 00:40:14 |
| TOTAL: 3 | 31802 | 30719 | 5 | 1070 | 0 | 0 | 96% | 48:40:06 | |
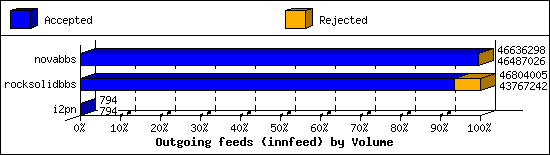
Outgoing Feeds (innfeed) by Volume:
| Server | AcceptVol | RejectVol | TotalVol | Volume/sec | Vol/Art | Elapsed | |
|---|---|---|---|---|---|---|---|
| 1 | novabbs | 44.3 MB | 145.8 KB | 44.5 MB | 0.5 KB/s | 2.9 KB | 23:59:55 |
| 2 | rocksolidbbs | 41.7 MB | 2.9 MB | 44.6 MB | 0.5 KB/s | 2.9 KB | 23:59:57 |
| 3 | i2pn | 0.8 KB | 0.0 KB | 0.8 KB | 0.0 KB/s | 0.8 KB | 00:40:14 |
| TOTAL: 3 | 86.1 MB | 3.0 MB | 89.1 MB | 0.5 KB/s | 2.9 KB | 48:40:06 | |
NNRP readership statistics:
| System | Conn | Arts | Size | Groups | Post | Rej | Elapsed | |
|---|---|---|---|---|---|---|---|---|
| 1 | scan-141.security.ipip.net | 1 | 0 | 0.0 KB | 0 | 0 | 0 | 00:00:00 |
| 2 | 122.224.158.194 | 1 | 0 | 0.0 KB | 0 | 0 | 0 | 00:17:19 |
| TOTAL: 2 | 2 | 0 | 0.0 KB | 0 | 0 | 0 | 00:17:19 | |
NNRP readership statistics (by domain):
| System | Conn | Arts | Size | Groups | Post | Rej | Elapsed | |
|---|---|---|---|---|---|---|---|---|
| 1 | unresolved | 1 | 0 | 0.0 KB | 0 | 0 | 0 | 00:17:19 |
| 2 | *.security.ipip.net | 1 | 0 | 0.0 KB | 0 | 0 | 0 | 00:00:00 |
| TOTAL: 2 | 2 | 0 | 0.0 KB | 0 | 0 | 0 | 00:17:19 | |
NNRP total resource statistics [Top 20]:
| System | User(ms) | System(ms) | Idle(ms) | Elapsed |
|---|---|---|---|---|
| 122.224.158.194 | 0.040 | 0.008 | 0.000 | 00:17:19 |
| scan-141.security.ipip.net | 0.052 | 0.000 | 0.000 | 00:00:00 |
| TOTAL: 2 | 0.092 | 0.008 | 0.000 | 00:17:19 |
NNRP unrecognized commands (by host):
| System | Conn |
|---|---|
| scan-141.security.ipip.net | 4 |
| 122.224.158.194 | 1 |
| TOTAL: 2 | 5 |
NNRP unrecognized commands (by command):
| Command | Count |
|---|---|
| GET / HTTP/1.0 | 1 |
| Connection: close | 1 |
| User-Agent: HTTP Banner Detection (https... | 1 |
| GET / HTTP/1.1 | 1 |
| Host: 157.230.63.40:119 | 1 |
| TOTAL: 5 | 5 |
NNRP client timeouts [Top 20]:
| System | Conn | Peer |
|---|---|---|
| 122.224.158.194 | 2 | 0 |
| TOTAL: 1 | 2 | 0 |
