Log entries by program:
| Program name | Lines | %Lines | Size | %Size |
|---|---|---|---|---|
| inn | 19086 | 88.7% | 1.8 MB | 84.4% |
| innd | 1370 | 6.4% | 194.4 KB | 9.0% |
| innfeed | 976 | 4.5% | 135.4 KB | 6.3% |
| nocem | 70 | 0.3% | 7.5 KB | 0.3% |
| nnrpd | 4 | 0.0% | 0.4 KB | 0.0% |
| controlchan | 1 | 0.0% | 0.1 KB | 0.0% |
| TOTAL: 6 | 21507 | 100.0% | 2.1 MB | 100.0% |
History cache:
| Reason | Count | %Count |
|---|---|---|
| Do not exist | 18322 | 98.3% |
| Negative hits | 177 | 0.9% |
| Positive hits | 110 | 0.6% |
| Cache misses | 23 | 0.1% |
| TOTAL: 4 | 18632 | 100.0% |
INND timer:
| Code region | Time | Pct | Invoked | Min(ms) | Avg(ms) | Max(ms) |
|---|---|---|---|---|---|---|
| article cancel | 00:00:00.042 | 0.0% | 152 | 0.000 | 0.276 | 2.000 |
| article cleanup | 00:00:00.101 | 0.0% | 18389 | 0.000 | 0.005 | 0.027 |
| article logging | 00:00:00.473 | 0.0% | 18964 | 0.000 | 0.025 | 0.071 |
| article parse | 00:00:00.285 | 0.0% | 20642 | 0.000 | 0.014 | 0.074 |
| article write | 00:00:03.161 | 0.0% | 18257 | 0.062 | 0.173 | 0.797 |
| artlog/artcncl | 00:00:00.002 | 0.0% | 115 | 0.000 | 0.017 | 0.333 |
| artlog/artwrite | 00:00:00.000 | 0.0% | 0 | 0.000 | 0.000 | 0.000 |
| data move | 00:00:00.013 | 0.0% | 22849 | 0.000 | 0.001 | 0.013 |
| hisgrep/artcncl | 00:00:00.005 | 0.0% | 137 | 0.000 | 0.036 | 1.000 |
| hishave/artcncl | 00:00:00.000 | 0.0% | 152 | 0.000 | 0.000 | 0.000 |
| history grep | 00:00:00.000 | 0.0% | 0 | 0.000 | 0.000 | 0.000 |
| history lookup | 00:00:00.082 | 0.0% | 18594 | 0.000 | 0.004 | 0.033 |
| history sync | 00:00:00.019 | 0.0% | 417 | 0.000 | 0.046 | 0.667 |
| history write | 00:00:00.591 | 0.0% | 18387 | 0.000 | 0.032 | 0.133 |
| hiswrite/artcncl | 00:00:00.001 | 0.0% | 15 | 0.000 | 0.067 | 1.000 |
| idle | 24:00:48.518 | 100.0% | 21376 | 2328.244 | 4044.186 | 11770.078 |
| nntp read | 00:00:00.527 | 0.0% | 21015 | 0.000 | 0.025 | 0.066 |
| overview write | 00:00:02.707 | 0.0% | 18257 | 0.022 | 0.148 | 1.459 |
| perl filter | 00:00:11.119 | 0.0% | 18387 | 0.455 | 0.605 | 0.824 |
| python filter | 00:00:00.000 | 0.0% | 0 | 0.000 | 0.000 | 0.000 |
| site send | 00:00:00.671 | 0.0% | 18319 | 0.000 | 0.037 | 0.101 |
| TOTAL: 24:01:11.106 | 24:01:08.317 | 100.0% | - | - | - | - |
INNfeed timer:
| Code region | Time | Pct | Invoked | Min(ms) | Avg(ms) | Max(ms) |
|---|---|---|---|---|---|---|
| article new | 00:00:00.027 | 0.0% | 18252 | 0.000 | 0.001 | 0.022 |
| article prepare | 00:00:00.021 | 0.0% | 145740 | 0.000 | 0.000 | 0.002 |
| article read | 00:00:00.677 | 0.0% | 18241 | 0.000 | 0.037 | 0.447 |
| backlog stats | 00:00:00.024 | 0.0% | 83050 | 0.000 | 0.000 | 0.005 |
| callbacks | 00:00:00.000 | 0.0% | 0 | 0.000 | 0.000 | 0.000 |
| data read | 00:00:00.373 | 0.0% | 57652 | 0.000 | 0.006 | 0.023 |
| data write | 00:00:00.659 | 0.0% | 39423 | 0.000 | 0.017 | 0.034 |
| idle | 23:57:04.714 | 100.0% | 83050 | 492.073 | 1038.227 | 3149.401 |
| status file | 00:00:00.111 | 0.0% | 247 | 0.000 | 0.449 | 1.000 |
| TOTAL: 23:57:07.869 | 23:57:06.606 | 100.0% | - | - | - | - |
nnrpd timer:
| Code region | Time | Pct | Invoked | Min(ms) | Avg(ms) | Max(ms) |
|---|---|---|---|---|---|---|
| idle | 00:00:09.849 | 99.2% | 1 | 9849.000 | 9849.000 | 9849.000 |
| newnews | 00:00:00.000 | 0.0% | 0 | 0.000 | 0.000 | 0.000 |
| nntpwrite | 00:00:00.000 | 0.0% | 2 | 0.000 | 0.000 | 0.000 |
| TOTAL: 00:00:09.924 | 00:00:09.849 | 99.2% | - | - | - | - |
Control commands to INND:
| Command | Number |
|---|---|
| L | 1 |
| flush | 3 |
| flushlogs | 2 |
| go | 2 |
| logmode | 2 |
| mode | 149 |
| name | 2 |
| pause | 2 |
| paused | 2 |
| reload | 2 |
| reserve | 2 |
| TOTAL: 11 | 169 |
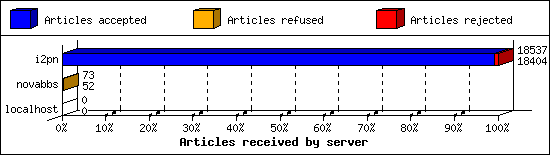
Incoming Feeds (INN):
| Server | Connects | Offered | Taken | Refused | Reject | %Accpt | Elapsed | |
|---|---|---|---|---|---|---|---|---|
| 1 | i2pn | 8 | 18537 | 18404 | 1 | 132 | 99% | 25:29:31 |
| 2 | novabbs | 22 | 73 | 52 | 21 | 0 | 71% | 05:00:39 |
| 3 | localhost | 33 | 0 | 0 | 0 | 0 | 0% | 00:00:00 |
| TOTAL: 3 | 63 | 18610 | 18456 | 22 | 132 | 99% | 30:30:10 | |
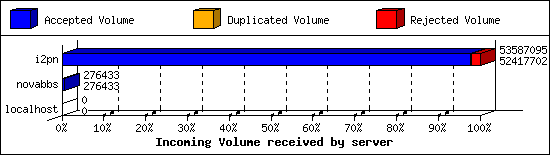
Incoming Volume (INN):
| Server | AcceptVol | DupVol | RejVol | TotalVol | %Acc | Vol/Art | |
|---|---|---|---|---|---|---|---|
| 1 | i2pn | 50.0 MB | 17.2 KB | 1.1 MB | 51.1 MB | 97% | 2.8 KB |
| 2 | novabbs | 270.0 KB | 0.0 KB | 0.0 KB | 270.0 KB | 100% | 5.2 KB |
| 3 | localhost | 0.0 KB | 0.0 KB | 0.0 KB | 0.0 KB | 0% | 0 |
| TOTAL: 3 | 50.3 MB | 17.2 KB | 1.1 MB | 51.4 MB | 97% | 2.8 KB | |
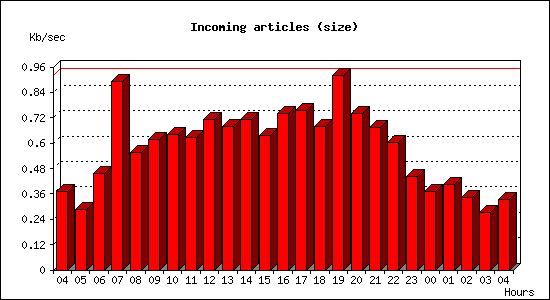
Incoming articles:
| Date | Articles | %Arts | Art/sec | Size | %Size | KB/sec |
|---|---|---|---|---|---|---|
| Apr 4 04:15:01 - 04:59:59 | 272 | 1.5% | 0.10 | 995.6 KB | 2.0% | 0.37 |
| Apr 4 05:00:00 - 05:59:59 | 380 | 2.1% | 0.11 | 1.0 MB | 2.0% | 0.29 |
| Apr 4 06:00:00 - 06:59:59 | 565 | 3.1% | 0.16 | 1.6 MB | 3.2% | 0.46 |
| Apr 4 07:00:00 - 07:59:59 | 927 | 5.1% | 0.26 | 3.1 MB | 6.3% | 0.89 |
| Apr 4 08:00:00 - 08:59:59 | 827 | 4.5% | 0.23 | 2.0 MB | 3.9% | 0.56 |
| Apr 4 09:00:00 - 09:59:59 | 877 | 4.8% | 0.24 | 2.2 MB | 4.4% | 0.62 |
| Apr 4 10:00:00 - 10:59:59 | 931 | 5.1% | 0.26 | 2.3 MB | 4.5% | 0.64 |
| Apr 4 11:00:00 - 11:59:59 | 836 | 4.6% | 0.23 | 2.2 MB | 4.4% | 0.63 |
| Apr 4 12:00:00 - 12:59:59 | 969 | 5.3% | 0.27 | 2.5 MB | 5.0% | 0.71 |
| Apr 4 13:00:00 - 13:59:59 | 959 | 5.2% | 0.27 | 2.4 MB | 4.8% | 0.68 |
| Apr 4 14:00:00 - 14:59:59 | 1008 | 5.5% | 0.28 | 2.5 MB | 5.0% | 0.71 |
| Apr 4 15:00:00 - 15:59:59 | 977 | 5.3% | 0.27 | 2.2 MB | 4.5% | 0.64 |
| Apr 4 16:00:00 - 16:59:59 | 1063 | 5.8% | 0.30 | 2.6 MB | 5.2% | 0.74 |
| Apr 4 17:00:00 - 17:59:59 | 1084 | 5.9% | 0.30 | 2.7 MB | 5.3% | 0.76 |
| Apr 4 18:00:00 - 18:59:59 | 987 | 5.4% | 0.27 | 2.4 MB | 4.8% | 0.68 |
| Apr 4 19:00:00 - 19:59:59 | 1035 | 5.7% | 0.29 | 3.2 MB | 6.5% | 0.92 |
| Apr 4 20:00:00 - 20:59:59 | 867 | 4.7% | 0.24 | 2.6 MB | 5.2% | 0.74 |
| Apr 4 21:00:00 - 21:59:59 | 818 | 4.5% | 0.23 | 2.4 MB | 4.8% | 0.67 |
| Apr 4 22:00:00 - 22:59:59 | 644 | 3.5% | 0.18 | 2.1 MB | 4.3% | 0.60 |
| Apr 4 23:00:00 - 23:59:59 | 549 | 3.0% | 0.15 | 1.6 MB | 3.1% | 0.44 |
| Apr 5 00:00:00 - 00:59:59 | 432 | 2.4% | 0.12 | 1.3 MB | 2.6% | 0.37 |
| Apr 5 01:00:00 - 01:59:59 | 471 | 2.6% | 0.13 | 1.4 MB | 2.9% | 0.41 |
| Apr 5 02:00:00 - 02:59:59 | 370 | 2.0% | 0.10 | 1.2 MB | 2.4% | 0.35 |
| Apr 5 03:00:00 - 03:59:59 | 317 | 1.7% | 0.09 | 979.8 KB | 1.9% | 0.27 |
| Apr 5 04:00:00 - 04:15:01 | 103 | 0.6% | 0.11 | 300.3 KB | 0.6% | 0.33 |
| TOTAL: 24:00:00 | 18268 | 100.0% | 0.21 | 49.7 MB | 100.0% | 0.59 |

Sites sending bad articles:
| Server | Total | Group | Dist | Duplic | Unapp | TooOld | Site | Line | Other | |
|---|---|---|---|---|---|---|---|---|---|---|
| 1 | i2pn | 704 | 3 | 0 | 2 | 0 | 0 | 0 | 0 | 699 |
| TOTAL: 1 | 704 | 3 | 0 | 2 | 0 | 0 | 0 | 0 | 699 | |
Unwanted newsgroups [Top 20]:
| Newsgroup | Count |
|---|---|
| lada.politics | 2 |
| alt.sex.girl | 1 |
| TOTAL: 2 | 3 |
INND Perl filter [Top 20]:
| Reason | Count |
|---|---|
| Scoring filter (s5) | 89 |
| Scoring filter (s6) | 29 |
| Scoring filter (s1) | 3 |
| Scoring filter (n6) | 2 |
| EMP (phl) | 1 |
| TOTAL: 5 | 124 |
NoCeM on Spool:
| Id | Good | Bad | Unique | Total |
|---|---|---|---|---|
| bleachbot@httrack.com | 62 | 0 | 62 | 62 |
| TOTAL: 1 | 62 | 0 | 62 | 62 |
Miscellaneous innd statistics [Top 10]:
| Event | Server | Number |
|---|---|---|
| Including strange strings | ||
| i2pn | 575 | |
| TOTAL: 1 | 575 | |
| TOTAL: 1 | 575 | |
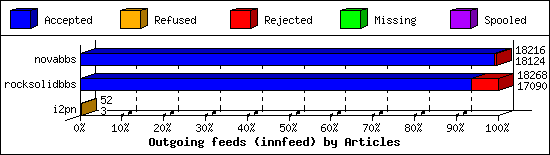
Outgoing Feeds (innfeed) by Articles:
| Server | Offered | Taken | Refused | Reject | Miss | Spool | %Took | Elapsed | |
|---|---|---|---|---|---|---|---|---|---|
| 1 | novabbs | 18220 | 18124 | 2 | 90 | 0 | 0 | 99% | 23:59:58 |
| 2 | rocksolidbbs | 18285 | 17090 | 18 | 1160 | 0 | 0 | 93% | 23:59:58 |
| 3 | i2pn | 53 | 3 | 49 | 0 | 0 | 0 | 5% | 03:52:51 |
| TOTAL: 3 | 36558 | 35217 | 69 | 1250 | 0 | 0 | 96% | 51:52:47 | |
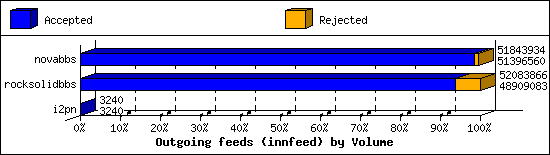
Outgoing Feeds (innfeed) by Volume:
| Server | AcceptVol | RejectVol | TotalVol | Volume/sec | Vol/Art | Elapsed | |
|---|---|---|---|---|---|---|---|
| 1 | novabbs | 49.0 MB | 436.9 KB | 49.4 MB | 0.6 KB/s | 2.8 KB | 23:59:58 |
| 2 | rocksolidbbs | 46.6 MB | 3.0 MB | 49.7 MB | 0.6 KB/s | 2.8 KB | 23:59:58 |
| 3 | i2pn | 3.2 KB | 0.0 KB | 3.2 KB | 0.0 KB/s | 1.1 KB | 03:52:51 |
| TOTAL: 3 | 95.7 MB | 3.5 MB | 99.1 MB | 0.5 KB/s | 2.8 KB | 51:52:47 | |
NNRP readership statistics:
| System | Conn | Arts | Size | Groups | Post | Rej | Elapsed | |
|---|---|---|---|---|---|---|---|---|
| 1 | 107.170.234.219 | 1 | 0 | 0.0 KB | 0 | 0 | 0 | 00:00:09 |
| TOTAL: 1 | 1 | 0 | 0.0 KB | 0 | 0 | 0 | 00:00:09 | |
NNRP readership statistics (by domain):
| System | Conn | Arts | Size | Groups | Post | Rej | Elapsed | |
|---|---|---|---|---|---|---|---|---|
| 1 | unresolved | 1 | 0 | 0.0 KB | 0 | 0 | 0 | 00:00:09 |
| TOTAL: 1 | 1 | 0 | 0.0 KB | 0 | 0 | 0 | 00:00:09 | |
NNRP total resource statistics [Top 20]:
| System | User(ms) | System(ms) | Idle(ms) | Elapsed |
|---|---|---|---|---|
| 107.170.234.219 | 0.044 | 0.000 | 0.000 | 00:00:09 |
| TOTAL: 1 | 0.044 | 0.000 | 0.000 | 00:00:09 |
