
Log entries by program:
| Program name | Lines | %Lines | Size | %Size |
|---|---|---|---|---|
| inn | 16201 | 87.6% | 1.5 MB | 83.0% |
| innd | 1295 | 7.0% | 183.7 KB | 9.8% |
| innfeed | 902 | 4.9% | 125.5 KB | 6.7% |
| nocem | 60 | 0.3% | 5.9 KB | 0.3% |
| nnrpd | 16 | 0.1% | 1.5 KB | 0.1% |
| controlchan | 12 | 0.1% | 2.2 KB | 0.1% |
| pgpverify | 1 | 0.0% | 0.0 KB | 0.0% |
| TOTAL: 7 | 18487 | 100.0% | 1.8 MB | 100.0% |
History cache:
| Reason | Count | %Count |
|---|---|---|
| Do not exist | 15715 | 98.3% |
| Negative hits | 154 | 1.0% |
| Positive hits | 93 | 0.6% |
| Cache misses | 30 | 0.2% |
| TOTAL: 4 | 15992 | 100.0% |
INND timer:
| Code region | Time | Pct | Invoked | Min(ms) | Avg(ms) | Max(ms) |
|---|---|---|---|---|---|---|
| article cancel | 00:00:00.055 | 0.0% | 149 | 0.000 | 0.369 | 6.000 |
| article cleanup | 00:00:00.079 | 0.0% | 15750 | 0.000 | 0.005 | 0.023 |
| article logging | 00:00:00.394 | 0.0% | 16090 | 0.000 | 0.024 | 0.085 |
| article parse | 00:00:00.217 | 0.0% | 17965 | 0.000 | 0.012 | 0.044 |
| article write | 00:00:06.226 | 0.0% | 15606 | 0.044 | 0.399 | 5.955 |
| artlog/artcncl | 00:00:00.003 | 0.0% | 132 | 0.000 | 0.023 | 0.400 |
| artlog/artwrite | 00:00:00.000 | 0.0% | 0 | 0.000 | 0.000 | 0.000 |
| data move | 00:00:00.010 | 0.0% | 19896 | 0.000 | 0.001 | 0.008 |
| hisgrep/artcncl | 00:00:00.007 | 0.0% | 132 | 0.000 | 0.053 | 1.000 |
| hishave/artcncl | 00:00:00.003 | 0.0% | 149 | 0.000 | 0.020 | 0.500 |
| history grep | 00:00:00.000 | 0.0% | 0 | 0.000 | 0.000 | 0.000 |
| history lookup | 00:00:02.306 | 0.0% | 15914 | 0.000 | 0.145 | 3.385 |
| history sync | 00:00:00.013 | 0.0% | 413 | 0.000 | 0.031 | 0.667 |
| history write | 00:00:01.680 | 0.0% | 15750 | 0.000 | 0.107 | 0.946 |
| hiswrite/artcncl | 00:00:00.000 | 0.0% | 17 | 0.000 | 0.000 | 0.000 |
| idle | 24:00:38.400 | 100.0% | 18529 | 2687.821 | 4665.033 | 12784.723 |
| nntp read | 00:00:00.429 | 0.0% | 18182 | 0.000 | 0.024 | 0.075 |
| overview write | 00:00:03.221 | 0.0% | 15606 | 0.044 | 0.206 | 2.176 |
| perl filter | 00:00:09.105 | 0.0% | 15750 | 0.397 | 0.578 | 0.818 |
| python filter | 00:00:00.000 | 0.0% | 0 | 0.000 | 0.000 | 0.000 |
| site send | 00:00:00.320 | 0.0% | 15659 | 0.000 | 0.020 | 0.081 |
| TOTAL: 24:01:04.818 | 24:01:02.468 | 100.0% | - | - | - | - |
INNfeed timer:
| Code region | Time | Pct | Invoked | Min(ms) | Avg(ms) | Max(ms) |
|---|---|---|---|---|---|---|
| article new | 00:00:00.030 | 0.0% | 15578 | 0.000 | 0.002 | 0.025 |
| article prepare | 00:00:00.006 | 0.0% | 124416 | 0.000 | 0.000 | 0.001 |
| article read | 00:00:00.535 | 0.0% | 15577 | 0.000 | 0.034 | 0.457 |
| backlog stats | 00:00:00.023 | 0.0% | 71186 | 0.000 | 0.000 | 0.004 |
| callbacks | 00:00:00.000 | 0.0% | 0 | 0.000 | 0.000 | 0.000 |
| data read | 00:00:00.260 | 0.0% | 48940 | 0.000 | 0.005 | 0.017 |
| data write | 00:00:00.527 | 0.0% | 33507 | 0.000 | 0.016 | 0.053 |
| idle | 23:57:25.332 | 100.0% | 71186 | 503.979 | 1211.549 | 3129.583 |
| status file | 00:00:00.323 | 0.0% | 222 | 0.000 | 1.455 | 189.000 |
| TOTAL: 23:57:27.998 | 23:57:27.036 | 100.0% | - | - | - | - |
nnrpd timer:
| Code region | Time | Pct | Invoked | Min(ms) | Avg(ms) | Max(ms) |
|---|---|---|---|---|---|---|
| idle | 00:00:09.890 | 93.3% | 5 | 74.500 | 1978.000 | 9580.000 |
| newnews | 00:00:00.000 | 0.0% | 0 | 0.000 | 0.000 | 0.000 |
| nntpwrite | 00:00:00.000 | 0.0% | 16 | 0.000 | 0.000 | 0.000 |
| TOTAL: 00:00:10.599 | 00:00:09.890 | 93.3% | - | - | - | - |
Control commands to INND:
| Command | Number |
|---|---|
| L | 1 |
| flush | 3 |
| flushlogs | 2 |
| go | 2 |
| logmode | 2 |
| mode | 149 |
| name | 2 |
| pause | 2 |
| paused | 2 |
| reload | 2 |
| reserve | 2 |
| TOTAL: 11 | 169 |
Control Channel:
| Sender | newgroup | rmgroup | Other | Bad PGP | DoIt | OK |
|---|---|---|---|---|---|---|
| moderator@dana.de | 0 | 0 | 1 | 1 | 0 | 1 |
| TOTAL | 0 | 0 | 1 | 1 | 0 | 1 |
Incoming Feeds (INN):
| Server | Connects | Offered | Taken | Refused | Reject | %Accpt | Elapsed | |
|---|---|---|---|---|---|---|---|---|
| 1 | i2pn | 7 | 15857 | 15711 | 1 | 145 | 99% | 25:06:57 |
| 2 | novabbs | 10 | 22 | 12 | 10 | 0 | 54% | 02:06:24 |
| 3 | localhost | 33 | 0 | 0 | 0 | 0 | 0% | 00:00:00 |
| TOTAL: 3 | 50 | 15879 | 15723 | 11 | 145 | 99% | 27:13:21 | |
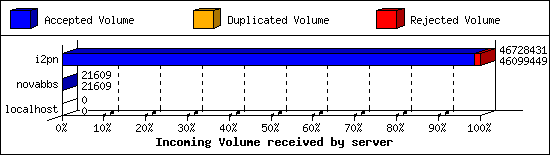
Incoming Volume (INN):
| Server | AcceptVol | DupVol | RejVol | TotalVol | %Acc | Vol/Art | |
|---|---|---|---|---|---|---|---|
| 1 | i2pn | 44.0 MB | 0.0 KB | 614.2 KB | 44.6 MB | 98% | 2.9 KB |
| 2 | novabbs | 21.1 KB | 0.0 KB | 0.0 KB | 21.1 KB | 100% | 1.8 KB |
| 3 | localhost | 0.0 KB | 0.0 KB | 0.0 KB | 0.0 KB | 0% | 0 |
| TOTAL: 3 | 44.0 MB | 0.0 KB | 614.2 KB | 44.6 MB | 98% | 2.9 KB | |
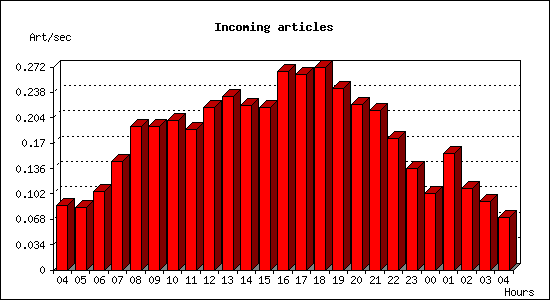
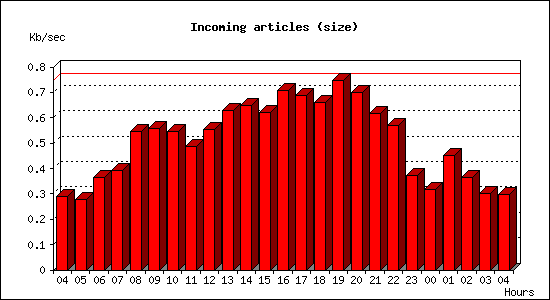
Incoming articles:
| Date | Articles | %Arts | Art/sec | Size | %Size | KB/sec |
|---|---|---|---|---|---|---|
| Apr 6 04:15:01 - 04:59:59 | 234 | 1.5% | 0.09 | 785.6 KB | 1.8% | 0.29 |
| Apr 6 05:00:00 - 05:59:59 | 303 | 1.9% | 0.08 | 999.8 KB | 2.2% | 0.28 |
| Apr 6 06:00:00 - 06:59:59 | 378 | 2.4% | 0.10 | 1.3 MB | 2.9% | 0.36 |
| Apr 6 07:00:00 - 07:59:59 | 523 | 3.4% | 0.15 | 1.4 MB | 3.1% | 0.39 |
| Apr 6 08:00:00 - 08:59:59 | 690 | 4.4% | 0.19 | 1.9 MB | 4.4% | 0.55 |
| Apr 6 09:00:00 - 09:59:59 | 693 | 4.4% | 0.19 | 2.0 MB | 4.5% | 0.56 |
| Apr 6 10:00:00 - 10:59:59 | 721 | 4.6% | 0.20 | 1.9 MB | 4.4% | 0.55 |
| Apr 6 11:00:00 - 11:59:59 | 676 | 4.3% | 0.19 | 1.7 MB | 3.9% | 0.49 |
| Apr 6 12:00:00 - 12:59:59 | 784 | 5.0% | 0.22 | 1.9 MB | 4.5% | 0.55 |
| Apr 6 13:00:00 - 13:59:59 | 839 | 5.4% | 0.23 | 2.2 MB | 5.1% | 0.63 |
| Apr 6 14:00:00 - 14:59:59 | 793 | 5.1% | 0.22 | 2.3 MB | 5.2% | 0.65 |
| Apr 6 15:00:00 - 15:59:59 | 785 | 5.0% | 0.22 | 2.2 MB | 5.0% | 0.62 |
| Apr 6 16:00:00 - 16:59:59 | 959 | 6.2% | 0.27 | 2.5 MB | 5.7% | 0.71 |
| Apr 6 17:00:00 - 17:59:59 | 942 | 6.0% | 0.26 | 2.4 MB | 5.5% | 0.69 |
| Apr 6 18:00:00 - 18:59:59 | 978 | 6.3% | 0.27 | 2.3 MB | 5.3% | 0.66 |
| Apr 6 19:00:00 - 19:59:59 | 876 | 5.6% | 0.24 | 2.6 MB | 6.0% | 0.75 |
| Apr 6 20:00:00 - 20:59:59 | 797 | 5.1% | 0.22 | 2.5 MB | 5.6% | 0.70 |
| Apr 6 21:00:00 - 21:59:59 | 767 | 4.9% | 0.21 | 2.2 MB | 5.0% | 0.62 |
| Apr 6 22:00:00 - 22:59:59 | 633 | 4.1% | 0.18 | 2.0 MB | 4.6% | 0.57 |
| Apr 6 23:00:00 - 23:59:59 | 491 | 3.2% | 0.14 | 1.3 MB | 3.0% | 0.37 |
| Apr 7 00:00:00 - 00:59:59 | 370 | 2.4% | 0.10 | 1.1 MB | 2.5% | 0.32 |
| Apr 7 01:00:00 - 01:59:59 | 564 | 3.6% | 0.16 | 1.6 MB | 3.6% | 0.45 |
| Apr 7 02:00:00 - 02:59:59 | 394 | 2.5% | 0.11 | 1.3 MB | 2.9% | 0.36 |
| Apr 7 03:00:00 - 03:59:59 | 332 | 2.1% | 0.09 | 1.1 MB | 2.4% | 0.30 |
| Apr 7 04:00:00 - 04:15:02 | 64 | 0.4% | 0.07 | 270.1 KB | 0.6% | 0.30 |
| TOTAL: 24:00:01 | 15586 | 100.0% | 0.18 | 43.6 MB | 100.0% | 0.52 |
Sites sending bad articles:
| Server | Total | Group | Dist | Duplic | Unapp | TooOld | Site | Line | Other | |
|---|---|---|---|---|---|---|---|---|---|---|
| 1 | i2pn | 484 | 3 | 0 | 0 | 0 | 0 | 0 | 0 | 481 |
| TOTAL: 1 | 484 | 3 | 0 | 0 | 0 | 0 | 0 | 0 | 481 | |
Unwanted newsgroups [Top 20]:
| Newsgroup | Count |
|---|---|
| lada.politics | 2 |
| hk.politics | 1 |
| TOTAL: 2 | 3 |
INND Perl filter [Top 20]:
| Reason | Count |
|---|---|
| Scoring filter (s5) | 124 |
| Scoring filter (s6) | 17 |
| TOTAL: 2 | 141 |
NoCeM on Spool:
| Id | Good | Bad | Unique | Total |
|---|---|---|---|---|
| bleachbot@httrack.com | 52 | 0 | 56 | 56 |
| TOTAL: 1 | 52 | 0 | 56 | 56 |
Miscellaneous innd statistics [Top 10]:
| Event | Server | Number |
|---|---|---|
| Including strange strings | ||
| i2pn | 340 | |
| TOTAL: 1 | 340 | |
| TOTAL: 1 | 340 | |
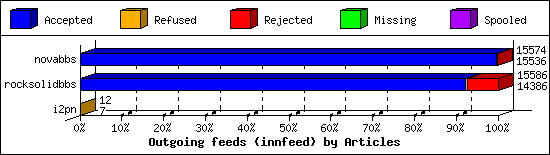
Outgoing Feeds (innfeed) by Articles:
| Server | Offered | Taken | Refused | Reject | Miss | Spool | %Took | Elapsed | |
|---|---|---|---|---|---|---|---|---|---|
| 1 | novabbs | 15577 | 15536 | 1 | 37 | 0 | 0 | 99% | 23:59:56 |
| 2 | rocksolidbbs | 15611 | 14386 | 46 | 1154 | 0 | 0 | 92% | 23:59:59 |
| 3 | i2pn | 12 | 7 | 5 | 0 | 0 | 0 | 58% | 01:20:38 |
| TOTAL: 3 | 31200 | 29929 | 52 | 1191 | 0 | 0 | 95% | 49:20:33 | |
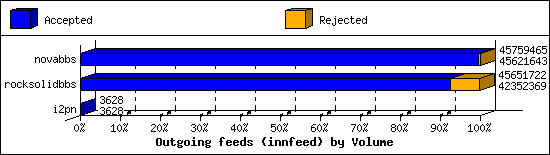
Outgoing Feeds (innfeed) by Volume:
| Server | AcceptVol | RejectVol | TotalVol | Volume/sec | Vol/Art | Elapsed | |
|---|---|---|---|---|---|---|---|
| 1 | novabbs | 43.5 MB | 134.6 KB | 43.6 MB | 0.5 KB/s | 2.9 KB | 23:59:56 |
| 2 | rocksolidbbs | 40.4 MB | 3.1 MB | 43.5 MB | 0.5 KB/s | 2.9 KB | 23:59:59 |
| 3 | i2pn | 3.5 KB | 0.0 KB | 3.5 KB | 0.0 KB/s | 0.5 KB | 01:20:38 |
| TOTAL: 3 | 83.9 MB | 3.3 MB | 87.2 MB | 0.5 KB/s | 2.9 KB | 49:20:33 | |
NNRP readership statistics:
| System | Conn | Arts | Size | Groups | Post | Rej | Elapsed | |
|---|---|---|---|---|---|---|---|---|
| 1 | scan-141.security.ipip.net | 1 | 0 | 0.0 KB | 0 | 0 | 0 | 00:00:00 |
| 2 | worker-18.sfj.corp.censys.io | 1 | 0 | 0.0 KB | 0 | 0 | 0 | 00:00:00 |
| 3 | 107.170.200.70 | 1 | 0 | 0.0 KB | 0 | 0 | 0 | 00:00:09 |
| TOTAL: 3 | 3 | 0 | 0.0 KB | 0 | 0 | 0 | 00:00:10 | |
NNRP readership statistics (by domain):
| System | Conn | Arts | Size | Groups | Post | Rej | Elapsed | |
|---|---|---|---|---|---|---|---|---|
| 1 | unresolved | 1 | 0 | 0.0 KB | 0 | 0 | 0 | 00:00:09 |
| 2 | *.sfj.corp.censys.io | 1 | 0 | 0.0 KB | 0 | 0 | 0 | 00:00:00 |
| 3 | *.security.ipip.net | 1 | 0 | 0.0 KB | 0 | 0 | 0 | 00:00:00 |
| TOTAL: 3 | 3 | 0 | 0.0 KB | 0 | 0 | 0 | 00:00:10 | |
NNRP total resource statistics [Top 20]:
| System | User(ms) | System(ms) | Idle(ms) | Elapsed |
|---|---|---|---|---|
| 107.170.200.70 | 0.040 | 0.004 | 0.000 | 00:00:09 |
| scan-141.security.ipip.net | 0.036 | 0.008 | 0.000 | 00:00:00 |
| worker-18.sfj.corp.censys.io | 0.044 | 0.000 | 0.000 | 00:00:00 |
| TOTAL: 3 | 0.120 | 0.012 | 0.000 | 00:00:10 |
NNRP unrecognized commands (by host):
| System | Conn |
|---|---|
| scan-141.security.ipip.net | 4 |
| TOTAL: 1 | 4 |
NNRP unrecognized commands (by command):
| Command | Count |
|---|---|
| GET / HTTP/1.1 | 1 |
| Host: 157.230.63.40:119 | 1 |
| User-Agent: HTTP Banner Detection (https... | 1 |
| Connection: close | 1 |
| TOTAL: 4 | 4 |
NNRP client timeouts [Top 20]:
| System | Conn | Peer |
|---|---|---|
| worker-18.sfj.corp.censys.io | 1 | 1 |
| TOTAL: 1 | 1 | 1 |
