Log entries by program:
| Program name | Lines | %Lines | Size | %Size |
|---|---|---|---|---|
| inn | 16247 | 88.2% | 1.5 MB | 84.1% |
| innd | 1192 | 6.5% | 170.4 KB | 9.2% |
| innfeed | 953 | 5.2% | 123.2 KB | 6.6% |
| nocem | 30 | 0.2% | 2.8 KB | 0.2% |
| nnrpd | 4 | 0.0% | 0.4 KB | 0.0% |
| controlchan | 1 | 0.0% | 0.0 KB | 0.0% |
| TOTAL: 6 | 18427 | 100.0% | 1.8 MB | 100.0% |
History cache:
| Reason | Count | %Count |
|---|---|---|
| Do not exist | 15612 | 97.6% |
| Negative hits | 320 | 2.0% |
| Positive hits | 46 | 0.3% |
| Cache misses | 14 | 0.1% |
| TOTAL: 4 | 15992 | 100.0% |
INND timer:
| Code region | Time | Pct | Invoked | Min(ms) | Avg(ms) | Max(ms) |
|---|---|---|---|---|---|---|
| article cancel | 00:00:00.034 | 0.0% | 73 | 0.000 | 0.466 | 2.000 |
| article cleanup | 00:00:00.087 | 0.0% | 15642 | 0.000 | 0.006 | 0.030 |
| article logging | 00:00:00.385 | 0.0% | 16150 | 0.000 | 0.024 | 0.085 |
| article parse | 00:00:00.197 | 0.0% | 17750 | 0.000 | 0.011 | 0.056 |
| article write | 00:00:02.720 | 0.0% | 15586 | 0.043 | 0.175 | 2.170 |
| artlog/artcncl | 00:00:00.001 | 0.0% | 73 | 0.000 | 0.014 | 0.100 |
| artlog/artwrite | 00:00:00.000 | 0.0% | 0 | 0.000 | 0.000 | 0.000 |
| data move | 00:00:00.014 | 0.0% | 19854 | 0.000 | 0.001 | 0.010 |
| hisgrep/artcncl | 00:00:00.001 | 0.0% | 68 | 0.000 | 0.015 | 1.000 |
| hishave/artcncl | 00:00:00.002 | 0.0% | 73 | 0.000 | 0.027 | 0.500 |
| history grep | 00:00:00.000 | 0.0% | 0 | 0.000 | 0.000 | 0.000 |
| history lookup | 00:00:00.124 | 0.0% | 15976 | 0.000 | 0.008 | 0.833 |
| history sync | 00:00:00.010 | 0.0% | 379 | 0.000 | 0.026 | 0.667 |
| history write | 00:00:00.491 | 0.0% | 15642 | 0.000 | 0.031 | 0.128 |
| hiswrite/artcncl | 00:00:00.000 | 0.0% | 5 | 0.000 | 0.000 | 0.000 |
| idle | 24:00:32.521 | 100.0% | 18461 | 2077.606 | 4681.898 | 15001.925 |
| nntp read | 00:00:00.397 | 0.0% | 18150 | 0.000 | 0.022 | 0.093 |
| overview write | 00:00:03.222 | 0.0% | 15586 | 0.022 | 0.207 | 5.029 |
| perl filter | 00:00:09.198 | 0.0% | 15642 | 0.439 | 0.588 | 1.922 |
| python filter | 00:00:00.000 | 0.0% | 0 | 0.000 | 0.000 | 0.000 |
| site send | 00:00:00.553 | 0.0% | 15607 | 0.000 | 0.035 | 0.125 |
| TOTAL: 24:00:52.032 | 24:00:49.957 | 100.0% | - | - | - | - |
INNfeed timer:
| Code region | Time | Pct | Invoked | Min(ms) | Avg(ms) | Max(ms) |
|---|---|---|---|---|---|---|
| article new | 00:00:00.037 | 0.0% | 16843 | 0.000 | 0.002 | 0.019 |
| article prepare | 00:00:00.011 | 0.0% | 108436 | 0.000 | 0.000 | 0.002 |
| article read | 00:00:00.572 | 0.0% | 16232 | 0.000 | 0.035 | 0.500 |
| backlog stats | 00:00:00.025 | 0.0% | 69328 | 0.000 | 0.000 | 0.005 |
| callbacks | 00:00:00.000 | 0.0% | 0 | 0.000 | 0.000 | 0.000 |
| data read | 00:00:00.233 | 0.0% | 45909 | 0.000 | 0.005 | 0.027 |
| data write | 00:00:00.463 | 0.0% | 30152 | 0.000 | 0.015 | 0.061 |
| idle | 23:59:22.509 | 100.0% | 69328 | 487.011 | 1245.709 | 4148.407 |
| status file | 00:00:00.207 | 0.0% | 405 | 0.000 | 0.511 | 3.250 |
| TOTAL: 23:59:24.921 | 23:59:24.057 | 100.0% | - | - | - | - |
nnrpd timer:
| Code region | Time | Pct | Invoked | Min(ms) | Avg(ms) | Max(ms) |
|---|---|---|---|---|---|---|
| idle | 00:00:09.726 | 98.2% | 1 | 9726.000 | 9726.000 | 9726.000 |
| newnews | 00:00:00.000 | 0.0% | 0 | 0.000 | 0.000 | 0.000 |
| nntpwrite | 00:00:00.000 | 0.0% | 2 | 0.000 | 0.000 | 0.000 |
| TOTAL: 00:00:09.902 | 00:00:09.726 | 98.2% | - | - | - | - |
Control commands to INND:
| Command | Number |
|---|---|
| L | 1 |
| flush | 3 |
| flushlogs | 2 |
| go | 2 |
| logmode | 2 |
| mode | 149 |
| name | 2 |
| pause | 2 |
| paused | 2 |
| reload | 2 |
| reserve | 2 |
| TOTAL: 11 | 169 |
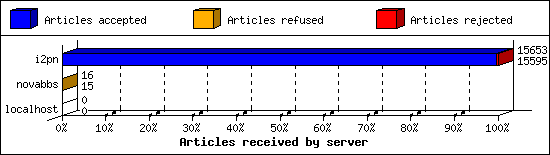
Incoming Feeds (INN):
| Server | Connects | Offered | Taken | Refused | Reject | %Accpt | Elapsed | |
|---|---|---|---|---|---|---|---|---|
| 1 | i2pn | 6 | 15653 | 15595 | 2 | 56 | 99% | 24:29:59 |
| 2 | novabbs | 10 | 16 | 15 | 1 | 0 | 93% | 01:45:51 |
| 3 | localhost | 34 | 0 | 0 | 0 | 0 | 0% | 00:00:00 |
| TOTAL: 3 | 50 | 15669 | 15610 | 3 | 56 | 99% | 26:15:50 | |
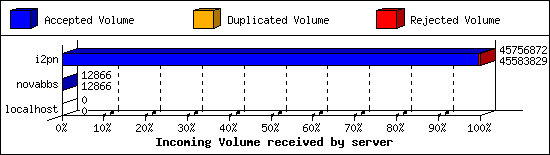
Incoming Volume (INN):
| Server | AcceptVol | DupVol | RejVol | TotalVol | %Acc | Vol/Art | |
|---|---|---|---|---|---|---|---|
| 1 | i2pn | 43.5 MB | 0.0 KB | 169.0 KB | 43.6 MB | 99% | 2.9 KB |
| 2 | novabbs | 12.6 KB | 0.0 KB | 0.0 KB | 12.6 KB | 100% | 0.8 KB |
| 3 | localhost | 0.0 KB | 0.0 KB | 0.0 KB | 0.0 KB | 0% | 0 |
| TOTAL: 3 | 43.5 MB | 0.0 KB | 169.0 KB | 43.6 MB | 99% | 2.9 KB | |
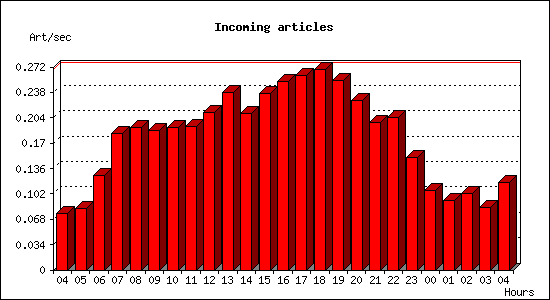
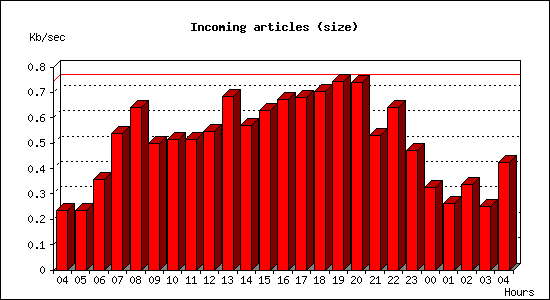
Incoming articles:
| Date | Articles | %Arts | Art/sec | Size | %Size | KB/sec |
|---|---|---|---|---|---|---|
| Apr 7 04:15:02 - 04:59:59 | 204 | 1.3% | 0.08 | 637.5 KB | 1.4% | 0.24 |
| Apr 7 05:00:00 - 05:59:59 | 299 | 1.9% | 0.08 | 849.9 KB | 1.9% | 0.24 |
| Apr 7 06:00:00 - 06:59:59 | 457 | 2.9% | 0.13 | 1.3 MB | 2.9% | 0.36 |
| Apr 7 07:00:00 - 07:59:59 | 659 | 4.2% | 0.18 | 1.9 MB | 4.4% | 0.54 |
| Apr 7 08:00:00 - 08:59:59 | 687 | 4.4% | 0.19 | 2.3 MB | 5.2% | 0.64 |
| Apr 7 09:00:00 - 09:59:59 | 673 | 4.3% | 0.19 | 1.8 MB | 4.0% | 0.50 |
| Apr 7 10:00:00 - 10:59:59 | 686 | 4.4% | 0.19 | 1.8 MB | 4.1% | 0.51 |
| Apr 7 11:00:00 - 11:59:59 | 694 | 4.4% | 0.19 | 1.8 MB | 4.2% | 0.51 |
| Apr 7 12:00:00 - 12:59:59 | 761 | 4.9% | 0.21 | 1.9 MB | 4.4% | 0.55 |
| Apr 7 13:00:00 - 13:59:59 | 856 | 5.5% | 0.24 | 2.4 MB | 5.5% | 0.68 |
| Apr 7 14:00:00 - 14:59:59 | 755 | 4.8% | 0.21 | 2.0 MB | 4.6% | 0.57 |
| Apr 7 15:00:00 - 15:59:59 | 851 | 5.5% | 0.24 | 2.2 MB | 5.1% | 0.63 |
| Apr 7 16:00:00 - 16:59:59 | 908 | 5.8% | 0.25 | 2.4 MB | 5.4% | 0.67 |
| Apr 7 17:00:00 - 17:59:59 | 938 | 6.0% | 0.26 | 2.4 MB | 5.5% | 0.68 |
| Apr 7 18:00:00 - 18:59:59 | 966 | 6.2% | 0.27 | 2.5 MB | 5.7% | 0.71 |
| Apr 7 19:00:00 - 19:59:59 | 916 | 5.9% | 0.25 | 2.6 MB | 6.0% | 0.74 |
| Apr 7 20:00:00 - 20:59:59 | 819 | 5.2% | 0.23 | 2.6 MB | 6.0% | 0.74 |
| Apr 7 21:00:00 - 21:59:59 | 711 | 4.6% | 0.20 | 1.9 MB | 4.3% | 0.53 |
| Apr 7 22:00:00 - 22:59:59 | 735 | 4.7% | 0.20 | 2.3 MB | 5.2% | 0.64 |
| Apr 7 23:00:00 - 23:59:59 | 544 | 3.5% | 0.15 | 1.7 MB | 3.8% | 0.47 |
| Apr 8 00:00:00 - 00:59:59 | 383 | 2.5% | 0.11 | 1.1 MB | 2.6% | 0.33 |
| Apr 8 01:00:00 - 01:59:59 | 333 | 2.1% | 0.09 | 946.0 KB | 2.1% | 0.26 |
| Apr 8 02:00:00 - 02:59:59 | 369 | 2.4% | 0.10 | 1.2 MB | 2.7% | 0.34 |
| Apr 8 03:00:00 - 03:59:59 | 300 | 1.9% | 0.08 | 896.0 KB | 2.0% | 0.25 |
| Apr 8 04:00:00 - 04:15:01 | 106 | 0.7% | 0.12 | 382.9 KB | 0.9% | 0.43 |
| TOTAL: 23:59:59 | 15610 | 100.0% | 0.18 | 43.5 MB | 100.0% | 0.52 |
Sites sending bad articles:
| Server | Total | Group | Dist | Duplic | Unapp | TooOld | Site | Line | Other | |
|---|---|---|---|---|---|---|---|---|---|---|
| 1 | i2pn | 564 | 1 | 0 | 0 | 0 | 0 | 0 | 0 | 563 |
| 2 | novabbs | 1 | 0 | 0 | 0 | 0 | 0 | 0 | 0 | 1 |
| TOTAL: 2 | 565 | 1 | 0 | 0 | 0 | 0 | 0 | 0 | 564 | |
Unwanted newsgroups [Top 20]:
| Newsgroup | Count |
|---|---|
| a.bsu.religion | 1 |
| TOTAL: 1 | 1 |
INND Perl filter [Top 20]:
| Reason | Count |
|---|---|
| Scoring filter (s5) | 44 |
| Scoring filter (s6) | 10 |
| EMP (md5) | 1 |
| Scoring filter (s1) | 1 |
| TOTAL: 4 | 56 |
NoCeM on Spool:
| Id | Good | Bad | Unique | Total |
|---|---|---|---|---|
| bleachbot@httrack.com | 21 | 0 | 21 | 21 |
| TOTAL: 1 | 21 | 0 | 21 | 21 |
Miscellaneous innd statistics [Top 10]:
| Event | Server | Number |
|---|---|---|
| Including strange strings | ||
| i2pn | 508 | |
| TOTAL: 1 | 508 | |
| TOTAL: 1 | 508 | |
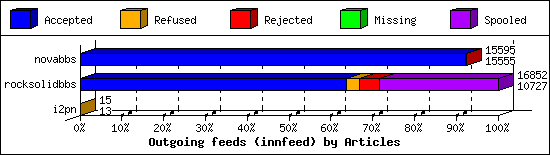
Outgoing Feeds (innfeed) by Articles:
| Server | Offered | Taken | Refused | Reject | Miss | Spool | %Took | Elapsed | |
|---|---|---|---|---|---|---|---|---|---|
| 1 | novabbs | 15597 | 15555 | 1 | 39 | 0 | 0 | 99% | 23:59:57 |
| 2 | rocksolidbbs | 12186 | 10727 | 561 | 782 | 0 | 4782 | 88% | 23:59:57 |
| 3 | i2pn | 16 | 13 | 2 | 0 | 0 | 0 | 81% | 01:36:49 |
| TOTAL: 3 | 27799 | 26295 | 564 | 821 | 0 | 4782 | 94% | 49:36:43 | |
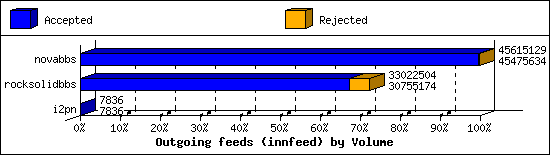
Outgoing Feeds (innfeed) by Volume:
| Server | AcceptVol | RejectVol | TotalVol | Volume/sec | Vol/Art | Elapsed | |
|---|---|---|---|---|---|---|---|
| 1 | novabbs | 43.4 MB | 136.2 KB | 43.5 MB | 0.5 KB/s | 2.9 KB | 23:59:57 |
| 2 | rocksolidbbs | 29.3 MB | 2.2 MB | 31.5 MB | 0.4 KB/s | 2.8 KB | 23:59:57 |
| 3 | i2pn | 7.7 KB | 0.0 KB | 7.7 KB | 0.0 KB/s | 0.6 KB | 01:36:49 |
| TOTAL: 3 | 72.7 MB | 2.3 MB | 75.0 MB | 0.4 KB/s | 2.8 KB | 49:36:43 | |
NNRP readership statistics:
| System | Conn | Arts | Size | Groups | Post | Rej | Elapsed | |
|---|---|---|---|---|---|---|---|---|
| 1 | 162.243.143.147 | 1 | 0 | 0.0 KB | 0 | 0 | 0 | 00:00:09 |
| TOTAL: 1 | 1 | 0 | 0.0 KB | 0 | 0 | 0 | 00:00:09 | |
NNRP readership statistics (by domain):
| System | Conn | Arts | Size | Groups | Post | Rej | Elapsed | |
|---|---|---|---|---|---|---|---|---|
| 1 | unresolved | 1 | 0 | 0.0 KB | 0 | 0 | 0 | 00:00:09 |
| TOTAL: 1 | 1 | 0 | 0.0 KB | 0 | 0 | 0 | 00:00:09 | |
NNRP total resource statistics [Top 20]:
| System | User(ms) | System(ms) | Idle(ms) | Elapsed |
|---|---|---|---|---|
| 162.243.143.147 | 0.044 | 0.004 | 0.000 | 00:00:09 |
| TOTAL: 1 | 0.044 | 0.004 | 0.000 | 00:00:09 |
