
Log entries by program:
| Program name | Lines | %Lines | Size | %Size |
|---|---|---|---|---|
| inn | 19214 | 89.5% | 1.8 MB | 86.1% |
| innd | 1285 | 6.0% | 183.5 KB | 8.5% |
| innfeed | 852 | 4.0% | 102.0 KB | 4.7% |
| nocem | 110 | 0.5% | 11.7 KB | 0.5% |
| nnrpd | 4 | 0.0% | 0.5 KB | 0.0% |
| controlchan | 1 | 0.0% | 0.1 KB | 0.0% |
| TOTAL: 6 | 21466 | 100.0% | 2.1 MB | 100.0% |
History cache:
| Reason | Count | %Count |
|---|---|---|
| Do not exist | 18603 | 97.6% |
| Negative hits | 294 | 1.5% |
| Positive hits | 148 | 0.8% |
| Cache misses | 15 | 0.1% |
| TOTAL: 4 | 19060 | 100.0% |
INND timer:
| Code region | Time | Pct | Invoked | Min(ms) | Avg(ms) | Max(ms) |
|---|---|---|---|---|---|---|
| article cancel | 00:00:00.054 | 0.0% | 223 | 0.000 | 0.242 | 2.000 |
| article cleanup | 00:00:00.103 | 0.0% | 18623 | 0.000 | 0.006 | 0.030 |
| article logging | 00:00:00.409 | 0.0% | 19038 | 0.000 | 0.021 | 0.087 |
| article parse | 00:00:00.235 | 0.0% | 20595 | 0.000 | 0.011 | 0.047 |
| article write | 00:00:06.223 | 0.0% | 18503 | 0.067 | 0.336 | 1.590 |
| artlog/artcncl | 00:00:00.001 | 0.0% | 207 | 0.000 | 0.005 | 0.250 |
| artlog/artwrite | 00:00:00.000 | 0.0% | 0 | 0.000 | 0.000 | 0.000 |
| data move | 00:00:00.012 | 0.0% | 22771 | 0.000 | 0.001 | 0.020 |
| hisgrep/artcncl | 00:00:00.006 | 0.0% | 169 | 0.000 | 0.036 | 1.000 |
| hishave/artcncl | 00:00:00.001 | 0.0% | 223 | 0.000 | 0.004 | 0.200 |
| history grep | 00:00:00.000 | 0.0% | 0 | 0.000 | 0.000 | 0.000 |
| history lookup | 00:00:02.230 | 0.0% | 18944 | 0.000 | 0.118 | 7.962 |
| history sync | 00:00:00.019 | 0.0% | 306 | 0.000 | 0.062 | 1.000 |
| history write | 00:00:02.401 | 0.0% | 18622 | 0.000 | 0.129 | 3.679 |
| hiswrite/artcncl | 00:00:00.006 | 0.0% | 54 | 0.000 | 0.111 | 1.000 |
| idle | 23:59:50.239 | 100.0% | 21326 | 2315.811 | 4050.935 | 10169.814 |
| nntp read | 00:00:00.520 | 0.0% | 21091 | 0.000 | 0.025 | 0.078 |
| overview write | 00:00:03.482 | 0.0% | 18503 | 0.020 | 0.188 | 3.750 |
| perl filter | 00:00:11.131 | 0.0% | 18622 | 0.462 | 0.598 | 2.235 |
| python filter | 00:00:00.000 | 0.0% | 0 | 0.000 | 0.000 | 0.000 |
| site send | 00:00:00.886 | 0.0% | 18606 | 0.000 | 0.048 | 0.119 |
| TOTAL: 24:00:20.689 | 24:00:17.958 | 100.0% | - | - | - | - |
INNfeed timer:
| Code region | Time | Pct | Invoked | Min(ms) | Avg(ms) | Max(ms) |
|---|---|---|---|---|---|---|
| article new | 00:00:00.030 | 0.0% | 20436 | 0.000 | 0.001 | 0.021 |
| article prepare | 00:00:00.009 | 0.0% | 80920 | 0.000 | 0.000 | 0.004 |
| article read | 00:00:02.253 | 0.0% | 20230 | 0.000 | 0.111 | 0.916 |
| backlog stats | 00:00:00.017 | 0.0% | 62430 | 0.000 | 0.000 | 0.005 |
| callbacks | 00:00:00.000 | 0.0% | 0 | 0.000 | 0.000 | 0.000 |
| data read | 00:00:00.244 | 0.0% | 38546 | 0.000 | 0.006 | 0.022 |
| data write | 00:00:00.419 | 0.0% | 20093 | 0.000 | 0.021 | 0.088 |
| idle | 23:57:15.842 | 100.0% | 62430 | 271.174 | 1381.321 | 3536.188 |
| status file | 00:00:00.080 | 0.0% | 236 | 0.000 | 0.339 | 1.000 |
| TOTAL: 23:57:19.798 | 23:57:18.894 | 100.0% | - | - | - | - |
nnrpd timer:
| Code region | Time | Pct | Invoked | Min(ms) | Avg(ms) | Max(ms) |
|---|---|---|---|---|---|---|
| idle | 00:00:00.533 | 9.2% | 2 | 266.500 | 266.500 | 266.500 |
| newnews | 00:00:00.000 | 0.0% | 0 | 0.000 | 0.000 | 0.000 |
| nntpwrite | 00:00:00.000 | 0.0% | 33 | 0.000 | 0.000 | 0.000 |
| TOTAL: 00:00:05.790 | 00:00:00.533 | 9.2% | - | - | - | - |
Control commands to INND:
| Command | Number |
|---|---|
| L | 1 |
| flush | 3 |
| flushlogs | 2 |
| go | 2 |
| logmode | 2 |
| mode | 149 |
| name | 2 |
| pause | 2 |
| paused | 2 |
| reload | 2 |
| reserve | 2 |
| TOTAL: 11 | 169 |
Incoming Feeds (INN):
| Server | Connects | Offered | Taken | Refused | Reject | %Accpt | Elapsed | |
|---|---|---|---|---|---|---|---|---|
| 1 | i2pn | 6 | 18576 | 18456 | 1 | 119 | 99% | 24:27:39 |
| 2 | novabbs | 11 | 26 | 17 | 8 | 1 | 65% | 02:17:43 |
| 3 | localhost | 32 | 0 | 0 | 0 | 0 | 0% | 00:00:00 |
| TOTAL: 3 | 49 | 18602 | 18473 | 9 | 120 | 99% | 26:45:22 | |
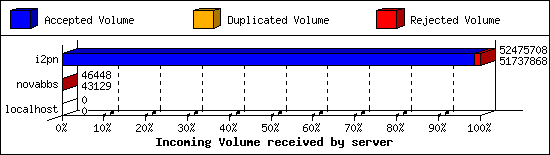
Incoming Volume (INN):
| Server | AcceptVol | DupVol | RejVol | TotalVol | %Acc | Vol/Art | |
|---|---|---|---|---|---|---|---|
| 1 | i2pn | 49.3 MB | 7.9 KB | 712.7 KB | 50.0 MB | 98% | 2.8 KB |
| 2 | novabbs | 42.1 KB | 0.0 KB | 3.2 KB | 45.4 KB | 92% | 2.5 KB |
| 3 | localhost | 0.0 KB | 0.0 KB | 0.0 KB | 0.0 KB | 0% | 0 |
| TOTAL: 3 | 49.4 MB | 7.9 KB | 715.9 KB | 50.1 MB | 98% | 2.8 KB | |
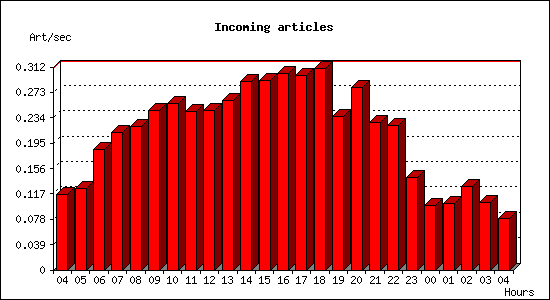
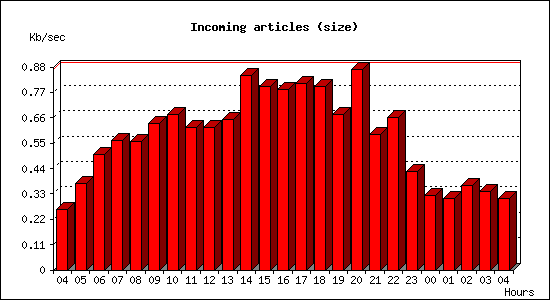
Incoming articles:
| Date | Articles | %Arts | Art/sec | Size | %Size | KB/sec |
|---|---|---|---|---|---|---|
| Apr 8 04:15:01 - 04:59:59 | 313 | 1.7% | 0.12 | 712.2 KB | 1.4% | 0.26 |
| Apr 8 05:00:00 - 05:59:59 | 450 | 2.4% | 0.12 | 1.3 MB | 2.7% | 0.37 |
| Apr 8 06:00:00 - 06:59:59 | 666 | 3.6% | 0.18 | 1.8 MB | 3.6% | 0.50 |
| Apr 8 07:00:00 - 07:59:59 | 760 | 4.1% | 0.21 | 2.0 MB | 4.0% | 0.56 |
| Apr 8 08:00:00 - 08:59:59 | 794 | 4.3% | 0.22 | 2.0 MB | 4.0% | 0.56 |
| Apr 8 09:00:00 - 09:59:59 | 882 | 4.8% | 0.24 | 2.2 MB | 4.5% | 0.63 |
| Apr 8 10:00:00 - 10:59:59 | 920 | 5.0% | 0.26 | 2.4 MB | 4.8% | 0.68 |
| Apr 8 11:00:00 - 11:59:59 | 875 | 4.7% | 0.24 | 2.2 MB | 4.4% | 0.62 |
| Apr 8 12:00:00 - 12:59:59 | 884 | 4.8% | 0.25 | 2.2 MB | 4.4% | 0.62 |
| Apr 8 13:00:00 - 13:59:59 | 940 | 5.1% | 0.26 | 2.3 MB | 4.7% | 0.65 |
| Apr 8 14:00:00 - 14:59:59 | 1041 | 5.6% | 0.29 | 3.0 MB | 6.0% | 0.84 |
| Apr 8 15:00:00 - 15:59:59 | 1050 | 5.7% | 0.29 | 2.8 MB | 5.7% | 0.80 |
| Apr 8 16:00:00 - 16:59:59 | 1087 | 5.9% | 0.30 | 2.8 MB | 5.6% | 0.78 |
| Apr 8 17:00:00 - 17:59:59 | 1078 | 5.8% | 0.30 | 2.8 MB | 5.7% | 0.81 |
| Apr 8 18:00:00 - 18:59:59 | 1117 | 6.0% | 0.31 | 2.8 MB | 5.7% | 0.79 |
| Apr 8 19:00:00 - 19:59:59 | 847 | 4.6% | 0.24 | 2.4 MB | 4.8% | 0.67 |
| Apr 8 20:00:00 - 20:59:59 | 1008 | 5.5% | 0.28 | 3.1 MB | 6.2% | 0.87 |
| Apr 8 21:00:00 - 21:59:59 | 814 | 4.4% | 0.23 | 2.1 MB | 4.2% | 0.59 |
| Apr 8 22:00:00 - 22:59:59 | 799 | 4.3% | 0.22 | 2.3 MB | 4.7% | 0.66 |
| Apr 8 23:00:00 - 23:59:59 | 514 | 2.8% | 0.14 | 1.5 MB | 3.0% | 0.43 |
| Apr 9 00:00:00 - 00:59:59 | 356 | 1.9% | 0.10 | 1.1 MB | 2.3% | 0.32 |
| Apr 9 01:00:00 - 01:59:59 | 369 | 2.0% | 0.10 | 1.1 MB | 2.2% | 0.31 |
| Apr 9 02:00:00 - 02:59:59 | 464 | 2.5% | 0.13 | 1.3 MB | 2.6% | 0.36 |
| Apr 9 03:00:00 - 03:59:59 | 373 | 2.0% | 0.10 | 1.2 MB | 2.4% | 0.34 |
| Apr 9 04:00:00 - 04:15:01 | 72 | 0.4% | 0.08 | 277.9 KB | 0.5% | 0.31 |
| TOTAL: 24:00:00 | 18473 | 100.0% | 0.21 | 49.4 MB | 100.0% | 0.59 |
Sites sending bad articles:
| Server | Total | Group | Dist | Duplic | Unapp | TooOld | Site | Line | Other | |
|---|---|---|---|---|---|---|---|---|---|---|
| 1 | i2pn | 535 | 0 | 0 | 1 | 0 | 0 | 0 | 0 | 534 |
| TOTAL: 1 | 535 | 0 | 0 | 1 | 0 | 0 | 0 | 0 | 534 | |
INND Perl filter [Top 20]:
| Reason | Count |
|---|---|
| Scoring filter (s5) | 85 |
| Scoring filter (s6) | 22 |
| Scoring filter (n4) | 10 |
| Scoring filter (s1) | 1 |
| TOTAL: 4 | 118 |
NoCeM on Spool:
| Id | Good | Bad | Unique | Total |
|---|---|---|---|---|
| bleachbot@httrack.com | 103 | 0 | 114 | 114 |
| TOTAL: 1 | 103 | 0 | 114 | 114 |
Miscellaneous innd statistics [Top 10]:
| Event | Server | Number |
|---|---|---|
| Including strange strings | ||
| i2pn | 416 | |
| TOTAL: 1 | 416 | |
| TOTAL: 1 | 416 | |
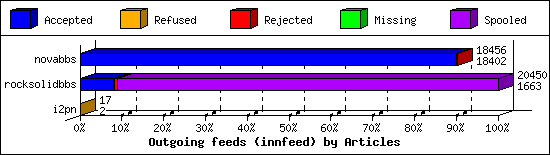
Outgoing Feeds (innfeed) by Articles:
| Server | Offered | Taken | Refused | Reject | Miss | Spool | %Took | Elapsed | |
|---|---|---|---|---|---|---|---|---|---|
| 1 | novabbs | 18459 | 18402 | 1 | 53 | 0 | 0 | 99% | 23:59:58 |
| 2 | rocksolidbbs | 1992 | 1663 | 33 | 115 | 0 | 18639 | 83% | 23:59:58 |
| 3 | i2pn | 18 | 2 | 15 | 0 | 0 | 0 | 11% | 01:40:09 |
| TOTAL: 3 | 20469 | 20067 | 49 | 168 | 0 | 18639 | 98% | 49:40:05 | |
Outgoing Feeds (innfeed) by Volume:
| Server | AcceptVol | RejectVol | TotalVol | Volume/sec | Vol/Art | Elapsed | |
|---|---|---|---|---|---|---|---|
| 1 | novabbs | 49.3 MB | 145.2 KB | 49.4 MB | 0.6 KB/s | 2.7 KB | 23:59:58 |
| 2 | rocksolidbbs | 4.7 MB | 413.1 KB | 5.1 MB | 0.1 KB/s | 3.0 KB | 23:59:58 |
| 3 | i2pn | 3.0 KB | 0.0 KB | 3.0 KB | 0.0 KB/s | 1.5 KB | 01:40:09 |
| TOTAL: 3 | 54.0 MB | 558.3 KB | 54.5 MB | 0.3 KB/s | 2.8 KB | 49:40:05 | |

NNRP readership statistics:
| System | Conn | Arts | Size | Groups | Post | Rej | Elapsed | |
|---|---|---|---|---|---|---|---|---|
| 1 | 125.64.94.201 | 1 | 0 | 0.0 KB | 0 | 0 | 0 | 00:00:05 |
| TOTAL: 1 | 1 | 0 | 0.0 KB | 0 | 0 | 0 | 00:00:05 | |
NNRP readership statistics (by domain):
| System | Conn | Arts | Size | Groups | Post | Rej | Elapsed | |
|---|---|---|---|---|---|---|---|---|
| 1 | unresolved | 1 | 0 | 0.0 KB | 0 | 0 | 0 | 00:00:05 |
| TOTAL: 1 | 1 | 0 | 0.0 KB | 0 | 0 | 0 | 00:00:05 | |
NNRP total resource statistics [Top 20]:
| System | User(ms) | System(ms) | Idle(ms) | Elapsed |
|---|---|---|---|---|
| 125.64.94.201 | 0.040 | 0.008 | 0.000 | 00:00:05 |
| TOTAL: 1 | 0.040 | 0.008 | 0.000 | 00:00:05 |
