Log entries by program:
| Program name | Lines | %Lines | Size | %Size |
|---|---|---|---|---|
| inn | 18646 | 89.5% | 1.7 MB | 85.1% |
| innd | 1200 | 5.8% | 185.3 KB | 8.8% |
| innfeed | 914 | 4.4% | 120.1 KB | 5.7% |
| nocem | 47 | 0.2% | 5.5 KB | 0.3% |
| nnrpd | 15 | 0.1% | 1.5 KB | 0.1% |
| controlchan | 1 | 0.0% | 0.1 KB | 0.0% |
| TOTAL: 6 | 20823 | 100.0% | 2.1 MB | 100.0% |
History cache:
| Reason | Count | %Count |
|---|---|---|
| Do not exist | 17971 | 97.8% |
| Positive hits | 214 | 1.2% |
| Negative hits | 158 | 0.9% |
| Cache misses | 32 | 0.2% |
| TOTAL: 4 | 18375 | 100.0% |
INND timer:
| Code region | Time | Pct | Invoked | Min(ms) | Avg(ms) | Max(ms) |
|---|---|---|---|---|---|---|
| article cancel | 00:00:00.042 | 0.0% | 146 | 0.000 | 0.288 | 2.000 |
| article cleanup | 00:00:00.108 | 0.0% | 17963 | 0.000 | 0.006 | 0.038 |
| article logging | 00:00:00.447 | 0.0% | 18502 | 0.000 | 0.024 | 0.075 |
| article parse | 00:00:00.234 | 0.0% | 20060 | 0.000 | 0.012 | 0.049 |
| article write | 00:00:03.173 | 0.0% | 17837 | 0.051 | 0.178 | 4.727 |
| artlog/artcncl | 00:00:00.000 | 0.0% | 142 | 0.000 | 0.000 | 0.000 |
| artlog/artwrite | 00:00:00.000 | 0.0% | 0 | 0.000 | 0.000 | 0.000 |
| data move | 00:00:00.011 | 0.0% | 22014 | 0.000 | 0.000 | 0.009 |
| hisgrep/artcncl | 00:00:00.005 | 0.0% | 105 | 0.000 | 0.048 | 0.500 |
| hishave/artcncl | 00:00:00.000 | 0.0% | 146 | 0.000 | 0.000 | 0.000 |
| history grep | 00:00:00.000 | 0.0% | 0 | 0.000 | 0.000 | 0.000 |
| history lookup | 00:00:00.083 | 0.0% | 18269 | 0.000 | 0.005 | 0.029 |
| history sync | 00:00:00.011 | 0.0% | 308 | 0.000 | 0.036 | 0.500 |
| history write | 00:00:00.615 | 0.0% | 17955 | 0.000 | 0.034 | 1.030 |
| hiswrite/artcncl | 00:00:00.002 | 0.0% | 41 | 0.000 | 0.049 | 1.000 |
| idle | 23:59:59.916 | 100.0% | 20621 | 2272.572 | 4189.899 | 10909.945 |
| nntp read | 00:00:00.482 | 0.0% | 20386 | 0.000 | 0.024 | 0.070 |
| overview write | 00:00:02.423 | 0.0% | 17837 | 0.000 | 0.136 | 1.375 |
| perl filter | 00:00:10.524 | 0.0% | 17955 | 0.433 | 0.586 | 1.107 |
| python filter | 00:00:00.000 | 0.0% | 0 | 0.000 | 0.000 | 0.000 |
| site send | 00:00:00.317 | 0.0% | 17880 | 0.000 | 0.018 | 0.072 |
| TOTAL: 24:00:20.908 | 24:00:18.393 | 100.0% | - | - | - | - |
INNfeed timer:
| Code region | Time | Pct | Invoked | Min(ms) | Avg(ms) | Max(ms) |
|---|---|---|---|---|---|---|
| article new | 00:00:00.030 | 0.0% | 39840 | 0.000 | 0.001 | 0.032 |
| article prepare | 00:00:00.017 | 0.0% | 210862 | 0.000 | 0.000 | 0.001 |
| article read | 00:00:08.157 | 0.0% | 35225 | 0.000 | 0.232 | 0.434 |
| backlog stats | 00:00:00.022 | 0.0% | 103763 | 0.000 | 0.000 | 0.005 |
| callbacks | 00:00:00.001 | 0.0% | 10 | 0.100 | 0.100 | 0.100 |
| data read | 00:00:00.358 | 0.0% | 70743 | 0.000 | 0.005 | 0.027 |
| data write | 00:00:00.777 | 0.0% | 53114 | 0.000 | 0.015 | 0.047 |
| idle | 23:58:51.902 | 100.0% | 103763 | 26.826 | 832.010 | 3128.896 |
| prepart/cb | 00:00:00.000 | 0.0% | 16 | 0.000 | 0.000 | 0.000 |
| readart/cb | 00:00:00.001 | 0.0% | 4 | 0.250 | 0.250 | 0.250 |
| status file | 00:00:00.075 | 0.0% | 233 | 0.000 | 0.322 | 1.000 |
| TOTAL: 23:59:02.805 | 23:59:01.340 | 100.0% | - | - | - | - |
nnrpd timer:
| Code region | Time | Pct | Invoked | Min(ms) | Avg(ms) | Max(ms) |
|---|---|---|---|---|---|---|
| idle | 00:00:10.183 | 94.7% | 4 | 91.500 | 2545.750 | 9759.000 |
| newnews | 00:00:00.000 | 0.0% | 0 | 0.000 | 0.000 | 0.000 |
| nntpwrite | 00:00:00.000 | 0.0% | 15 | 0.000 | 0.000 | 0.000 |
| TOTAL: 00:00:10.752 | 00:00:10.183 | 94.7% | - | - | - | - |
Control commands to INND:
| Command | Number |
|---|---|
| L | 1 |
| flush | 3 |
| flushlogs | 2 |
| go | 2 |
| logmode | 2 |
| mode | 149 |
| name | 2 |
| pause | 2 |
| paused | 2 |
| reload | 2 |
| reserve | 2 |
| TOTAL: 11 | 169 |
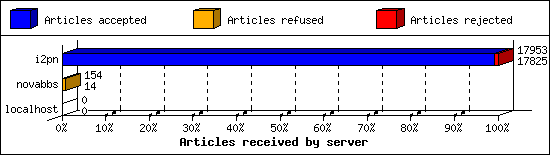
Incoming Feeds (INN):
| Server | Connects | Offered | Taken | Refused | Reject | %Accpt | Elapsed | |
|---|---|---|---|---|---|---|---|---|
| 1 | i2pn | 5 | 17953 | 17825 | 1 | 127 | 99% | 24:32:11 |
| 2 | novabbs | 9 | 154 | 14 | 140 | 0 | 9% | 02:06:40 |
| 3 | localhost | 29 | 0 | 0 | 0 | 0 | 0% | 00:00:00 |
| TOTAL: 3 | 43 | 18107 | 17839 | 141 | 127 | 98% | 26:38:51 | |
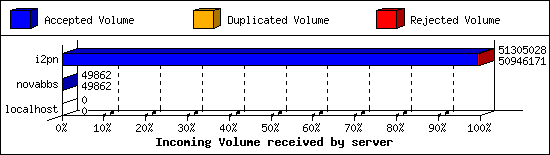
Incoming Volume (INN):
| Server | AcceptVol | DupVol | RejVol | TotalVol | %Acc | Vol/Art | |
|---|---|---|---|---|---|---|---|
| 1 | i2pn | 48.6 MB | 19.3 KB | 331.2 KB | 48.9 MB | 99% | 2.8 KB |
| 2 | novabbs | 48.7 KB | 0.0 KB | 0.0 KB | 48.7 KB | 100% | 3.5 KB |
| 3 | localhost | 0.0 KB | 0.0 KB | 0.0 KB | 0.0 KB | 0% | 0 |
| TOTAL: 3 | 48.6 MB | 19.3 KB | 331.2 KB | 49.0 MB | 99% | 2.8 KB | |
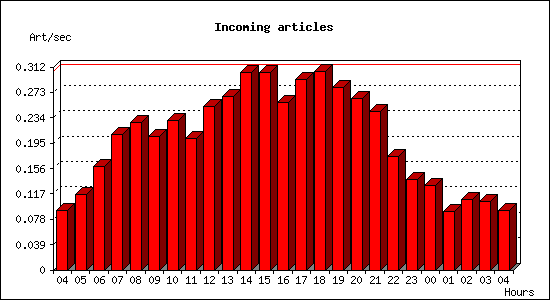
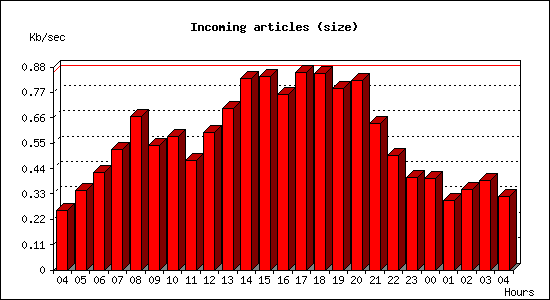
Incoming articles:
| Date | Articles | %Arts | Art/sec | Size | %Size | KB/sec |
|---|---|---|---|---|---|---|
| Apr 9 04:15:01 - 04:59:59 | 246 | 1.4% | 0.09 | 693.9 KB | 1.4% | 0.26 |
| Apr 9 05:00:00 - 05:59:59 | 417 | 2.3% | 0.12 | 1.2 MB | 2.5% | 0.34 |
| Apr 9 06:00:00 - 06:59:59 | 571 | 3.2% | 0.16 | 1.5 MB | 3.0% | 0.42 |
| Apr 9 07:00:00 - 07:59:59 | 751 | 4.2% | 0.21 | 1.8 MB | 3.8% | 0.52 |
| Apr 9 08:00:00 - 08:59:59 | 817 | 4.6% | 0.23 | 2.3 MB | 4.8% | 0.67 |
| Apr 9 09:00:00 - 09:59:59 | 741 | 4.2% | 0.21 | 1.9 MB | 3.9% | 0.54 |
| Apr 9 10:00:00 - 10:59:59 | 828 | 4.6% | 0.23 | 2.0 MB | 4.2% | 0.58 |
| Apr 9 11:00:00 - 11:59:59 | 727 | 4.1% | 0.20 | 1.7 MB | 3.4% | 0.48 |
| Apr 9 12:00:00 - 12:59:59 | 906 | 5.1% | 0.25 | 2.1 MB | 4.3% | 0.60 |
| Apr 9 13:00:00 - 13:59:59 | 962 | 5.4% | 0.27 | 2.5 MB | 5.1% | 0.70 |
| Apr 9 14:00:00 - 14:59:59 | 1094 | 6.1% | 0.30 | 2.9 MB | 6.0% | 0.83 |
| Apr 9 15:00:00 - 15:59:59 | 1095 | 6.1% | 0.30 | 3.0 MB | 6.1% | 0.84 |
| Apr 9 16:00:00 - 16:59:59 | 929 | 5.2% | 0.26 | 2.7 MB | 5.5% | 0.76 |
| Apr 9 17:00:00 - 17:59:59 | 1055 | 5.9% | 0.29 | 3.0 MB | 6.2% | 0.86 |
| Apr 9 18:00:00 - 18:59:59 | 1097 | 6.1% | 0.30 | 3.0 MB | 6.2% | 0.85 |
| Apr 9 19:00:00 - 19:59:59 | 1009 | 5.7% | 0.28 | 2.8 MB | 5.7% | 0.79 |
| Apr 9 20:00:00 - 20:59:59 | 950 | 5.3% | 0.26 | 2.9 MB | 6.0% | 0.82 |
| Apr 9 21:00:00 - 21:59:59 | 875 | 4.9% | 0.24 | 2.2 MB | 4.6% | 0.64 |
| Apr 9 22:00:00 - 22:59:59 | 626 | 3.5% | 0.17 | 1.7 MB | 3.6% | 0.50 |
| Apr 9 23:00:00 - 23:59:59 | 499 | 2.8% | 0.14 | 1.4 MB | 2.9% | 0.40 |
| Apr 10 00:00:00 - 00:59:59 | 470 | 2.6% | 0.13 | 1.4 MB | 2.9% | 0.40 |
| Apr 10 01:00:00 - 01:59:59 | 325 | 1.8% | 0.09 | 1.1 MB | 2.2% | 0.30 |
| Apr 10 02:00:00 - 02:59:59 | 390 | 2.2% | 0.11 | 1.2 MB | 2.5% | 0.35 |
| Apr 10 03:00:00 - 03:59:59 | 377 | 2.1% | 0.10 | 1.4 MB | 2.8% | 0.39 |
| Apr 10 04:00:00 - 04:15:02 | 82 | 0.5% | 0.09 | 286.3 KB | 0.6% | 0.32 |
| TOTAL: 24:00:01 | 17839 | 100.0% | 0.21 | 48.6 MB | 100.0% | 0.58 |
Sites sending bad articles:
| Server | Total | Group | Dist | Duplic | Unapp | TooOld | Site | Line | Other | |
|---|---|---|---|---|---|---|---|---|---|---|
| 1 | i2pn | 664 | 2 | 0 | 8 | 0 | 0 | 0 | 0 | 654 |
| 2 | novabbs | 1 | 0 | 0 | 0 | 0 | 0 | 0 | 0 | 1 |
| TOTAL: 2 | 665 | 2 | 0 | 8 | 0 | 0 | 0 | 0 | 655 | |
Unwanted newsgroups [Top 20]:
| Newsgroup | Count |
|---|---|
| alt.2600.warez | 1 |
| hk.politics | 1 |
| TOTAL: 2 | 2 |
INND Perl filter [Top 20]:
| Reason | Count |
|---|---|
| Scoring filter (s5) | 97 |
| Scoring filter (s6) | 13 |
| Scoring filter (n4) | 6 |
| Scoring filter (n6) | 1 |
| TOTAL: 4 | 117 |
NoCeM on Spool:
| Id | Good | Bad | Unique | Total |
|---|---|---|---|---|
| bleachbot@httrack.com | 43 | 0 | 51 | 51 |
| TOTAL: 1 | 43 | 0 | 51 | 51 |
Miscellaneous innd statistics [Top 10]:
| Event | Server | Number |
|---|---|---|
| Including strange strings | ||
| i2pn | 537 | |
| novabbs | 1 | |
| TOTAL: 2 | 538 | |
| TOTAL: 1 | 538 | |
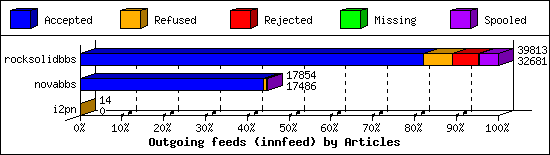
Outgoing Feeds (innfeed) by Articles:
| Server | Offered | Taken | Refused | Reject | Miss | Spool | %Took | Elapsed | |
|---|---|---|---|---|---|---|---|---|---|
| 1 | rocksolidbbs | 39916 | 32681 | 2831 | 2464 | 65 | 1772 | 81% | 23:59:58 |
| 2 | novabbs | 17911 | 17486 | 279 | 60 | 0 | 29 | 97% | 23:59:58 |
| 3 | i2pn | 15 | 0 | 14 | 0 | 0 | 0 | 0% | 01:20:14 |
| TOTAL: 3 | 57842 | 50167 | 3124 | 2524 | 65 | 1801 | 86% | 49:20:10 | |
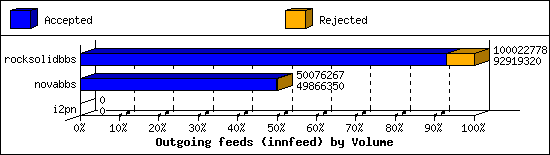
Outgoing Feeds (innfeed) by Volume:
| Server | AcceptVol | RejectVol | TotalVol | Volume/sec | Vol/Art | Elapsed | |
|---|---|---|---|---|---|---|---|
| 1 | rocksolidbbs | 88.6 MB | 6.8 MB | 95.4 MB | 1.1 KB/s | 2.8 KB | 23:59:58 |
| 2 | novabbs | 47.6 MB | 205.0 KB | 47.8 MB | 0.6 KB/s | 2.8 KB | 23:59:58 |
| 3 | i2pn | 0.0 KB | 0.0 KB | 0.0 KB | 0.0 KB/s | 0 | 01:20:14 |
| TOTAL: 3 | 136.2 MB | 7.0 MB | 143.1 MB | 0.8 KB/s | 2.8 KB | 49:20:10 | |
NNRP readership statistics:
| System | Conn | Arts | Size | Groups | Post | Rej | Elapsed | |
|---|---|---|---|---|---|---|---|---|
| 1 | scan-141.security.ipip.net | 1 | 0 | 0.0 KB | 0 | 0 | 0 | 00:00:00 |
| 2 | 107.170.251.62 | 1 | 0 | 0.0 KB | 0 | 0 | 0 | 00:00:09 |
| 3 | 106.75.3.52 | 1 | 0 | 0.0 KB | 0 | 0 | 0 | 00:00:00 |
| TOTAL: 3 | 3 | 0 | 0.0 KB | 0 | 0 | 0 | 00:00:10 | |
NNRP readership statistics (by domain):
| System | Conn | Arts | Size | Groups | Post | Rej | Elapsed | |
|---|---|---|---|---|---|---|---|---|
| 1 | *.security.ipip.net | 1 | 0 | 0.0 KB | 0 | 0 | 0 | 00:00:00 |
| 2 | unresolved | 2 | 0 | 0.0 KB | 0 | 0 | 0 | 00:00:10 |
| TOTAL: 2 | 3 | 0 | 0.0 KB | 0 | 0 | 0 | 00:00:10 | |
NNRP total resource statistics [Top 20]:
| System | User(ms) | System(ms) | Idle(ms) | Elapsed |
|---|---|---|---|---|
| 107.170.251.62 | 0.040 | 0.008 | 0.000 | 00:00:09 |
| scan-141.security.ipip.net | 0.040 | 0.004 | 0.000 | 00:00:00 |
| 106.75.3.52 | 0.044 | 0.000 | 0.000 | 00:00:00 |
| TOTAL: 3 | 0.124 | 0.012 | 0.000 | 00:00:10 |
NNRP unrecognized commands (by host):
| System | Conn |
|---|---|
| scan-141.security.ipip.net | 4 |
| TOTAL: 1 | 4 |
NNRP unrecognized commands (by command):
| Command | Count |
|---|---|
| User-Agent: HTTP Banner Detection (https... | 1 |
| Host: 157.230.63.40:119 | 1 |
| GET / HTTP/1.1 | 1 |
| Connection: close | 1 |
| TOTAL: 4 | 4 |
