Log entries by program:
| Program name | Lines | %Lines | Size | %Size |
|---|---|---|---|---|
| inn | 18598 | 89.3% | 1.7 MB | 85.1% |
| innd | 1280 | 6.1% | 181.8 KB | 8.7% |
| innfeed | 857 | 4.1% | 120.1 KB | 5.7% |
| nocem | 92 | 0.4% | 10.0 KB | 0.5% |
| nnrpd | 4 | 0.0% | 0.5 KB | 0.0% |
| controlchan | 1 | 0.0% | 0.1 KB | 0.0% |
| TOTAL: 6 | 20832 | 100.0% | 2.1 MB | 100.0% |
History cache:
| Reason | Count | %Count |
|---|---|---|
| Do not exist | 18051 | 97.6% |
| Negative hits | 313 | 1.7% |
| Positive hits | 104 | 0.6% |
| Cache misses | 18 | 0.1% |
| TOTAL: 4 | 18486 | 100.0% |
INND timer:
| Code region | Time | Pct | Invoked | Min(ms) | Avg(ms) | Max(ms) |
|---|---|---|---|---|---|---|
| article cancel | 00:00:00.036 | 0.0% | 178 | 0.000 | 0.202 | 1.667 |
| article cleanup | 00:00:00.080 | 0.0% | 18028 | 0.000 | 0.004 | 0.037 |
| article logging | 00:00:00.466 | 0.0% | 18450 | 0.000 | 0.025 | 0.108 |
| article parse | 00:00:00.251 | 0.0% | 20228 | 0.000 | 0.012 | 0.106 |
| article write | 00:00:03.211 | 0.0% | 17888 | 0.071 | 0.180 | 2.306 |
| artlog/artcncl | 00:00:00.003 | 0.0% | 144 | 0.000 | 0.021 | 0.500 |
| artlog/artwrite | 00:00:00.000 | 0.0% | 0 | 0.000 | 0.000 | 0.000 |
| data move | 00:00:00.009 | 0.0% | 22411 | 0.000 | 0.000 | 0.009 |
| hisgrep/artcncl | 00:00:00.003 | 0.0% | 125 | 0.000 | 0.024 | 0.250 |
| hishave/artcncl | 00:00:00.000 | 0.0% | 178 | 0.000 | 0.000 | 0.000 |
| history grep | 00:00:00.000 | 0.0% | 0 | 0.000 | 0.000 | 0.000 |
| history lookup | 00:00:00.068 | 0.0% | 18351 | 0.000 | 0.004 | 0.031 |
| history sync | 00:00:00.015 | 0.0% | 305 | 0.000 | 0.049 | 1.000 |
| history write | 00:00:00.566 | 0.0% | 18028 | 0.000 | 0.031 | 0.143 |
| hiswrite/artcncl | 00:00:00.002 | 0.0% | 53 | 0.000 | 0.038 | 0.333 |
| idle | 23:59:58.629 | 100.0% | 20941 | 2158.299 | 4125.812 | 12503.583 |
| nntp read | 00:00:00.475 | 0.0% | 20710 | 0.000 | 0.023 | 0.084 |
| overview write | 00:00:03.473 | 0.0% | 17888 | 0.000 | 0.194 | 3.490 |
| perl filter | 00:00:10.419 | 0.0% | 18028 | 0.426 | 0.578 | 0.783 |
| python filter | 00:00:00.000 | 0.0% | 0 | 0.000 | 0.000 | 0.000 |
| site send | 00:00:00.306 | 0.0% | 17973 | 0.000 | 0.017 | 0.058 |
| TOTAL: 24:00:20.715 | 24:00:18.012 | 100.0% | - | - | - | - |
INNfeed timer:
| Code region | Time | Pct | Invoked | Min(ms) | Avg(ms) | Max(ms) |
|---|---|---|---|---|---|---|
| article new | 00:00:00.021 | 0.0% | 17923 | 0.000 | 0.001 | 0.018 |
| article prepare | 00:00:00.011 | 0.0% | 142700 | 0.000 | 0.000 | 0.002 |
| article read | 00:00:00.608 | 0.0% | 17877 | 0.000 | 0.034 | 0.902 |
| backlog stats | 00:00:00.023 | 0.0% | 86296 | 0.000 | 0.000 | 0.004 |
| callbacks | 00:00:00.000 | 0.0% | 0 | 0.000 | 0.000 | 0.000 |
| data read | 00:00:00.288 | 0.0% | 58913 | 0.000 | 0.005 | 0.018 |
| data write | 00:00:00.610 | 0.0% | 41099 | 0.000 | 0.015 | 0.038 |
| idle | 23:57:31.718 | 100.0% | 86296 | 539.813 | 999.487 | 3432.194 |
| status file | 00:00:00.074 | 0.0% | 202 | 0.000 | 0.366 | 13.000 |
| TOTAL: 23:57:34.354 | 23:57:33.353 | 100.0% | - | - | - | - |
nnrpd timer:
| Code region | Time | Pct | Invoked | Min(ms) | Avg(ms) | Max(ms) |
|---|---|---|---|---|---|---|
| idle | 00:00:09.749 | 98.3% | 1 | 9749.000 | 9749.000 | 9749.000 |
| newnews | 00:00:00.000 | 0.0% | 0 | 0.000 | 0.000 | 0.000 |
| nntpwrite | 00:00:00.000 | 0.0% | 2 | 0.000 | 0.000 | 0.000 |
| TOTAL: 00:00:09.913 | 00:00:09.749 | 98.3% | - | - | - | - |
Control commands to INND:
| Command | Number |
|---|---|
| L | 1 |
| flush | 3 |
| flushlogs | 2 |
| go | 2 |
| logmode | 2 |
| mode | 149 |
| name | 2 |
| pause | 2 |
| paused | 2 |
| reload | 2 |
| reserve | 2 |
| TOTAL: 11 | 169 |
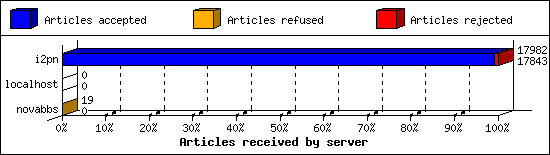
Incoming Feeds (INN):
| Server | Connects | Offered | Taken | Refused | Reject | %Accpt | Elapsed | |
|---|---|---|---|---|---|---|---|---|
| 1 | i2pn | 6 | 17982 | 17843 | 0 | 139 | 99% | 24:24:04 |
| 2 | localhost | 32 | 0 | 0 | 0 | 0 | 0% | 00:00:00 |
| 3 | novabbs | 6 | 19 | 0 | 19 | 0 | 0% | 01:29:18 |
| TOTAL: 3 | 44 | 18001 | 17843 | 19 | 139 | 99% | 25:53:22 | |
Incoming Volume (INN):
| Server | AcceptVol | DupVol | RejVol | TotalVol | %Acc | Vol/Art | |
|---|---|---|---|---|---|---|---|
| 1 | i2pn | 48.8 MB | 0.0 KB | 1.1 MB | 49.9 MB | 97% | 2.8 KB |
| 2 | localhost | 0.0 KB | 0.0 KB | 0.0 KB | 0.0 KB | 0% | 0 |
| 3 | novabbs | 0.0 KB | 0.0 KB | 0.0 KB | 0.0 KB | 0% | 0 |
| TOTAL: 3 | 48.8 MB | 0.0 KB | 1.1 MB | 49.9 MB | 97% | 2.8 KB | |

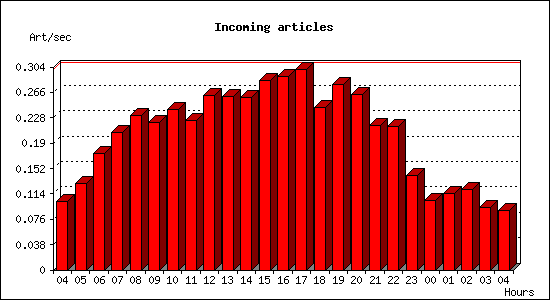
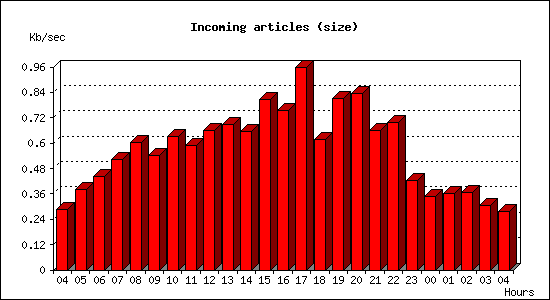
Incoming articles:
| Date | Articles | %Arts | Art/sec | Size | %Size | KB/sec |
|---|---|---|---|---|---|---|
| Apr 10 04:15:02 - 04:59:59 | 276 | 1.5% | 0.10 | 765.9 KB | 1.5% | 0.28 |
| Apr 10 05:00:00 - 05:59:59 | 465 | 2.6% | 0.13 | 1.3 MB | 2.7% | 0.38 |
| Apr 10 06:00:00 - 06:59:59 | 627 | 3.5% | 0.17 | 1.6 MB | 3.2% | 0.44 |
| Apr 10 07:00:00 - 07:59:59 | 741 | 4.1% | 0.21 | 1.8 MB | 3.8% | 0.52 |
| Apr 10 08:00:00 - 08:59:59 | 834 | 4.7% | 0.23 | 2.1 MB | 4.3% | 0.60 |
| Apr 10 09:00:00 - 09:59:59 | 796 | 4.4% | 0.22 | 1.9 MB | 3.9% | 0.54 |
| Apr 10 10:00:00 - 10:59:59 | 863 | 4.8% | 0.24 | 2.2 MB | 4.5% | 0.63 |
| Apr 10 11:00:00 - 11:59:59 | 807 | 4.5% | 0.22 | 2.1 MB | 4.2% | 0.59 |
| Apr 10 12:00:00 - 12:59:59 | 940 | 5.3% | 0.26 | 2.3 MB | 4.7% | 0.66 |
| Apr 10 13:00:00 - 13:59:59 | 937 | 5.2% | 0.26 | 2.4 MB | 5.0% | 0.69 |
| Apr 10 14:00:00 - 14:59:59 | 930 | 5.2% | 0.26 | 2.3 MB | 4.7% | 0.66 |
| Apr 10 15:00:00 - 15:59:59 | 1023 | 5.7% | 0.28 | 2.8 MB | 5.8% | 0.80 |
| Apr 10 16:00:00 - 16:59:59 | 1045 | 5.8% | 0.29 | 2.6 MB | 5.4% | 0.75 |
| Apr 10 17:00:00 - 17:59:59 | 1079 | 6.0% | 0.30 | 3.4 MB | 6.9% | 0.96 |
| Apr 10 18:00:00 - 18:59:59 | 878 | 4.9% | 0.24 | 2.2 MB | 4.4% | 0.62 |
| Apr 10 19:00:00 - 19:59:59 | 1002 | 5.6% | 0.28 | 2.9 MB | 5.8% | 0.81 |
| Apr 10 20:00:00 - 20:59:59 | 944 | 5.3% | 0.26 | 2.9 MB | 6.0% | 0.84 |
| Apr 10 21:00:00 - 21:59:59 | 777 | 4.3% | 0.22 | 2.3 MB | 4.7% | 0.66 |
| Apr 10 22:00:00 - 22:59:59 | 773 | 4.3% | 0.21 | 2.4 MB | 5.0% | 0.70 |
| Apr 10 23:00:00 - 23:59:59 | 509 | 2.8% | 0.14 | 1.5 MB | 3.0% | 0.42 |
| Apr 11 00:00:00 - 00:59:59 | 376 | 2.1% | 0.10 | 1.2 MB | 2.5% | 0.35 |
| Apr 11 01:00:00 - 01:59:59 | 414 | 2.3% | 0.12 | 1.3 MB | 2.6% | 0.36 |
| Apr 11 02:00:00 - 02:59:59 | 436 | 2.4% | 0.12 | 1.3 MB | 2.6% | 0.37 |
| Apr 11 03:00:00 - 03:59:59 | 338 | 1.9% | 0.09 | 1.1 MB | 2.2% | 0.30 |
| Apr 11 04:00:00 - 04:15:01 | 80 | 0.4% | 0.09 | 249.5 KB | 0.5% | 0.28 |
| TOTAL: 23:59:59 | 17890 | 100.0% | 0.21 | 49.0 MB | 100.0% | 0.58 |
Sites sending bad articles:
| Server | Total | Group | Dist | Duplic | Unapp | TooOld | Site | Line | Other | |
|---|---|---|---|---|---|---|---|---|---|---|
| 1 | i2pn | 564 | 0 | 0 | 0 | 0 | 0 | 0 | 0 | 564 |
| TOTAL: 1 | 564 | 0 | 0 | 0 | 0 | 0 | 0 | 0 | 564 | |
INND Perl filter [Top 20]:
| Reason | Count |
|---|---|
| Scoring filter (s5) | 91 |
| Scoring filter (s6) | 37 |
| Scoring filter (n4) | 8 |
| Scoring filter (n6) | 2 |
| EMP (phl) | 1 |
| TOTAL: 5 | 139 |
NoCeM on Spool:
| Id | Good | Bad | Unique | Total |
|---|---|---|---|---|
| bleachbot@httrack.com | 85 | 0 | 97 | 97 |
| TOTAL: 1 | 85 | 0 | 97 | 97 |
Miscellaneous innd statistics [Top 10]:
| Event | Server | Number |
|---|---|---|
| Including strange strings | ||
| i2pn | 425 | |
| TOTAL: 1 | 425 | |
| TOTAL: 1 | 425 | |
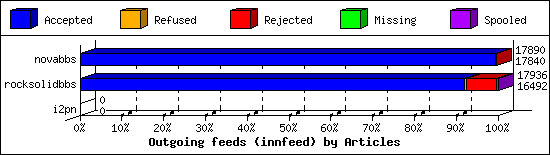
Outgoing Feeds (innfeed) by Articles:
| Server | Offered | Taken | Refused | Reject | Miss | Spool | %Took | Elapsed | |
|---|---|---|---|---|---|---|---|---|---|
| 1 | novabbs | 17891 | 17840 | 0 | 50 | 0 | 0 | 99% | 23:59:57 |
| 2 | rocksolidbbs | 17915 | 16492 | 79 | 1319 | 0 | 46 | 92% | 23:59:57 |
| 3 | i2pn | 0 | 0 | 0 | 0 | 0 | 0 | 0% | 00:10:00 |
| TOTAL: 3 | 35806 | 34332 | 79 | 1369 | 0 | 46 | 95% | 48:09:54 | |
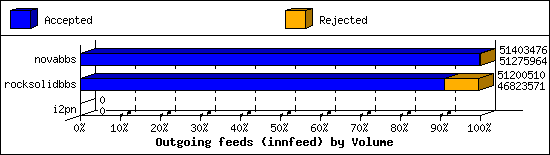
Outgoing Feeds (innfeed) by Volume:
| Server | AcceptVol | RejectVol | TotalVol | Volume/sec | Vol/Art | Elapsed | |
|---|---|---|---|---|---|---|---|
| 1 | novabbs | 48.9 MB | 124.5 KB | 49.0 MB | 0.6 KB/s | 2.8 KB | 23:59:57 |
| 2 | rocksolidbbs | 44.7 MB | 4.2 MB | 48.8 MB | 0.6 KB/s | 2.8 KB | 23:59:57 |
| 3 | i2pn | 0.0 KB | 0.0 KB | 0.0 KB | 0.0 KB/s | 0 | 00:10:00 |
| TOTAL: 3 | 93.6 MB | 4.3 MB | 97.9 MB | 0.6 KB/s | 2.8 KB | 48:09:54 | |
NNRP readership statistics:
| System | Conn | Arts | Size | Groups | Post | Rej | Elapsed | |
|---|---|---|---|---|---|---|---|---|
| 1 | 162.243.134.146 | 1 | 0 | 0.0 KB | 0 | 0 | 0 | 00:00:09 |
| TOTAL: 1 | 1 | 0 | 0.0 KB | 0 | 0 | 0 | 00:00:09 | |
NNRP readership statistics (by domain):
| System | Conn | Arts | Size | Groups | Post | Rej | Elapsed | |
|---|---|---|---|---|---|---|---|---|
| 1 | unresolved | 1 | 0 | 0.0 KB | 0 | 0 | 0 | 00:00:09 |
| TOTAL: 1 | 1 | 0 | 0.0 KB | 0 | 0 | 0 | 00:00:09 | |
NNRP total resource statistics [Top 20]:
| System | User(ms) | System(ms) | Idle(ms) | Elapsed |
|---|---|---|---|---|
| 162.243.134.146 | 0.052 | 0.008 | 0.000 | 00:00:09 |
| TOTAL: 1 | 0.052 | 0.008 | 0.000 | 00:00:09 |
