
Log entries by program:
| Program name | Lines | %Lines | Size | %Size |
|---|---|---|---|---|
| inn | 18728 | 89.1% | 1.8 MB | 84.9% |
| innd | 1282 | 6.1% | 184.5 KB | 8.7% |
| innfeed | 883 | 4.2% | 122.6 KB | 5.8% |
| nocem | 112 | 0.5% | 12.5 KB | 0.6% |
| nnrpd | 3 | 0.0% | 0.3 KB | 0.0% |
| controlchan | 1 | 0.0% | 0.1 KB | 0.0% |
| TOTAL: 6 | 21009 | 100.0% | 2.1 MB | 100.0% |
History cache:
| Reason | Count | %Count |
|---|---|---|
| Do not exist | 18115 | 97.6% |
| Negative hits | 298 | 1.6% |
| Positive hits | 118 | 0.6% |
| Cache misses | 23 | 0.1% |
| TOTAL: 4 | 18554 | 100.0% |
INND timer:
| Code region | Time | Pct | Invoked | Min(ms) | Avg(ms) | Max(ms) |
|---|---|---|---|---|---|---|
| article cancel | 00:00:00.055 | 0.0% | 213 | 0.000 | 0.258 | 13.000 |
| article cleanup | 00:00:00.089 | 0.0% | 18080 | 0.000 | 0.005 | 0.030 |
| article logging | 00:00:00.459 | 0.0% | 18567 | 0.000 | 0.025 | 0.097 |
| article parse | 00:00:00.270 | 0.0% | 20364 | 0.000 | 0.013 | 0.062 |
| article write | 00:00:03.957 | 0.0% | 17946 | 0.042 | 0.220 | 0.887 |
| artlog/artcncl | 00:00:00.003 | 0.0% | 168 | 0.000 | 0.018 | 0.250 |
| artlog/artwrite | 00:00:00.000 | 0.0% | 0 | 0.000 | 0.000 | 0.000 |
| data move | 00:00:00.015 | 0.0% | 22722 | 0.000 | 0.001 | 0.011 |
| hisgrep/artcncl | 00:00:00.004 | 0.0% | 145 | 0.000 | 0.028 | 0.286 |
| hishave/artcncl | 00:00:00.001 | 0.0% | 213 | 0.000 | 0.005 | 0.100 |
| history grep | 00:00:00.000 | 0.0% | 0 | 0.000 | 0.000 | 0.000 |
| history lookup | 00:00:00.085 | 0.0% | 18391 | 0.000 | 0.005 | 0.031 |
| history sync | 00:00:00.015 | 0.0% | 305 | 0.000 | 0.049 | 1.000 |
| history write | 00:00:02.821 | 0.0% | 18080 | 0.000 | 0.156 | 0.554 |
| hiswrite/artcncl | 00:00:00.021 | 0.0% | 68 | 0.000 | 0.309 | 13.000 |
| idle | 23:59:55.855 | 100.0% | 21102 | 1935.532 | 4094.202 | 11540.077 |
| nntp read | 00:00:00.501 | 0.0% | 20866 | 0.000 | 0.024 | 0.059 |
| overview write | 00:00:02.526 | 0.0% | 17946 | 0.015 | 0.141 | 1.107 |
| perl filter | 00:00:10.474 | 0.0% | 18080 | 0.431 | 0.579 | 0.964 |
| python filter | 00:00:00.000 | 0.0% | 0 | 0.000 | 0.000 | 0.000 |
| site send | 00:00:00.719 | 0.0% | 18052 | 0.000 | 0.040 | 0.099 |
| TOTAL: 24:00:20.378 | 24:00:17.870 | 100.0% | - | - | - | - |
INNfeed timer:
| Code region | Time | Pct | Invoked | Min(ms) | Avg(ms) | Max(ms) |
|---|---|---|---|---|---|---|
| article new | 00:00:00.027 | 0.0% | 17927 | 0.000 | 0.002 | 0.021 |
| article prepare | 00:00:00.011 | 0.0% | 143372 | 0.000 | 0.000 | 0.002 |
| article read | 00:00:00.646 | 0.0% | 17926 | 0.000 | 0.036 | 0.547 |
| backlog stats | 00:00:00.025 | 0.0% | 81351 | 0.000 | 0.000 | 0.004 |
| callbacks | 00:00:00.000 | 0.0% | 0 | 0.000 | 0.000 | 0.000 |
| data read | 00:00:00.304 | 0.0% | 56525 | 0.000 | 0.005 | 0.020 |
| data write | 00:00:00.620 | 0.0% | 38627 | 0.000 | 0.016 | 0.053 |
| idle | 23:57:35.555 | 100.0% | 81351 | 528.124 | 1060.289 | 2895.526 |
| status file | 00:00:00.174 | 0.0% | 210 | 0.000 | 0.829 | 20.333 |
| TOTAL: 23:57:38.429 | 23:57:37.362 | 100.0% | - | - | - | - |
nnrpd timer:
| Code region | Time | Pct | Invoked | Min(ms) | Avg(ms) | Max(ms) |
|---|---|---|---|---|---|---|
| idle | 00:00:01.772 | 83.7% | 1 | 1772.000 | 1772.000 | 1772.000 |
| newnews | 00:00:00.000 | 0.0% | 0 | 0.000 | 0.000 | 0.000 |
| nntpwrite | 00:00:00.000 | 0.0% | 2 | 0.000 | 0.000 | 0.000 |
| TOTAL: 00:00:02.116 | 00:00:01.772 | 83.7% | - | - | - | - |
Control commands to INND:
| Command | Number |
|---|---|
| L | 1 |
| flush | 3 |
| flushlogs | 2 |
| go | 2 |
| logmode | 2 |
| mode | 149 |
| name | 2 |
| pause | 2 |
| paused | 2 |
| reload | 2 |
| reserve | 2 |
| TOTAL: 11 | 169 |
Incoming Feeds (INN):
| Server | Connects | Offered | Taken | Refused | Reject | %Accpt | Elapsed | |
|---|---|---|---|---|---|---|---|---|
| 1 | i2pn | 7 | 17937 | 17802 | 1 | 134 | 99% | 24:12:56 |
| 2 | novabbs | 12 | 32 | 9 | 23 | 0 | 28% | 02:46:45 |
| 3 | localhost | 31 | 0 | 0 | 0 | 0 | 0% | 00:00:00 |
| TOTAL: 3 | 50 | 17969 | 17811 | 24 | 134 | 99% | 26:59:41 | |
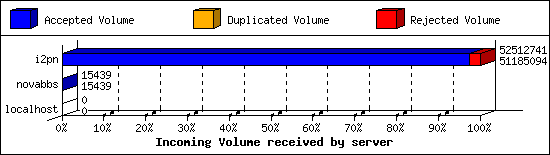
Incoming Volume (INN):
| Server | AcceptVol | DupVol | RejVol | TotalVol | %Acc | Vol/Art | |
|---|---|---|---|---|---|---|---|
| 1 | i2pn | 48.8 MB | 0.0 KB | 1.3 MB | 50.1 MB | 97% | 2.9 KB |
| 2 | novabbs | 15.1 KB | 0.0 KB | 0.0 KB | 15.1 KB | 100% | 1.7 KB |
| 3 | localhost | 0.0 KB | 0.0 KB | 0.0 KB | 0.0 KB | 0% | 0 |
| TOTAL: 3 | 48.8 MB | 0.0 KB | 1.3 MB | 50.1 MB | 97% | 2.9 KB | |
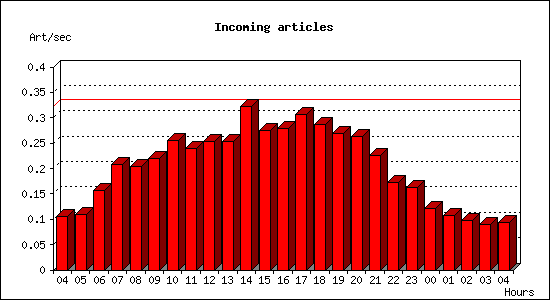
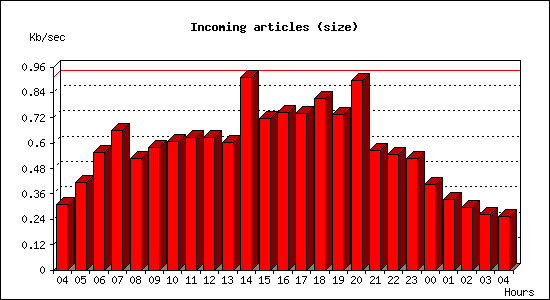
Incoming articles:
| Date | Articles | %Arts | Art/sec | Size | %Size | KB/sec |
|---|---|---|---|---|---|---|
| Apr 11 04:15:01 - 04:59:59 | 287 | 1.6% | 0.11 | 832.2 KB | 1.7% | 0.31 |
| Apr 11 05:00:00 - 05:59:59 | 397 | 2.2% | 0.11 | 1.5 MB | 3.0% | 0.42 |
| Apr 11 06:00:00 - 06:59:59 | 561 | 3.1% | 0.16 | 1.9 MB | 4.0% | 0.55 |
| Apr 11 07:00:00 - 07:59:59 | 748 | 4.2% | 0.21 | 2.3 MB | 4.7% | 0.66 |
| Apr 11 08:00:00 - 08:59:59 | 733 | 4.1% | 0.20 | 1.9 MB | 3.8% | 0.53 |
| Apr 11 09:00:00 - 09:59:59 | 793 | 4.4% | 0.22 | 2.0 MB | 4.1% | 0.58 |
| Apr 11 10:00:00 - 10:59:59 | 920 | 5.1% | 0.26 | 2.1 MB | 4.4% | 0.61 |
| Apr 11 11:00:00 - 11:59:59 | 864 | 4.8% | 0.24 | 2.2 MB | 4.5% | 0.63 |
| Apr 11 12:00:00 - 12:59:59 | 912 | 5.1% | 0.25 | 2.2 MB | 4.5% | 0.63 |
| Apr 11 13:00:00 - 13:59:59 | 911 | 5.1% | 0.25 | 2.1 MB | 4.3% | 0.60 |
| Apr 11 14:00:00 - 14:59:59 | 1160 | 6.5% | 0.32 | 3.2 MB | 6.5% | 0.91 |
| Apr 11 15:00:00 - 15:59:59 | 993 | 5.5% | 0.28 | 2.5 MB | 5.1% | 0.72 |
| Apr 11 16:00:00 - 16:59:59 | 1005 | 5.6% | 0.28 | 2.6 MB | 5.3% | 0.75 |
| Apr 11 17:00:00 - 17:59:59 | 1104 | 6.2% | 0.31 | 2.6 MB | 5.3% | 0.74 |
| Apr 11 18:00:00 - 18:59:59 | 1035 | 5.8% | 0.29 | 2.9 MB | 5.8% | 0.81 |
| Apr 11 19:00:00 - 19:59:59 | 970 | 5.4% | 0.27 | 2.6 MB | 5.3% | 0.74 |
| Apr 11 20:00:00 - 20:59:59 | 944 | 5.3% | 0.26 | 3.1 MB | 6.4% | 0.89 |
| Apr 11 21:00:00 - 21:59:59 | 815 | 4.5% | 0.23 | 2.0 MB | 4.0% | 0.56 |
| Apr 11 22:00:00 - 22:59:59 | 623 | 3.5% | 0.17 | 1.9 MB | 3.9% | 0.55 |
| Apr 11 23:00:00 - 23:59:59 | 583 | 3.2% | 0.16 | 1.8 MB | 3.8% | 0.53 |
| Apr 12 00:00:00 - 00:59:59 | 437 | 2.4% | 0.12 | 1.4 MB | 2.9% | 0.41 |
| Apr 12 01:00:00 - 01:59:59 | 386 | 2.2% | 0.11 | 1.2 MB | 2.4% | 0.33 |
| Apr 12 02:00:00 - 02:59:59 | 354 | 2.0% | 0.10 | 1.0 MB | 2.1% | 0.29 |
| Apr 12 03:00:00 - 03:59:59 | 324 | 1.8% | 0.09 | 938.8 KB | 1.9% | 0.26 |
| Apr 12 04:00:00 - 04:15:01 | 84 | 0.5% | 0.09 | 229.0 KB | 0.5% | 0.25 |
| TOTAL: 24:00:00 | 17943 | 100.0% | 0.21 | 49.1 MB | 100.0% | 0.58 |
Sites sending bad articles:
| Server | Total | Group | Dist | Duplic | Unapp | TooOld | Site | Line | Other | |
|---|---|---|---|---|---|---|---|---|---|---|
| 1 | i2pn | 618 | 0 | 0 | 0 | 0 | 0 | 0 | 0 | 618 |
| TOTAL: 1 | 618 | 0 | 0 | 0 | 0 | 0 | 0 | 0 | 618 | |
INND Perl filter [Top 20]:
| Reason | Count |
|---|---|
| Scoring filter (s5) | 89 |
| Scoring filter (s6) | 44 |
| Scoring filter (n6) | 1 |
| TOTAL: 3 | 134 |
NoCeM on Spool:
| Id | Good | Bad | Unique | Total |
|---|---|---|---|---|
| bleachbot@httrack.com | 97 | 0 | 113 | 113 |
| TOTAL: 1 | 97 | 9 | 113 | 113 |
Miscellaneous innd statistics [Top 10]:
| Event | Server | Number |
|---|---|---|
| Including strange strings | ||
| i2pn | 484 | |
| TOTAL: 1 | 484 | |
| TOTAL: 1 | 484 | |
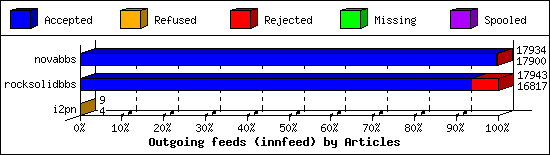
Outgoing Feeds (innfeed) by Articles:
| Server | Offered | Taken | Refused | Reject | Miss | Spool | %Took | Elapsed | |
|---|---|---|---|---|---|---|---|---|---|
| 1 | novabbs | 17937 | 17900 | 1 | 33 | 0 | 0 | 99% | 23:59:41 |
| 2 | rocksolidbbs | 17957 | 16817 | 5 | 1121 | 0 | 0 | 93% | 23:59:35 |
| 3 | i2pn | 9 | 4 | 5 | 0 | 0 | 0 | 44% | 01:08:27 |
| TOTAL: 3 | 35903 | 34721 | 11 | 1154 | 0 | 0 | 96% | 49:07:43 | |
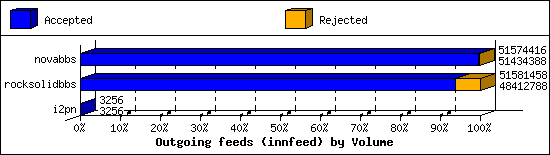
Outgoing Feeds (innfeed) by Volume:
| Server | AcceptVol | RejectVol | TotalVol | Volume/sec | Vol/Art | Elapsed | |
|---|---|---|---|---|---|---|---|
| 1 | novabbs | 49.1 MB | 136.7 KB | 49.2 MB | 0.6 KB/s | 2.8 KB | 23:59:41 |
| 2 | rocksolidbbs | 46.2 MB | 3.0 MB | 49.2 MB | 0.6 KB/s | 2.8 KB | 23:59:35 |
| 3 | i2pn | 3.2 KB | 0.0 KB | 3.2 KB | 0.0 KB/s | 0.8 KB | 01:08:27 |
| TOTAL: 3 | 95.2 MB | 3.2 MB | 98.4 MB | 0.6 KB/s | 2.8 KB | 49:07:43 | |
NNRP readership statistics:
| System | Conn | Arts | Size | Groups | Post | Rej | Elapsed | |
|---|---|---|---|---|---|---|---|---|
| 1 | min-extra-grab-100-uk-prod.binaryedge.ninja | 1 | 0 | 0.0 KB | 0 | 0 | 0 | 00:00:02 |
| TOTAL: 1 | 1 | 0 | 0.0 KB | 0 | 0 | 0 | 00:00:02 | |
NNRP readership statistics (by domain):
| System | Conn | Arts | Size | Groups | Post | Rej | Elapsed | |
|---|---|---|---|---|---|---|---|---|
| 1 | *.binaryedge.ninja | 1 | 0 | 0.0 KB | 0 | 0 | 0 | 00:00:02 |
| TOTAL: 1 | 1 | 0 | 0.0 KB | 0 | 0 | 0 | 00:00:02 | |
NNRP total resource statistics [Top 20]:
| System | User(ms) | System(ms) | Idle(ms) | Elapsed |
|---|---|---|---|---|
| min-extra-grab-100-uk-prod.binaryedge.ninja | 0.040 | 0.008 | 0.000 | 00:00:02 |
| TOTAL: 1 | 0.040 | 0.008 | 0.000 | 00:00:02 |
