Log entries by program:
| Program name | Lines | %Lines | Size | %Size |
|---|---|---|---|---|
| inn | 15678 | 88.2% | 1.5 MB | 83.6% |
| innd | 1203 | 6.8% | 173.1 KB | 9.5% |
| innfeed | 857 | 4.8% | 119.6 KB | 6.6% |
| nocem | 41 | 0.2% | 3.7 KB | 0.2% |
| nnrpd | 4 | 0.0% | 0.5 KB | 0.0% |
| controlchan | 1 | 0.0% | 0.1 KB | 0.0% |
| TOTAL: 6 | 17784 | 100.0% | 1.8 MB | 100.0% |
History cache:
| Reason | Count | %Count |
|---|---|---|
| Do not exist | 15099 | 97.1% |
| Negative hits | 378 | 2.4% |
| Positive hits | 68 | 0.4% |
| Cache misses | 10 | 0.1% |
| TOTAL: 4 | 15555 | 100.0% |
INND timer:
| Code region | Time | Pct | Invoked | Min(ms) | Avg(ms) | Max(ms) |
|---|---|---|---|---|---|---|
| article cancel | 00:00:00.021 | 0.0% | 79 | 0.000 | 0.266 | 2.000 |
| article cleanup | 00:00:00.079 | 0.0% | 15128 | 0.000 | 0.005 | 0.049 |
| article logging | 00:00:00.365 | 0.0% | 15606 | 0.000 | 0.023 | 0.093 |
| article parse | 00:00:00.186 | 0.0% | 17074 | 0.000 | 0.011 | 0.065 |
| article write | 00:00:02.489 | 0.0% | 15025 | 0.076 | 0.166 | 0.618 |
| artlog/artcncl | 00:00:00.001 | 0.0% | 73 | 0.000 | 0.014 | 0.500 |
| artlog/artwrite | 00:00:00.000 | 0.0% | 0 | 0.000 | 0.000 | 0.000 |
| data move | 00:00:00.005 | 0.0% | 19097 | 0.000 | 0.000 | 0.007 |
| hisgrep/artcncl | 00:00:00.001 | 0.0% | 77 | 0.000 | 0.013 | 1.000 |
| hishave/artcncl | 00:00:00.000 | 0.0% | 79 | 0.000 | 0.000 | 0.000 |
| history grep | 00:00:00.000 | 0.0% | 0 | 0.000 | 0.000 | 0.000 |
| history lookup | 00:00:00.049 | 0.0% | 15526 | 0.000 | 0.003 | 0.033 |
| history sync | 00:00:00.015 | 0.0% | 309 | 0.000 | 0.049 | 1.000 |
| history write | 00:00:00.580 | 0.0% | 15127 | 0.000 | 0.038 | 0.156 |
| hiswrite/artcncl | 00:00:00.000 | 0.0% | 2 | 0.000 | 0.000 | 0.000 |
| idle | 24:00:02.359 | 100.0% | 17787 | 2399.976 | 4857.613 | 13638.545 |
| nntp read | 00:00:00.394 | 0.0% | 17550 | 0.000 | 0.022 | 0.075 |
| overview write | 00:00:02.168 | 0.0% | 15025 | 0.017 | 0.144 | 1.317 |
| perl filter | 00:00:08.717 | 0.0% | 15127 | 0.404 | 0.576 | 1.015 |
| python filter | 00:00:00.000 | 0.0% | 0 | 0.000 | 0.000 | 0.000 |
| site send | 00:00:00.222 | 0.0% | 15060 | 0.000 | 0.015 | 0.086 |
| TOTAL: 24:00:19.848 | 24:00:17.651 | 100.0% | - | - | - | - |
INNfeed timer:
| Code region | Time | Pct | Invoked | Min(ms) | Avg(ms) | Max(ms) |
|---|---|---|---|---|---|---|
| article new | 00:00:00.028 | 0.0% | 15017 | 0.000 | 0.002 | 0.018 |
| article prepare | 00:00:00.014 | 0.0% | 120084 | 0.000 | 0.000 | 0.003 |
| article read | 00:00:00.502 | 0.0% | 15016 | 0.000 | 0.033 | 0.500 |
| backlog stats | 00:00:00.015 | 0.0% | 70276 | 0.000 | 0.000 | 0.004 |
| callbacks | 00:00:00.000 | 0.0% | 0 | 0.000 | 0.000 | 0.000 |
| data read | 00:00:00.277 | 0.0% | 48015 | 0.000 | 0.006 | 0.019 |
| data write | 00:00:00.499 | 0.0% | 33028 | 0.000 | 0.015 | 0.045 |
| idle | 23:58:40.456 | 100.0% | 70276 | 712.916 | 1228.306 | 3386.425 |
| status file | 00:00:00.097 | 0.0% | 196 | 0.000 | 0.495 | 1.957 |
| TOTAL: 23:58:42.740 | 23:58:41.888 | 100.0% | - | - | - | - |
nnrpd timer:
| Code region | Time | Pct | Invoked | Min(ms) | Avg(ms) | Max(ms) |
|---|---|---|---|---|---|---|
| idle | 00:00:09.644 | 97.3% | 1 | 9644.000 | 9644.000 | 9644.000 |
| newnews | 00:00:00.000 | 0.0% | 0 | 0.000 | 0.000 | 0.000 |
| nntpwrite | 00:00:00.000 | 0.0% | 2 | 0.000 | 0.000 | 0.000 |
| TOTAL: 00:00:09.916 | 00:00:09.644 | 97.3% | - | - | - | - |
Control commands to INND:
| Command | Number |
|---|---|
| L | 1 |
| flush | 3 |
| flushlogs | 2 |
| go | 2 |
| logmode | 2 |
| mode | 149 |
| name | 2 |
| pause | 2 |
| paused | 2 |
| reload | 2 |
| reserve | 2 |
| TOTAL: 11 | 169 |
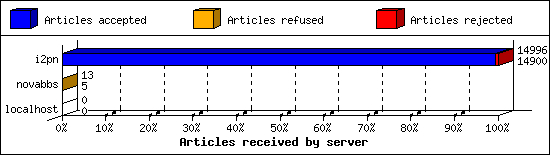
Incoming Feeds (INN):
| Server | Connects | Offered | Taken | Refused | Reject | %Accpt | Elapsed | |
|---|---|---|---|---|---|---|---|---|
| 1 | i2pn | 7 | 14996 | 14900 | 1 | 95 | 99% | 24:04:12 |
| 2 | novabbs | 9 | 13 | 5 | 8 | 0 | 38% | 01:30:52 |
| 3 | localhost | 31 | 0 | 0 | 0 | 0 | 0% | 00:00:00 |
| TOTAL: 3 | 47 | 15009 | 14905 | 9 | 95 | 99% | 25:35:04 | |
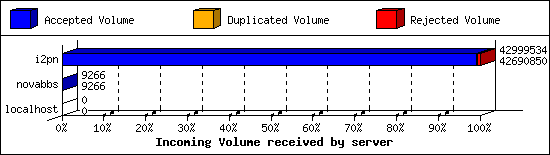
Incoming Volume (INN):
| Server | AcceptVol | DupVol | RejVol | TotalVol | %Acc | Vol/Art | |
|---|---|---|---|---|---|---|---|
| 1 | i2pn | 40.7 MB | 3.4 KB | 298.1 KB | 41.0 MB | 99% | 2.8 KB |
| 2 | novabbs | 9.0 KB | 0.0 KB | 0.0 KB | 9.0 KB | 100% | 1.8 KB |
| 3 | localhost | 0.0 KB | 0.0 KB | 0.0 KB | 0.0 KB | 0% | 0 |
| TOTAL: 3 | 40.7 MB | 3.4 KB | 298.1 KB | 41.0 MB | 99% | 2.8 KB | |
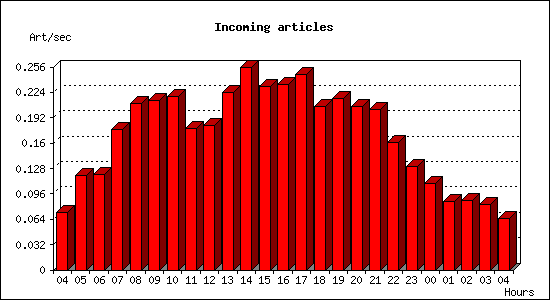
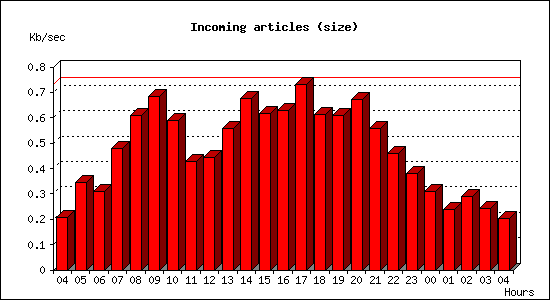
Incoming articles:
| Date | Articles | %Arts | Art/sec | Size | %Size | KB/sec |
|---|---|---|---|---|---|---|
| Apr 13 04:15:01 - 04:59:59 | 196 | 1.3% | 0.07 | 561.5 KB | 1.3% | 0.21 |
| Apr 13 05:00:00 - 05:59:59 | 430 | 2.9% | 0.12 | 1.2 MB | 3.0% | 0.35 |
| Apr 13 06:00:00 - 06:59:59 | 434 | 2.9% | 0.12 | 1.1 MB | 2.7% | 0.31 |
| Apr 13 07:00:00 - 07:59:59 | 636 | 4.2% | 0.18 | 1.7 MB | 4.1% | 0.48 |
| Apr 13 08:00:00 - 08:59:59 | 757 | 5.0% | 0.21 | 2.1 MB | 5.2% | 0.61 |
| Apr 13 09:00:00 - 09:59:59 | 769 | 5.1% | 0.21 | 2.4 MB | 5.9% | 0.68 |
| Apr 13 10:00:00 - 10:59:59 | 788 | 5.2% | 0.22 | 2.1 MB | 5.0% | 0.59 |
| Apr 13 11:00:00 - 11:59:59 | 642 | 4.3% | 0.18 | 1.5 MB | 3.7% | 0.43 |
| Apr 13 12:00:00 - 12:59:59 | 658 | 4.4% | 0.18 | 1.6 MB | 3.8% | 0.44 |
| Apr 13 13:00:00 - 13:59:59 | 804 | 5.4% | 0.22 | 2.0 MB | 4.8% | 0.56 |
| Apr 13 14:00:00 - 14:59:59 | 920 | 6.1% | 0.26 | 2.4 MB | 5.8% | 0.68 |
| Apr 13 15:00:00 - 15:59:59 | 834 | 5.6% | 0.23 | 2.2 MB | 5.3% | 0.62 |
| Apr 13 16:00:00 - 16:59:59 | 843 | 5.6% | 0.23 | 2.2 MB | 5.4% | 0.63 |
| Apr 13 17:00:00 - 17:59:59 | 887 | 5.9% | 0.25 | 2.6 MB | 6.3% | 0.73 |
| Apr 13 18:00:00 - 18:59:59 | 741 | 4.9% | 0.21 | 2.2 MB | 5.2% | 0.61 |
| Apr 13 19:00:00 - 19:59:59 | 780 | 5.2% | 0.22 | 2.1 MB | 5.2% | 0.61 |
| Apr 13 20:00:00 - 20:59:59 | 743 | 4.9% | 0.21 | 2.4 MB | 5.8% | 0.67 |
| Apr 13 21:00:00 - 21:59:59 | 730 | 4.9% | 0.20 | 2.0 MB | 4.8% | 0.56 |
| Apr 13 22:00:00 - 22:59:59 | 581 | 3.9% | 0.16 | 1.6 MB | 3.9% | 0.46 |
| Apr 13 23:00:00 - 23:59:59 | 472 | 3.1% | 0.13 | 1.3 MB | 3.2% | 0.38 |
| Apr 14 00:00:00 - 00:59:59 | 392 | 2.6% | 0.11 | 1.1 MB | 2.6% | 0.31 |
| Apr 14 01:00:00 - 01:59:59 | 312 | 2.1% | 0.09 | 864.0 KB | 2.1% | 0.24 |
| Apr 14 02:00:00 - 02:59:59 | 315 | 2.1% | 0.09 | 1.0 MB | 2.5% | 0.29 |
| Apr 14 03:00:00 - 03:59:59 | 299 | 2.0% | 0.08 | 875.9 KB | 2.1% | 0.24 |
| Apr 14 04:00:00 - 04:15:01 | 59 | 0.4% | 0.07 | 182.1 KB | 0.4% | 0.20 |
| TOTAL: 24:00:00 | 15022 | 100.0% | 0.17 | 41.0 MB | 100.0% | 0.49 |
Sites sending bad articles:
| Server | Total | Group | Dist | Duplic | Unapp | TooOld | Site | Line | Other | |
|---|---|---|---|---|---|---|---|---|---|---|
| 1 | i2pn | 581 | 3 | 0 | 1 | 0 | 0 | 0 | 0 | 577 |
| TOTAL: 1 | 581 | 3 | 0 | 1 | 0 | 0 | 0 | 0 | 577 | |
Unwanted newsgroups [Top 20]:
| Newsgroup | Count |
|---|---|
| hk.politics | 3 |
| TOTAL: 1 | 3 |
INND Perl filter [Top 20]:
| Reason | Count |
|---|---|
| Scoring filter (s5) | 80 |
| Scoring filter (s6) | 19 |
| TOTAL: 2 | 99 |
NoCeM on Spool:
| Id | Good | Bad | Unique | Total |
|---|---|---|---|---|
| bleachbot@httrack.com | 32 | 0 | 32 | 32 |
| TOTAL: 1 | 32 | 3 | 32 | 32 |
Miscellaneous innd statistics [Top 10]:
| Event | Server | Number |
|---|---|---|
| Including strange strings | ||
| i2pn | 478 | |
| TOTAL: 1 | 478 | |
| TOTAL: 1 | 478 | |
Outgoing Feeds (innfeed) by Articles:
| Server | Offered | Taken | Refused | Reject | Miss | Spool | %Took | Elapsed | |
|---|---|---|---|---|---|---|---|---|---|
| 1 | novabbs | 15023 | 14984 | 5 | 28 | 0 | 0 | 99% | 23:59:58 |
| 2 | rocksolidbbs | 15038 | 14004 | 6 | 1012 | 0 | 0 | 93% | 23:59:58 |
| 3 | i2pn | 6 | 3 | 2 | 0 | 0 | 0 | 50% | 00:50:06 |
| TOTAL: 3 | 30067 | 28991 | 13 | 1040 | 0 | 0 | 96% | 48:50:02 | |

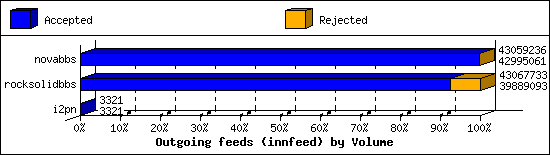
Outgoing Feeds (innfeed) by Volume:
| Server | AcceptVol | RejectVol | TotalVol | Volume/sec | Vol/Art | Elapsed | |
|---|---|---|---|---|---|---|---|
| 1 | novabbs | 41.0 MB | 62.7 KB | 41.1 MB | 0.5 KB/s | 2.8 KB | 23:59:58 |
| 2 | rocksolidbbs | 38.0 MB | 3.0 MB | 41.1 MB | 0.5 KB/s | 2.8 KB | 23:59:58 |
| 3 | i2pn | 3.2 KB | 0.0 KB | 3.2 KB | 0.0 KB/s | 1.1 KB | 00:50:06 |
| TOTAL: 3 | 79.0 MB | 3.1 MB | 82.1 MB | 0.5 KB/s | 2.8 KB | 48:50:02 | |
NNRP readership statistics:
| System | Conn | Arts | Size | Groups | Post | Rej | Elapsed | |
|---|---|---|---|---|---|---|---|---|
| 1 | 192.241.198.60 | 1 | 0 | 0.0 KB | 0 | 0 | 0 | 00:00:09 |
| TOTAL: 1 | 1 | 0 | 0.0 KB | 0 | 0 | 0 | 00:00:09 | |
NNRP readership statistics (by domain):
| System | Conn | Arts | Size | Groups | Post | Rej | Elapsed | |
|---|---|---|---|---|---|---|---|---|
| 1 | unresolved | 1 | 0 | 0.0 KB | 0 | 0 | 0 | 00:00:09 |
| TOTAL: 1 | 1 | 0 | 0.0 KB | 0 | 0 | 0 | 00:00:09 | |
NNRP total resource statistics [Top 20]:
| System | User(ms) | System(ms) | Idle(ms) | Elapsed |
|---|---|---|---|---|
| 192.241.198.60 | 0.048 | 0.004 | 0.000 | 00:00:09 |
| TOTAL: 1 | 0.048 | 0.004 | 0.000 | 00:00:09 |
