Log entries by program:
| Program name | Lines | %Lines | Size | %Size |
|---|---|---|---|---|
| inn | 16017 | 88.0% | 1.5 MB | 83.5% |
| innd | 1216 | 6.7% | 176.4 KB | 9.5% |
| innfeed | 876 | 4.8% | 119.7 KB | 6.5% |
| nocem | 72 | 0.4% | 7.4 KB | 0.4% |
| nnrpd | 12 | 0.1% | 1.2 KB | 0.1% |
| controlchan | 1 | 0.0% | 0.1 KB | 0.0% |
| TOTAL: 6 | 18194 | 100.0% | 1.8 MB | 100.0% |
History cache:
| Reason | Count | %Count |
|---|---|---|
| Do not exist | 15394 | 97.5% |
| Negative hits | 273 | 1.7% |
| Positive hits | 103 | 0.7% |
| Cache misses | 16 | 0.1% |
| TOTAL: 4 | 15786 | 100.0% |
INND timer:
| Code region | Time | Pct | Invoked | Min(ms) | Avg(ms) | Max(ms) |
|---|---|---|---|---|---|---|
| article cancel | 00:00:00.030 | 0.0% | 140 | 0.000 | 0.214 | 1.000 |
| article cleanup | 00:00:00.069 | 0.0% | 15400 | 0.000 | 0.004 | 0.025 |
| article logging | 00:00:00.331 | 0.0% | 15901 | 0.000 | 0.021 | 0.089 |
| article parse | 00:00:00.238 | 0.0% | 17437 | 0.000 | 0.014 | 0.061 |
| article write | 00:00:02.366 | 0.0% | 15325 | 0.033 | 0.154 | 0.612 |
| artlog/artcncl | 00:00:00.002 | 0.0% | 117 | 0.000 | 0.017 | 0.500 |
| artlog/artwrite | 00:00:00.000 | 0.0% | 0 | 0.000 | 0.000 | 0.000 |
| data move | 00:00:00.011 | 0.0% | 19571 | 0.000 | 0.001 | 0.009 |
| hisgrep/artcncl | 00:00:00.001 | 0.0% | 121 | 0.000 | 0.008 | 0.333 |
| hishave/artcncl | 00:00:00.000 | 0.0% | 140 | 0.000 | 0.000 | 0.000 |
| history grep | 00:00:00.000 | 0.0% | 0 | 0.000 | 0.000 | 0.000 |
| history lookup | 00:00:00.054 | 0.0% | 15687 | 0.000 | 0.003 | 0.047 |
| history sync | 00:00:00.006 | 0.0% | 302 | 0.000 | 0.020 | 0.500 |
| history write | 00:00:00.531 | 0.0% | 15398 | 0.000 | 0.034 | 0.162 |
| hiswrite/artcncl | 00:00:00.000 | 0.0% | 19 | 0.000 | 0.000 | 0.000 |
| idle | 24:00:02.213 | 100.0% | 18074 | 2666.356 | 4780.470 | 12501.479 |
| nntp read | 00:00:00.445 | 0.0% | 17839 | 0.000 | 0.025 | 0.081 |
| overview write | 00:00:02.382 | 0.0% | 15325 | 0.033 | 0.155 | 1.643 |
| perl filter | 00:00:08.941 | 0.0% | 15398 | 0.395 | 0.581 | 0.892 |
| python filter | 00:00:00.000 | 0.0% | 0 | 0.000 | 0.000 | 0.000 |
| site send | 00:00:00.377 | 0.0% | 15389 | 0.000 | 0.024 | 0.076 |
| TOTAL: 24:00:20.140 | 24:00:17.997 | 100.0% | - | - | - | - |
INNfeed timer:
| Code region | Time | Pct | Invoked | Min(ms) | Avg(ms) | Max(ms) |
|---|---|---|---|---|---|---|
| article new | 00:00:00.022 | 0.0% | 15317 | 0.000 | 0.001 | 0.025 |
| article prepare | 00:00:00.017 | 0.0% | 122480 | 0.000 | 0.000 | 0.002 |
| article read | 00:00:00.549 | 0.0% | 15313 | 0.000 | 0.036 | 0.763 |
| backlog stats | 00:00:00.024 | 0.0% | 72966 | 0.000 | 0.000 | 0.006 |
| callbacks | 00:00:00.000 | 0.0% | 0 | 0.000 | 0.000 | 0.000 |
| data read | 00:00:00.295 | 0.0% | 49543 | 0.000 | 0.006 | 0.021 |
| data write | 00:00:00.528 | 0.0% | 34274 | 0.000 | 0.015 | 0.048 |
| idle | 23:58:08.953 | 100.0% | 72966 | 619.733 | 1182.591 | 3471.780 |
| status file | 00:00:00.069 | 0.0% | 199 | 0.000 | 0.347 | 2.000 |
| TOTAL: 23:58:11.443 | 23:58:10.457 | 100.0% | - | - | - | - |
nnrpd timer:
| Code region | Time | Pct | Invoked | Min(ms) | Avg(ms) | Max(ms) |
|---|---|---|---|---|---|---|
| idle | 00:00:00.279 | 31.1% | 4 | 59.000 | 69.750 | 80.500 |
| newnews | 00:00:00.000 | 0.0% | 0 | 0.000 | 0.000 | 0.000 |
| nntpwrite | 00:00:00.000 | 0.0% | 14 | 0.000 | 0.000 | 0.000 |
| TOTAL: 00:00:00.897 | 00:00:00.279 | 31.1% | - | - | - | - |
Control commands to INND:
| Command | Number |
|---|---|
| L | 1 |
| flush | 3 |
| flushlogs | 2 |
| go | 2 |
| logmode | 2 |
| mode | 149 |
| name | 2 |
| pause | 2 |
| paused | 2 |
| reload | 2 |
| reserve | 2 |
| TOTAL: 11 | 169 |
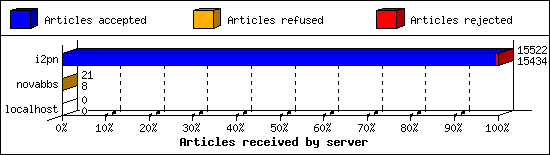
Incoming Feeds (INN):
| Server | Connects | Offered | Taken | Refused | Reject | %Accpt | Elapsed | |
|---|---|---|---|---|---|---|---|---|
| 1 | i2pn | 6 | 15522 | 15434 | 5 | 83 | 99% | 25:00:52 |
| 2 | novabbs | 11 | 21 | 8 | 13 | 0 | 38% | 02:21:13 |
| 3 | localhost | 33 | 0 | 0 | 0 | 0 | 0% | 00:00:00 |
| TOTAL: 3 | 50 | 15543 | 15442 | 18 | 83 | 99% | 27:22:05 | |
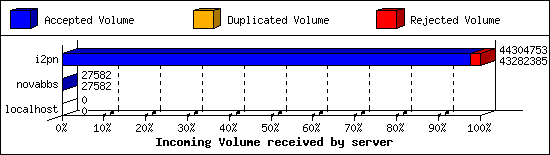
Incoming Volume (INN):
| Server | AcceptVol | DupVol | RejVol | TotalVol | %Acc | Vol/Art | |
|---|---|---|---|---|---|---|---|
| 1 | i2pn | 41.3 MB | 4.2 KB | 994.2 KB | 42.3 MB | 97% | 2.8 KB |
| 2 | novabbs | 26.9 KB | 0.0 KB | 0.0 KB | 26.9 KB | 100% | 3.4 KB |
| 3 | localhost | 0.0 KB | 0.0 KB | 0.0 KB | 0.0 KB | 0% | 0 |
| TOTAL: 3 | 41.3 MB | 4.2 KB | 994.2 KB | 42.3 MB | 97% | 2.8 KB | |
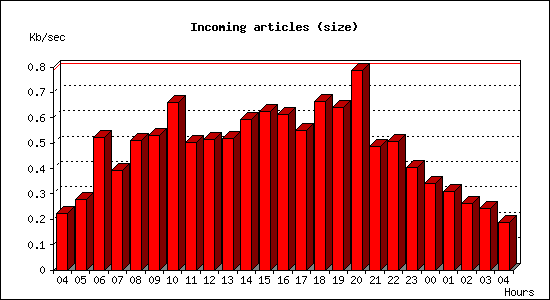
Incoming articles:
| Date | Articles | %Arts | Art/sec | Size | %Size | KB/sec |
|---|---|---|---|---|---|---|
| Apr 14 04:15:02 - 04:59:59 | 199 | 1.3% | 0.07 | 597.3 KB | 1.4% | 0.22 |
| Apr 14 05:00:00 - 05:59:59 | 342 | 2.2% | 0.10 | 1003.2 KB | 2.4% | 0.28 |
| Apr 14 06:00:00 - 06:59:59 | 539 | 3.5% | 0.15 | 1.8 MB | 4.5% | 0.52 |
| Apr 14 07:00:00 - 07:59:59 | 547 | 3.6% | 0.15 | 1.4 MB | 3.4% | 0.39 |
| Apr 14 08:00:00 - 08:59:59 | 729 | 4.8% | 0.20 | 1.8 MB | 4.4% | 0.51 |
| Apr 14 09:00:00 - 09:59:59 | 838 | 5.5% | 0.23 | 1.9 MB | 4.6% | 0.53 |
| Apr 14 10:00:00 - 10:59:59 | 837 | 5.5% | 0.23 | 2.3 MB | 5.7% | 0.66 |
| Apr 14 11:00:00 - 11:59:59 | 709 | 4.6% | 0.20 | 1.8 MB | 4.3% | 0.50 |
| Apr 14 12:00:00 - 12:59:59 | 812 | 5.3% | 0.23 | 1.8 MB | 4.4% | 0.51 |
| Apr 14 13:00:00 - 13:59:59 | 757 | 4.9% | 0.21 | 1.8 MB | 4.4% | 0.52 |
| Apr 14 14:00:00 - 14:59:59 | 771 | 5.0% | 0.21 | 2.1 MB | 5.1% | 0.59 |
| Apr 14 15:00:00 - 15:59:59 | 856 | 5.6% | 0.24 | 2.2 MB | 5.3% | 0.62 |
| Apr 14 16:00:00 - 16:59:59 | 876 | 5.7% | 0.24 | 2.2 MB | 5.3% | 0.61 |
| Apr 14 17:00:00 - 17:59:59 | 814 | 5.3% | 0.23 | 1.9 MB | 4.7% | 0.55 |
| Apr 14 18:00:00 - 18:59:59 | 939 | 6.1% | 0.26 | 2.3 MB | 5.7% | 0.67 |
| Apr 14 19:00:00 - 19:59:59 | 809 | 5.3% | 0.22 | 2.2 MB | 5.5% | 0.64 |
| Apr 14 20:00:00 - 20:59:59 | 858 | 5.6% | 0.24 | 2.8 MB | 6.8% | 0.79 |
| Apr 14 21:00:00 - 21:59:59 | 687 | 4.5% | 0.19 | 1.7 MB | 4.2% | 0.49 |
| Apr 14 22:00:00 - 22:59:59 | 613 | 4.0% | 0.17 | 1.8 MB | 4.3% | 0.50 |
| Apr 14 23:00:00 - 23:59:59 | 452 | 2.9% | 0.13 | 1.4 MB | 3.5% | 0.40 |
| Apr 15 00:00:00 - 00:59:59 | 371 | 2.4% | 0.10 | 1.2 MB | 2.9% | 0.34 |
| Apr 15 01:00:00 - 01:59:59 | 346 | 2.3% | 0.10 | 1.1 MB | 2.7% | 0.31 |
| Apr 15 02:00:00 - 02:59:59 | 286 | 1.9% | 0.08 | 939.6 KB | 2.2% | 0.26 |
| Apr 15 03:00:00 - 03:59:59 | 272 | 1.8% | 0.08 | 868.0 KB | 2.1% | 0.24 |
| Apr 15 04:00:00 - 04:15:02 | 66 | 0.4% | 0.07 | 167.3 KB | 0.4% | 0.19 |
| TOTAL: 24:00:00 | 15325 | 100.0% | 0.18 | 41.0 MB | 100.0% | 0.49 |

Sites sending bad articles:
| Server | Total | Group | Dist | Duplic | Unapp | TooOld | Site | Line | Other | |
|---|---|---|---|---|---|---|---|---|---|---|
| 1 | i2pn | 576 | 0 | 0 | 2 | 0 | 0 | 0 | 0 | 574 |
| TOTAL: 1 | 576 | 0 | 0 | 2 | 0 | 0 | 0 | 0 | 574 | |
INND Perl filter [Top 20]:
| Reason | Count |
|---|---|
| Scoring filter (s5) | 50 |
| Scoring filter (s6) | 23 |
| TOTAL: 2 | 73 |
NoCeM on Spool:
| Id | Good | Bad | Unique | Total |
|---|---|---|---|---|
| bleachbot@httrack.com | 54 | 0 | 56 | 56 |
| TOTAL: 1 | 54 | 10 | 56 | 56 |
Miscellaneous innd statistics [Top 10]:
| Event | Server | Number |
|---|---|---|
| Including strange strings | ||
| i2pn | 501 | |
| TOTAL: 1 | 501 | |
| TOTAL: 1 | 501 | |
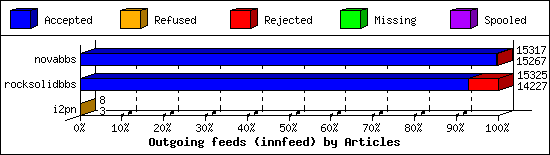
Outgoing Feeds (innfeed) by Articles:
| Server | Offered | Taken | Refused | Reject | Miss | Spool | %Took | Elapsed | |
|---|---|---|---|---|---|---|---|---|---|
| 1 | novabbs | 15324 | 15267 | 4 | 46 | 0 | 0 | 99% | 23:59:58 |
| 2 | rocksolidbbs | 15335 | 14227 | 5 | 1093 | 0 | 0 | 92% | 23:59:41 |
| 3 | i2pn | 10 | 3 | 5 | 0 | 0 | 0 | 30% | 01:00:07 |
| TOTAL: 3 | 30669 | 29497 | 14 | 1139 | 0 | 0 | 96% | 48:59:46 | |
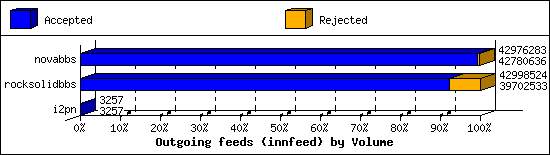
Outgoing Feeds (innfeed) by Volume:
| Server | AcceptVol | RejectVol | TotalVol | Volume/sec | Vol/Art | Elapsed | |
|---|---|---|---|---|---|---|---|
| 1 | novabbs | 40.8 MB | 191.1 KB | 41.0 MB | 0.5 KB/s | 2.7 KB | 23:59:58 |
| 2 | rocksolidbbs | 37.9 MB | 3.1 MB | 41.0 MB | 0.5 KB/s | 2.7 KB | 23:59:41 |
| 3 | i2pn | 3.2 KB | 0.0 KB | 3.2 KB | 0.0 KB/s | 1.1 KB | 01:00:07 |
| TOTAL: 3 | 78.7 MB | 3.3 MB | 82.0 MB | 0.5 KB/s | 2.7 KB | 48:59:46 | |
NNRP readership statistics:
| System | Conn | Arts | Size | Groups | Post | Rej | Elapsed | |
|---|---|---|---|---|---|---|---|---|
| 1 | worker-18.sfj.corp.censys.io | 1 | 0 | 0.0 KB | 0 | 0 | 0 | 00:00:00 |
| 2 | scan-141.security.ipip.net | 1 | 0 | 0.0 KB | 0 | 0 | 0 | 00:00:00 |
| TOTAL: 2 | 2 | 0 | 0.0 KB | 0 | 0 | 0 | 00:00:00 | |
NNRP readership statistics (by domain):
| System | Conn | Arts | Size | Groups | Post | Rej | Elapsed | |
|---|---|---|---|---|---|---|---|---|
| 1 | *.sfj.corp.censys.io | 1 | 0 | 0.0 KB | 0 | 0 | 0 | 00:00:00 |
| 2 | *.security.ipip.net | 1 | 0 | 0.0 KB | 0 | 0 | 0 | 00:00:00 |
| TOTAL: 2 | 2 | 0 | 0.0 KB | 0 | 0 | 0 | 00:00:00 | |
NNRP total resource statistics [Top 20]:
| System | User(ms) | System(ms) | Idle(ms) | Elapsed |
|---|---|---|---|---|
| scan-141.security.ipip.net | 0.040 | 0.004 | 0.000 | 00:00:00 |
| worker-18.sfj.corp.censys.io | 0.040 | 0.004 | 0.000 | 00:00:00 |
| TOTAL: 2 | 0.080 | 0.008 | 0.000 | 00:00:00 |
NNRP unrecognized commands (by host):
| System | Conn |
|---|---|
| scan-141.security.ipip.net | 4 |
| TOTAL: 1 | 4 |
NNRP unrecognized commands (by command):
| Command | Count |
|---|---|
| Connection: close | 1 |
| User-Agent: HTTP Banner Detection (https... | 1 |
| GET / HTTP/1.1 | 1 |
| Host: 157.230.63.40:119 | 1 |
| TOTAL: 4 | 4 |
NNRP client timeouts [Top 20]:
| System | Conn | Peer |
|---|---|---|
| worker-18.sfj.corp.censys.io | 1 | 1 |
| TOTAL: 1 | 1 | 1 |
