Log entries by program:
| Program name | Lines | %Lines | Size | %Size |
|---|---|---|---|---|
| inn | 19285 | 88.9% | 1.8 MB | 84.8% |
| innd | 1368 | 6.3% | 192.6 KB | 8.8% |
| innfeed | 916 | 4.2% | 126.7 KB | 5.8% |
| nocem | 112 | 0.5% | 11.8 KB | 0.5% |
| nnrpd | 11 | 0.1% | 1.0 KB | 0.0% |
| controlchan | 1 | 0.0% | 0.1 KB | 0.0% |
| TOTAL: 6 | 21693 | 100.0% | 2.1 MB | 100.0% |
History cache:
| Reason | Count | %Count |
|---|---|---|
| Do not exist | 18646 | 97.3% |
| Negative hits | 311 | 1.6% |
| Positive hits | 172 | 0.9% |
| Cache misses | 34 | 0.2% |
| TOTAL: 4 | 19163 | 100.0% |
INND timer:
| Code region | Time | Pct | Invoked | Min(ms) | Avg(ms) | Max(ms) |
|---|---|---|---|---|---|---|
| article cancel | 00:00:00.052 | 0.0% | 218 | 0.000 | 0.239 | 3.000 |
| article cleanup | 00:00:00.089 | 0.0% | 18663 | 0.000 | 0.005 | 0.023 |
| article logging | 00:00:00.472 | 0.0% | 19110 | 0.000 | 0.025 | 0.056 |
| article parse | 00:00:00.250 | 0.0% | 21087 | 0.000 | 0.012 | 0.039 |
| article write | 00:00:04.043 | 0.0% | 18488 | 0.060 | 0.219 | 2.735 |
| artlog/artcncl | 00:00:00.002 | 0.0% | 177 | 0.000 | 0.011 | 0.125 |
| artlog/artwrite | 00:00:00.000 | 0.0% | 0 | 0.000 | 0.000 | 0.000 |
| data move | 00:00:00.013 | 0.0% | 23614 | 0.000 | 0.001 | 0.014 |
| hisgrep/artcncl | 00:00:00.009 | 0.0% | 202 | 0.000 | 0.045 | 1.000 |
| hishave/artcncl | 00:00:00.003 | 0.0% | 218 | 0.000 | 0.014 | 0.333 |
| history grep | 00:00:00.000 | 0.0% | 0 | 0.000 | 0.000 | 0.000 |
| history lookup | 00:00:00.301 | 0.0% | 19007 | 0.000 | 0.016 | 0.576 |
| history sync | 00:00:00.008 | 0.0% | 309 | 0.000 | 0.026 | 0.500 |
| history write | 00:00:00.907 | 0.0% | 18657 | 0.000 | 0.049 | 1.202 |
| hiswrite/artcncl | 00:00:00.000 | 0.0% | 16 | 0.000 | 0.000 | 0.000 |
| idle | 23:59:57.324 | 100.0% | 21840 | 2104.972 | 3955.921 | 13637.295 |
| nntp read | 00:00:00.534 | 0.0% | 21593 | 0.000 | 0.025 | 0.073 |
| overview write | 00:00:02.894 | 0.0% | 18488 | 0.036 | 0.157 | 1.468 |
| perl filter | 00:00:10.934 | 0.0% | 18657 | 0.445 | 0.586 | 1.593 |
| python filter | 00:00:00.000 | 0.0% | 0 | 0.000 | 0.000 | 0.000 |
| site send | 00:00:00.347 | 0.0% | 18590 | 0.000 | 0.019 | 0.077 |
| TOTAL: 24:00:20.939 | 24:00:18.182 | 100.0% | - | - | - | - |
INNfeed timer:
| Code region | Time | Pct | Invoked | Min(ms) | Avg(ms) | Max(ms) |
|---|---|---|---|---|---|---|
| article new | 00:00:00.033 | 0.0% | 18480 | 0.000 | 0.002 | 0.029 |
| article prepare | 00:00:00.013 | 0.0% | 147704 | 0.000 | 0.000 | 0.002 |
| article read | 00:00:00.682 | 0.0% | 18476 | 0.000 | 0.037 | 0.814 |
| backlog stats | 00:00:00.021 | 0.0% | 89569 | 0.000 | 0.000 | 0.004 |
| callbacks | 00:00:00.000 | 0.0% | 0 | 0.000 | 0.000 | 0.000 |
| data read | 00:00:00.336 | 0.0% | 61198 | 0.000 | 0.005 | 0.021 |
| data write | 00:00:00.682 | 0.0% | 42780 | 0.000 | 0.016 | 0.037 |
| idle | 23:58:15.598 | 100.0% | 89569 | 496.911 | 963.454 | 4268.950 |
| status file | 00:00:00.117 | 0.0% | 226 | 0.000 | 0.518 | 32.000 |
| TOTAL: 23:58:18.609 | 23:58:17.482 | 100.0% | - | - | - | - |
nnrpd timer:
| Code region | Time | Pct | Invoked | Min(ms) | Avg(ms) | Max(ms) |
|---|---|---|---|---|---|---|
| idle | 00:00:00.600 | 19.0% | 4 | 41.000 | 150.000 | 259.000 |
| newnews | 00:00:00.000 | 0.0% | 0 | 0.000 | 0.000 | 0.000 |
| nntpwrite | 00:00:00.000 | 0.0% | 37 | 0.000 | 0.000 | 0.000 |
| TOTAL: 00:00:03.159 | 00:00:00.600 | 19.0% | - | - | - | - |
Control commands to INND:
| Command | Number |
|---|---|
| L | 1 |
| flush | 3 |
| flushlogs | 2 |
| go | 2 |
| logmode | 2 |
| mode | 149 |
| name | 2 |
| pause | 2 |
| paused | 2 |
| reload | 2 |
| reserve | 2 |
| TOTAL: 11 | 169 |
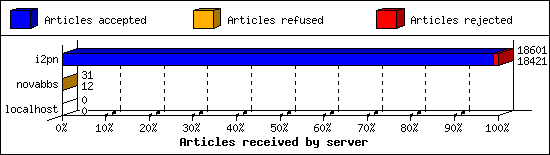
Incoming Feeds (INN):
| Server | Connects | Offered | Taken | Refused | Reject | %Accpt | Elapsed | |
|---|---|---|---|---|---|---|---|---|
| 1 | i2pn | 8 | 18601 | 18421 | 5 | 175 | 99% | 24:35:29 |
| 2 | novabbs | 13 | 31 | 12 | 19 | 0 | 38% | 02:37:31 |
| 3 | localhost | 35 | 0 | 0 | 0 | 0 | 0% | 00:00:00 |
| TOTAL: 3 | 56 | 18632 | 18433 | 24 | 175 | 98% | 27:13:00 | |
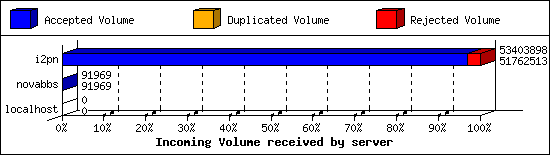
Incoming Volume (INN):
| Server | AcceptVol | DupVol | RejVol | TotalVol | %Acc | Vol/Art | |
|---|---|---|---|---|---|---|---|
| 1 | i2pn | 49.4 MB | 34.4 KB | 1.5 MB | 50.9 MB | 96% | 2.8 KB |
| 2 | novabbs | 89.8 KB | 0.0 KB | 0.0 KB | 89.8 KB | 100% | 7.5 KB |
| 3 | localhost | 0.0 KB | 0.0 KB | 0.0 KB | 0.0 KB | 0% | 0 |
| TOTAL: 3 | 49.5 MB | 34.4 KB | 1.5 MB | 51.0 MB | 96% | 2.8 KB | |
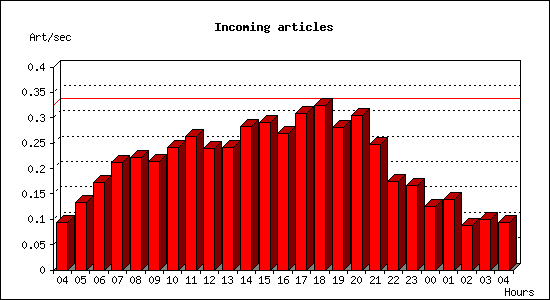
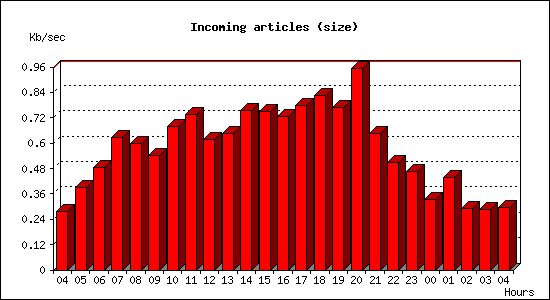
Incoming articles:
| Date | Articles | %Arts | Art/sec | Size | %Size | KB/sec |
|---|---|---|---|---|---|---|
| Apr 15 04:15:02 - 04:59:59 | 253 | 1.4% | 0.09 | 747.6 KB | 1.5% | 0.28 |
| Apr 15 05:00:00 - 05:59:59 | 477 | 2.6% | 0.13 | 1.4 MB | 2.8% | 0.39 |
| Apr 15 06:00:00 - 06:59:59 | 620 | 3.4% | 0.17 | 1.7 MB | 3.4% | 0.48 |
| Apr 15 07:00:00 - 07:59:59 | 765 | 4.1% | 0.21 | 2.2 MB | 4.4% | 0.63 |
| Apr 15 08:00:00 - 08:59:59 | 795 | 4.3% | 0.22 | 2.1 MB | 4.2% | 0.60 |
| Apr 15 09:00:00 - 09:59:59 | 773 | 4.2% | 0.21 | 1.9 MB | 3.8% | 0.54 |
| Apr 15 10:00:00 - 10:59:59 | 869 | 4.7% | 0.24 | 2.4 MB | 4.8% | 0.68 |
| Apr 15 11:00:00 - 11:59:59 | 948 | 5.1% | 0.26 | 2.6 MB | 5.2% | 0.73 |
| Apr 15 12:00:00 - 12:59:59 | 862 | 4.7% | 0.24 | 2.2 MB | 4.4% | 0.61 |
| Apr 15 13:00:00 - 13:59:59 | 871 | 4.7% | 0.24 | 2.3 MB | 4.6% | 0.65 |
| Apr 15 14:00:00 - 14:59:59 | 1017 | 5.5% | 0.28 | 2.7 MB | 5.4% | 0.76 |
| Apr 15 15:00:00 - 15:59:59 | 1049 | 5.7% | 0.29 | 2.6 MB | 5.3% | 0.75 |
| Apr 15 16:00:00 - 16:59:59 | 967 | 5.2% | 0.27 | 2.6 MB | 5.2% | 0.73 |
| Apr 15 17:00:00 - 17:59:59 | 1112 | 6.0% | 0.31 | 2.7 MB | 5.5% | 0.78 |
| Apr 15 18:00:00 - 18:59:59 | 1166 | 6.3% | 0.32 | 2.9 MB | 5.9% | 0.83 |
| Apr 15 19:00:00 - 19:59:59 | 1014 | 5.5% | 0.28 | 2.7 MB | 5.5% | 0.77 |
| Apr 15 20:00:00 - 20:59:59 | 1095 | 5.9% | 0.30 | 3.3 MB | 6.8% | 0.95 |
| Apr 15 21:00:00 - 21:59:59 | 893 | 4.8% | 0.25 | 2.3 MB | 4.6% | 0.64 |
| Apr 15 22:00:00 - 22:59:59 | 629 | 3.4% | 0.17 | 1.8 MB | 3.6% | 0.51 |
| Apr 15 23:00:00 - 23:59:59 | 599 | 3.2% | 0.17 | 1.6 MB | 3.3% | 0.47 |
| Apr 16 00:00:00 - 00:59:59 | 449 | 2.4% | 0.12 | 1.2 MB | 2.4% | 0.33 |
| Apr 16 01:00:00 - 01:59:59 | 503 | 2.7% | 0.14 | 1.5 MB | 3.1% | 0.44 |
| Apr 16 02:00:00 - 02:59:59 | 318 | 1.7% | 0.09 | 1.0 MB | 2.1% | 0.29 |
| Apr 16 03:00:00 - 03:59:59 | 358 | 1.9% | 0.10 | 1.0 MB | 2.0% | 0.29 |
| Apr 16 04:00:00 - 04:15:01 | 84 | 0.5% | 0.09 | 264.8 KB | 0.5% | 0.29 |
| TOTAL: 23:59:59 | 18486 | 100.0% | 0.21 | 49.6 MB | 100.0% | 0.59 |
Sites sending bad articles:
| Server | Total | Group | Dist | Duplic | Unapp | TooOld | Site | Line | Other | |
|---|---|---|---|---|---|---|---|---|---|---|
| 1 | i2pn | 622 | 16 | 0 | 6 | 0 | 0 | 0 | 0 | 600 |
| TOTAL: 1 | 622 | 16 | 0 | 6 | 0 | 0 | 0 | 0 | 600 | |
Unwanted newsgroups [Top 20]:
| Newsgroup | Count |
|---|---|
| alt.pl.nieruchomosci.gielda | 11 |
| hk.politics | 4 |
| a.bsu.religion | 1 |
| TOTAL: 3 | 16 |
INND Perl filter [Top 20]:
| Reason | Count |
|---|---|
| Scoring filter (s5) | 90 |
| Scoring filter (s6) | 37 |
| Scoring filter (s7) | 16 |
| Scoring filter (n4) | 10 |
| TOTAL: 4 | 153 |
NoCeM on Spool:
| Id | Good | Bad | Unique | Total |
|---|---|---|---|---|
| bleachbot@httrack.com | 86 | 0 | 86 | 86 |
| TOTAL: 1 | 86 | 16 | 86 | 86 |
Miscellaneous innd statistics [Top 10]:
| Event | Server | Number |
|---|---|---|
| Including strange strings | ||
| i2pn | 447 | |
| TOTAL: 1 | 447 | |
| TOTAL: 1 | 447 | |
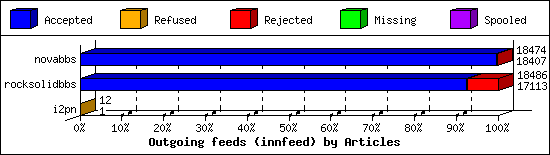
Outgoing Feeds (innfeed) by Articles:
| Server | Offered | Taken | Refused | Reject | Miss | Spool | %Took | Elapsed | |
|---|---|---|---|---|---|---|---|---|---|
| 1 | novabbs | 18488 | 18407 | 12 | 55 | 0 | 0 | 99% | 23:59:57 |
| 2 | rocksolidbbs | 18508 | 17113 | 11 | 1362 | 0 | 0 | 92% | 23:59:57 |
| 3 | i2pn | 19 | 1 | 11 | 0 | 0 | 0 | 5% | 01:10:32 |
| TOTAL: 3 | 37015 | 35521 | 34 | 1417 | 0 | 0 | 95% | 49:10:26 | |
Outgoing Feeds (innfeed) by Volume:
| Server | AcceptVol | RejectVol | TotalVol | Volume/sec | Vol/Art | Elapsed | |
|---|---|---|---|---|---|---|---|
| 1 | novabbs | 49.4 MB | 184.4 KB | 49.6 MB | 0.6 KB/s | 2.7 KB | 23:59:57 |
| 2 | rocksolidbbs | 45.6 MB | 4.0 MB | 49.6 MB | 0.6 KB/s | 2.7 KB | 23:59:57 |
| 3 | i2pn | 2.4 KB | 0.0 KB | 2.4 KB | 0.0 KB/s | 2.4 KB | 01:10:32 |
| TOTAL: 3 | 95.0 MB | 4.2 MB | 99.2 MB | 0.6 KB/s | 2.7 KB | 49:10:26 | |

NNRP readership statistics:
| System | Conn | Arts | Size | Groups | Post | Rej | Elapsed | |
|---|---|---|---|---|---|---|---|---|
| 1 | 125.64.94.211 | 1 | 0 | 0.0 KB | 0 | 0 | 0 | 00:00:02 |
| 2 | 141.98.80.117 | 1 | 0 | 0.0 KB | 0 | 0 | 0 | 00:00:00 |
| TOTAL: 2 | 2 | 0 | 0.0 KB | 0 | 0 | 0 | 00:00:03 | |
NNRP readership statistics (by domain):
| System | Conn | Arts | Size | Groups | Post | Rej | Elapsed | |
|---|---|---|---|---|---|---|---|---|
| 1 | unresolved | 2 | 0 | 0.0 KB | 0 | 0 | 0 | 00:00:03 |
| TOTAL: 1 | 2 | 0 | 0.0 KB | 0 | 0 | 0 | 00:00:03 | |
NNRP total resource statistics [Top 20]:
| System | User(ms) | System(ms) | Idle(ms) | Elapsed |
|---|---|---|---|---|
| 125.64.94.211 | 0.044 | 0.000 | 0.000 | 00:00:02 |
| 141.98.80.117 | 0.044 | 0.004 | 0.000 | 00:00:00 |
| TOTAL: 2 | 0.088 | 0.004 | 0.000 | 00:00:03 |
NNRP unrecognized commands (by host):
| System | Conn |
|---|---|
| 141.98.80.117 | 1 |
| TOTAL: 1 | 1 |
NNRP unrecognized commands (by command):
| Command | Count |
|---|---|
| #003 | 1 |
| TOTAL: 1 | 1 |
NNRP client timeouts [Top 20]:
| System | Conn | Peer |
|---|---|---|
| 141.98.80.117 | 1 | 1 |
| TOTAL: 1 | 1 | 1 |
