
Log entries by program:
| Program name | Lines | %Lines | Size | %Size |
|---|---|---|---|---|
| inn | 18932 | 89.0% | 1.8 MB | 84.8% |
| innd | 1368 | 6.4% | 201.1 KB | 9.4% |
| innfeed | 838 | 3.9% | 108.1 KB | 5.1% |
| nocem | 120 | 0.6% | 13.9 KB | 0.7% |
| nnrpd | 11 | 0.1% | 1.2 KB | 0.1% |
| controlchan | 1 | 0.0% | 0.1 KB | 0.0% |
| TOTAL: 6 | 21270 | 100.0% | 2.1 MB | 100.0% |
History cache:
| Reason | Count | %Count |
|---|---|---|
| Do not exist | 18374 | 97.5% |
| Negative hits | 269 | 1.4% |
| Positive hits | 175 | 0.9% |
| Cache misses | 34 | 0.2% |
| TOTAL: 4 | 18852 | 100.0% |
INND timer:
| Code region | Time | Pct | Invoked | Min(ms) | Avg(ms) | Max(ms) |
|---|---|---|---|---|---|---|
| article cancel | 00:00:00.091 | 0.0% | 224 | 0.000 | 0.406 | 5.250 |
| article cleanup | 00:00:00.092 | 0.0% | 18386 | 0.000 | 0.005 | 0.026 |
| article logging | 00:00:00.451 | 0.0% | 18747 | 0.000 | 0.024 | 0.104 |
| article parse | 00:00:00.225 | 0.0% | 20489 | 0.000 | 0.011 | 0.053 |
| article write | 00:00:05.043 | 0.0% | 18226 | 0.115 | 0.277 | 1.247 |
| artlog/artcncl | 00:00:00.001 | 0.0% | 179 | 0.000 | 0.006 | 0.143 |
| artlog/artwrite | 00:00:00.000 | 0.0% | 0 | 0.000 | 0.000 | 0.000 |
| data move | 00:00:00.011 | 0.0% | 22585 | 0.000 | 0.000 | 0.008 |
| hisgrep/artcncl | 00:00:00.007 | 0.0% | 213 | 0.000 | 0.033 | 0.500 |
| hishave/artcncl | 00:00:00.003 | 0.0% | 224 | 0.000 | 0.013 | 0.200 |
| history grep | 00:00:00.000 | 0.0% | 0 | 0.000 | 0.000 | 0.000 |
| history lookup | 00:00:00.167 | 0.0% | 18672 | 0.000 | 0.009 | 0.400 |
| history sync | 00:00:00.011 | 0.0% | 305 | 0.000 | 0.036 | 0.500 |
| history write | 00:00:03.453 | 0.0% | 18386 | 0.015 | 0.188 | 2.456 |
| hiswrite/artcncl | 00:00:00.023 | 0.0% | 11 | 0.000 | 2.091 | 10.500 |
| idle | 23:59:54.610 | 100.0% | 21184 | 2213.834 | 4078.295 | 10001.467 |
| nntp read | 00:00:00.521 | 0.0% | 20948 | 0.000 | 0.025 | 0.093 |
| overview write | 00:00:02.441 | 0.0% | 18226 | 0.015 | 0.134 | 1.269 |
| perl filter | 00:00:10.752 | 0.0% | 18386 | 0.469 | 0.585 | 0.955 |
| python filter | 00:00:00.000 | 0.0% | 0 | 0.000 | 0.000 | 0.000 |
| site send | 00:00:00.258 | 0.0% | 18336 | 0.000 | 0.014 | 0.059 |
| TOTAL: 24:00:20.686 | 24:00:18.160 | 100.0% | - | - | - | - |
INNfeed timer:
| Code region | Time | Pct | Invoked | Min(ms) | Avg(ms) | Max(ms) |
|---|---|---|---|---|---|---|
| article new | 00:00:00.025 | 0.0% | 18235 | 0.000 | 0.001 | 0.016 |
| article prepare | 00:00:00.018 | 0.0% | 145664 | 0.000 | 0.000 | 0.002 |
| article read | 00:00:00.685 | 0.0% | 18234 | 0.000 | 0.038 | 0.448 |
| backlog stats | 00:00:00.039 | 0.0% | 80352 | 0.000 | 0.000 | 0.008 |
| callbacks | 00:00:00.000 | 0.0% | 0 | 0.000 | 0.000 | 0.000 |
| data read | 00:00:00.311 | 0.0% | 56280 | 0.000 | 0.006 | 0.022 |
| data write | 00:00:00.592 | 0.0% | 38104 | 0.000 | 0.016 | 0.049 |
| idle | 23:57:28.210 | 100.0% | 80352 | 519.003 | 1073.380 | 2645.577 |
| status file | 00:00:00.064 | 0.0% | 201 | 0.000 | 0.318 | 2.000 |
| TOTAL: 23:57:30.902 | 23:57:29.944 | 100.0% | - | - | - | - |
nnrpd timer:
| Code region | Time | Pct | Invoked | Min(ms) | Avg(ms) | Max(ms) |
|---|---|---|---|---|---|---|
| idle | 00:00:09.830 | 93.9% | 3 | 84.000 | 3276.667 | 9662.000 |
| newnews | 00:00:00.000 | 0.0% | 0 | 0.000 | 0.000 | 0.000 |
| nntpwrite | 00:00:00.001 | 0.0% | 13 | 0.000 | 0.077 | 0.091 |
| TOTAL: 00:00:10.469 | 00:00:09.831 | 93.9% | - | - | - | - |
Control commands to INND:
| Command | Number |
|---|---|
| L | 1 |
| flush | 3 |
| flushlogs | 2 |
| go | 2 |
| logmode | 2 |
| mode | 149 |
| name | 2 |
| pause | 2 |
| paused | 2 |
| reload | 2 |
| reserve | 2 |
| TOTAL: 11 | 169 |
Incoming Feeds (INN):
| Server | Connects | Offered | Taken | Refused | Reject | %Accpt | Elapsed | |
|---|---|---|---|---|---|---|---|---|
| 1 | i2pn | 6 | 18263 | 18096 | 7 | 160 | 99% | 24:23:05 |
| 2 | novabbs | 12 | 32 | 1 | 31 | 0 | 3% | 02:53:10 |
| 3 | localhost | 35 | 0 | 0 | 0 | 0 | 0% | 00:00:00 |
| TOTAL: 3 | 53 | 18295 | 18097 | 38 | 160 | 98% | 27:16:15 | |
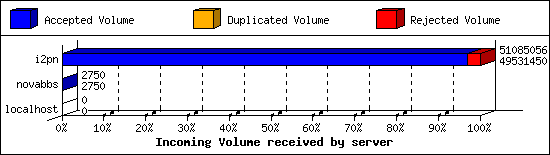
Incoming Volume (INN):
| Server | AcceptVol | DupVol | RejVol | TotalVol | %Acc | Vol/Art | |
|---|---|---|---|---|---|---|---|
| 1 | i2pn | 47.2 MB | 0.0 KB | 1.5 MB | 48.7 MB | 96% | 2.7 KB |
| 2 | novabbs | 2.7 KB | 0.0 KB | 0.0 KB | 2.7 KB | 100% | 2.7 KB |
| 3 | localhost | 0.0 KB | 0.0 KB | 0.0 KB | 0.0 KB | 0% | 0 |
| TOTAL: 3 | 47.2 MB | 0.0 KB | 1.5 MB | 48.7 MB | 96% | 2.7 KB | |
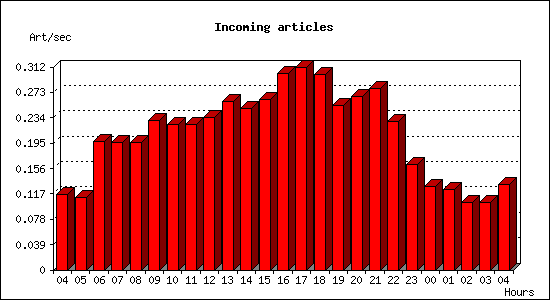
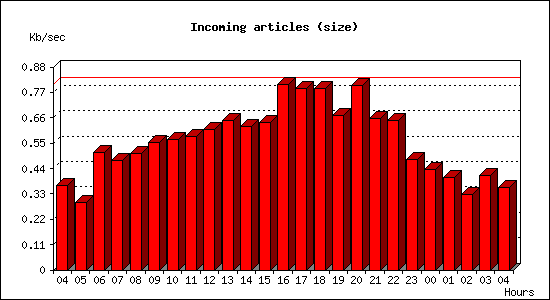
Incoming articles:
| Date | Articles | %Arts | Art/sec | Size | %Size | KB/sec |
|---|---|---|---|---|---|---|
| Apr 16 04:15:01 - 04:59:59 | 314 | 1.7% | 0.12 | 984.4 KB | 2.0% | 0.36 |
| Apr 16 05:00:00 - 05:59:59 | 399 | 2.2% | 0.11 | 1.0 MB | 2.2% | 0.29 |
| Apr 16 06:00:00 - 06:59:59 | 711 | 3.9% | 0.20 | 1.8 MB | 3.8% | 0.51 |
| Apr 16 07:00:00 - 07:59:59 | 706 | 3.9% | 0.20 | 1.7 MB | 3.5% | 0.47 |
| Apr 16 08:00:00 - 08:59:59 | 707 | 3.9% | 0.20 | 1.8 MB | 3.7% | 0.51 |
| Apr 16 09:00:00 - 09:59:59 | 827 | 4.5% | 0.23 | 1.9 MB | 4.1% | 0.55 |
| Apr 16 10:00:00 - 10:59:59 | 806 | 4.4% | 0.22 | 2.0 MB | 4.2% | 0.57 |
| Apr 16 11:00:00 - 11:59:59 | 805 | 4.4% | 0.22 | 2.0 MB | 4.3% | 0.58 |
| Apr 16 12:00:00 - 12:59:59 | 846 | 4.6% | 0.23 | 2.1 MB | 4.5% | 0.61 |
| Apr 16 13:00:00 - 13:59:59 | 934 | 5.1% | 0.26 | 2.3 MB | 4.8% | 0.65 |
| Apr 16 14:00:00 - 14:59:59 | 894 | 4.9% | 0.25 | 2.2 MB | 4.6% | 0.62 |
| Apr 16 15:00:00 - 15:59:59 | 942 | 5.2% | 0.26 | 2.2 MB | 4.7% | 0.64 |
| Apr 16 16:00:00 - 16:59:59 | 1086 | 6.0% | 0.30 | 2.8 MB | 5.9% | 0.80 |
| Apr 16 17:00:00 - 17:59:59 | 1122 | 6.2% | 0.31 | 2.8 MB | 5.8% | 0.79 |
| Apr 16 18:00:00 - 18:59:59 | 1081 | 5.9% | 0.30 | 2.8 MB | 5.8% | 0.79 |
| Apr 16 19:00:00 - 19:59:59 | 908 | 5.0% | 0.25 | 2.3 MB | 4.9% | 0.67 |
| Apr 16 20:00:00 - 20:59:59 | 960 | 5.3% | 0.27 | 2.8 MB | 5.9% | 0.80 |
| Apr 16 21:00:00 - 21:59:59 | 1005 | 5.5% | 0.28 | 2.3 MB | 4.9% | 0.66 |
| Apr 16 22:00:00 - 22:59:59 | 822 | 4.5% | 0.23 | 2.3 MB | 4.8% | 0.65 |
| Apr 16 23:00:00 - 23:59:59 | 582 | 3.2% | 0.16 | 1.7 MB | 3.5% | 0.48 |
| Apr 17 00:00:00 - 00:59:59 | 460 | 2.5% | 0.13 | 1.5 MB | 3.2% | 0.44 |
| Apr 17 01:00:00 - 01:59:59 | 446 | 2.4% | 0.12 | 1.4 MB | 3.0% | 0.40 |
| Apr 17 02:00:00 - 02:59:59 | 374 | 2.1% | 0.10 | 1.2 MB | 2.4% | 0.33 |
| Apr 17 03:00:00 - 03:59:59 | 375 | 2.1% | 0.10 | 1.4 MB | 3.0% | 0.41 |
| Apr 17 04:00:00 - 04:15:01 | 119 | 0.7% | 0.13 | 321.1 KB | 0.7% | 0.36 |
| TOTAL: 24:00:00 | 18231 | 100.0% | 0.21 | 47.7 MB | 100.0% | 0.56 |
Sites sending bad articles:
| Server | Total | Group | Dist | Duplic | Unapp | TooOld | Site | Line | Other | |
|---|---|---|---|---|---|---|---|---|---|---|
| 1 | i2pn | 522 | 1 | 0 | 0 | 0 | 0 | 0 | 0 | 521 |
| TOTAL: 1 | 522 | 1 | 0 | 0 | 0 | 0 | 0 | 0 | 521 | |
Unwanted newsgroups [Top 20]:
| Newsgroup | Count |
|---|---|
| alt.fr.outil.thunderbird | 1 |
| TOTAL: 1 | 1 |
INND Perl filter [Top 20]:
| Reason | Count |
|---|---|
| Scoring filter (s5) | 86 |
| Scoring filter (s6) | 47 |
| Scoring filter (s7) | 16 |
| Scoring filter (n4) | 10 |
| TOTAL: 4 | 159 |
NoCeM on Spool:
| Id | Good | Bad | Unique | Total |
|---|---|---|---|---|
| bleachbot@httrack.com | 87 | 0 | 87 | 87 |
| TOTAL: 1 | 87 | 23 | 87 | 87 |
Miscellaneous innd statistics [Top 10]:
| Event | Server | Number |
|---|---|---|
| Including strange strings | ||
| i2pn | 362 | |
| TOTAL: 1 | 362 | |
| TOTAL: 1 | 362 | |
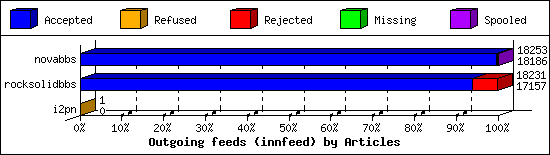
Outgoing Feeds (innfeed) by Articles:
| Server | Offered | Taken | Refused | Reject | Miss | Spool | %Took | Elapsed | |
|---|---|---|---|---|---|---|---|---|---|
| 1 | novabbs | 18238 | 18186 | 5 | 39 | 0 | 23 | 99% | 23:59:57 |
| 2 | rocksolidbbs | 18239 | 17157 | 2 | 1072 | 0 | 0 | 94% | 23:59:58 |
| 3 | i2pn | 1 | 0 | 1 | 0 | 0 | 0 | 0% | 00:10:01 |
| TOTAL: 3 | 36478 | 35343 | 8 | 1111 | 0 | 23 | 96% | 48:09:56 | |
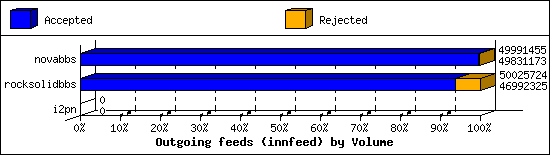
Outgoing Feeds (innfeed) by Volume:
| Server | AcceptVol | RejectVol | TotalVol | Volume/sec | Vol/Art | Elapsed | |
|---|---|---|---|---|---|---|---|
| 1 | novabbs | 47.5 MB | 156.5 KB | 47.7 MB | 0.6 KB/s | 2.7 KB | 23:59:57 |
| 2 | rocksolidbbs | 44.8 MB | 2.9 MB | 47.7 MB | 0.6 KB/s | 2.7 KB | 23:59:58 |
| 3 | i2pn | 0.0 KB | 0.0 KB | 0.0 KB | 0.0 KB/s | 0 | 00:10:01 |
| TOTAL: 3 | 92.3 MB | 3.0 MB | 95.4 MB | 0.6 KB/s | 2.7 KB | 48:09:56 | |
NNRP readership statistics:
| System | Conn | Arts | Size | Groups | Post | Rej | Elapsed | |
|---|---|---|---|---|---|---|---|---|
| 1 | 162.243.138.97 | 1 | 0 | 0.0 KB | 0 | 0 | 0 | 00:00:09 |
| 2 | scan-141.security.ipip.net | 1 | 0 | 0.0 KB | 0 | 0 | 0 | 00:00:00 |
| TOTAL: 2 | 2 | 0 | 0.0 KB | 0 | 0 | 0 | 00:00:10 | |
NNRP readership statistics (by domain):
| System | Conn | Arts | Size | Groups | Post | Rej | Elapsed | |
|---|---|---|---|---|---|---|---|---|
| 1 | *.security.ipip.net | 1 | 0 | 0.0 KB | 0 | 0 | 0 | 00:00:00 |
| 2 | unresolved | 1 | 0 | 0.0 KB | 0 | 0 | 0 | 00:00:09 |
| TOTAL: 2 | 2 | 0 | 0.0 KB | 0 | 0 | 0 | 00:00:10 | |
NNRP total resource statistics [Top 20]:
| System | User(ms) | System(ms) | Idle(ms) | Elapsed |
|---|---|---|---|---|
| 162.243.138.97 | 0.028 | 0.016 | 0.000 | 00:00:09 |
| scan-141.security.ipip.net | 0.036 | 0.008 | 0.000 | 00:00:00 |
| TOTAL: 2 | 0.064 | 0.024 | 0.000 | 00:00:10 |
NNRP unrecognized commands (by host):
| System | Conn |
|---|---|
| scan-141.security.ipip.net | 4 |
| TOTAL: 1 | 4 |
NNRP unrecognized commands (by command):
| Command | Count |
|---|---|
| GET / HTTP/1.1 | 1 |
| User-Agent: HTTP Banner Detection (https... | 1 |
| Host: 157.230.63.40:119 | 1 |
| Connection: close | 1 |
| TOTAL: 4 | 4 |
