Log entries by program:
| Program name | Lines | %Lines | Size | %Size |
|---|---|---|---|---|
| inn | 15196 | 87.0% | 1.4 MB | 82.1% |
| innd | 1318 | 7.5% | 201.6 KB | 11.3% |
| innfeed | 868 | 5.0% | 105.8 KB | 5.9% |
| nocem | 71 | 0.4% | 9.1 KB | 0.5% |
| nnrpd | 22 | 0.1% | 2.4 KB | 0.1% |
| controlchan | 1 | 0.0% | 0.0 KB | 0.0% |
| TOTAL: 6 | 17476 | 100.0% | 1.7 MB | 100.0% |
History cache:
| Reason | Count | %Count |
|---|---|---|
| Do not exist | 14647 | 98.2% |
| Negative hits | 155 | 1.0% |
| Positive hits | 101 | 0.7% |
| Cache misses | 20 | 0.1% |
| TOTAL: 4 | 14923 | 100.0% |
INND timer:
| Code region | Time | Pct | Invoked | Min(ms) | Avg(ms) | Max(ms) |
|---|---|---|---|---|---|---|
| article cancel | 00:00:00.031 | 0.0% | 128 | 0.000 | 0.242 | 1.667 |
| article cleanup | 00:00:00.071 | 0.0% | 14655 | 0.000 | 0.005 | 0.045 |
| article logging | 00:00:00.342 | 0.0% | 15089 | 0.000 | 0.023 | 0.106 |
| article parse | 00:00:00.196 | 0.0% | 16802 | 0.000 | 0.012 | 0.044 |
| article write | 00:00:03.621 | 0.0% | 14502 | 0.087 | 0.250 | 1.000 |
| artlog/artcncl | 00:00:00.001 | 0.0% | 109 | 0.000 | 0.009 | 0.250 |
| artlog/artwrite | 00:00:00.000 | 0.0% | 0 | 0.000 | 0.000 | 0.000 |
| data move | 00:00:00.006 | 0.0% | 18841 | 0.000 | 0.000 | 0.008 |
| hisgrep/artcncl | 00:00:00.001 | 0.0% | 118 | 0.000 | 0.008 | 0.111 |
| hishave/artcncl | 00:00:00.003 | 0.0% | 128 | 0.000 | 0.023 | 0.333 |
| history grep | 00:00:00.000 | 0.0% | 0 | 0.000 | 0.000 | 0.000 |
| history lookup | 00:00:00.854 | 0.0% | 14827 | 0.000 | 0.058 | 0.541 |
| history sync | 00:00:00.018 | 0.0% | 304 | 0.000 | 0.059 | 0.667 |
| history write | 00:00:01.207 | 0.0% | 14652 | 0.000 | 0.082 | 0.704 |
| hiswrite/artcncl | 00:00:00.000 | 0.0% | 10 | 0.000 | 0.000 | 0.000 |
| idle | 23:59:59.625 | 100.0% | 17360 | 2054.432 | 4976.937 | 16668.444 |
| nntp read | 00:00:00.369 | 0.0% | 17120 | 0.000 | 0.022 | 0.057 |
| overview write | 00:00:02.822 | 0.0% | 14502 | 0.024 | 0.195 | 3.000 |
| perl filter | 00:00:08.608 | 0.0% | 14652 | 0.409 | 0.587 | 0.958 |
| python filter | 00:00:00.000 | 0.0% | 0 | 0.000 | 0.000 | 0.000 |
| site send | 00:00:00.332 | 0.0% | 14566 | 0.000 | 0.023 | 0.107 |
| TOTAL: 24:00:20.079 | 24:00:18.107 | 100.0% | - | - | - | - |
INNfeed timer:
| Code region | Time | Pct | Invoked | Min(ms) | Avg(ms) | Max(ms) |
|---|---|---|---|---|---|---|
| article new | 00:00:00.014 | 0.0% | 14501 | 0.000 | 0.001 | 0.032 |
| article prepare | 00:00:00.013 | 0.0% | 115932 | 0.000 | 0.000 | 0.002 |
| article read | 00:00:00.498 | 0.0% | 14499 | 0.000 | 0.034 | 0.543 |
| backlog stats | 00:00:00.019 | 0.0% | 64855 | 0.000 | 0.000 | 0.005 |
| callbacks | 00:00:00.000 | 0.0% | 0 | 0.000 | 0.000 | 0.000 |
| data read | 00:00:00.215 | 0.0% | 44791 | 0.000 | 0.005 | 0.021 |
| data write | 00:00:00.472 | 0.0% | 30301 | 0.000 | 0.016 | 0.037 |
| idle | 23:59:46.563 | 100.0% | 64855 | 556.670 | 1331.995 | 3430.932 |
| status file | 00:00:00.073 | 0.0% | 205 | 0.000 | 0.356 | 1.000 |
| TOTAL: 23:59:48.718 | 23:59:47.867 | 100.0% | - | - | - | - |
nnrpd timer:
| Code region | Time | Pct | Invoked | Min(ms) | Avg(ms) | Max(ms) |
|---|---|---|---|---|---|---|
| idle | 00:30:00.219 | 99.3% | 4 | 82.000 | 450054.750 | 900027.500 |
| newnews | 00:00:00.000 | 0.0% | 0 | 0.000 | 0.000 | 0.000 |
| nntpwrite | 00:00:00.000 | 0.0% | 20 | 0.000 | 0.000 | 0.000 |
| TOTAL: 00:30:12.350 | 00:30:00.219 | 99.3% | - | - | - | - |
Control commands to INND:
| Command | Number |
|---|---|
| L | 1 |
| flush | 3 |
| flushlogs | 2 |
| go | 2 |
| logmode | 2 |
| mode | 149 |
| name | 2 |
| pause | 2 |
| paused | 2 |
| reload | 2 |
| reserve | 2 |
| TOTAL: 11 | 169 |
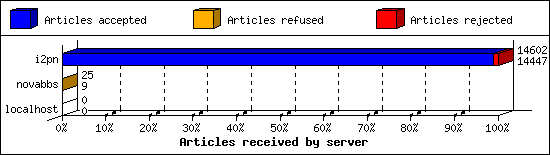
Incoming Feeds (INN):
| Server | Connects | Offered | Taken | Refused | Reject | %Accpt | Elapsed | |
|---|---|---|---|---|---|---|---|---|
| 1 | i2pn | 7 | 14602 | 14447 | 2 | 153 | 98% | 24:36:19 |
| 2 | novabbs | 15 | 25 | 9 | 16 | 0 | 36% | 02:53:26 |
| 3 | localhost | 32 | 0 | 0 | 0 | 0 | 0% | 00:00:00 |
| TOTAL: 3 | 54 | 14627 | 14456 | 18 | 153 | 98% | 27:29:45 | |
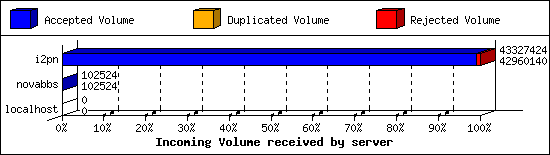
Incoming Volume (INN):
| Server | AcceptVol | DupVol | RejVol | TotalVol | %Acc | Vol/Art | |
|---|---|---|---|---|---|---|---|
| 1 | i2pn | 41.0 MB | 8.8 KB | 349.9 KB | 41.3 MB | 99% | 2.9 KB |
| 2 | novabbs | 100.1 KB | 0.0 KB | 0.0 KB | 100.1 KB | 100% | 11.1 KB |
| 3 | localhost | 0.0 KB | 0.0 KB | 0.0 KB | 0.0 KB | 0% | 0 |
| TOTAL: 3 | 41.1 MB | 8.8 KB | 349.9 KB | 41.4 MB | 99% | 2.9 KB | |
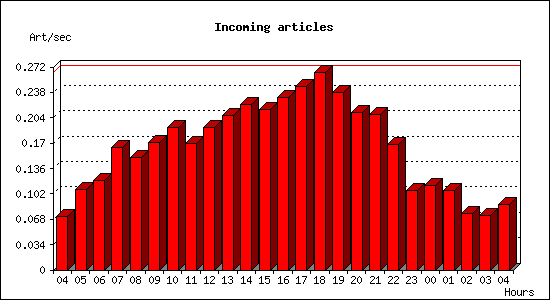
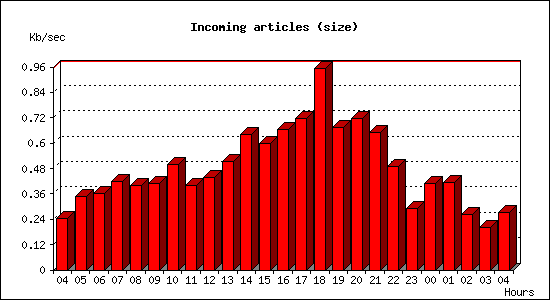
Incoming articles:
| Date | Articles | %Arts | Art/sec | Size | %Size | KB/sec |
|---|---|---|---|---|---|---|
| Apr 20 04:15:01 - 04:59:59 | 192 | 1.3% | 0.07 | 661.5 KB | 1.6% | 0.25 |
| Apr 20 05:00:00 - 05:59:59 | 387 | 2.7% | 0.11 | 1.2 MB | 3.0% | 0.35 |
| Apr 20 06:00:00 - 06:59:59 | 432 | 3.0% | 0.12 | 1.3 MB | 3.1% | 0.36 |
| Apr 20 07:00:00 - 07:59:59 | 590 | 4.1% | 0.16 | 1.5 MB | 3.6% | 0.42 |
| Apr 20 08:00:00 - 08:59:59 | 542 | 3.7% | 0.15 | 1.4 MB | 3.4% | 0.40 |
| Apr 20 09:00:00 - 09:59:59 | 615 | 4.2% | 0.17 | 1.4 MB | 3.5% | 0.41 |
| Apr 20 10:00:00 - 10:59:59 | 689 | 4.8% | 0.19 | 1.8 MB | 4.3% | 0.50 |
| Apr 20 11:00:00 - 11:59:59 | 611 | 4.2% | 0.17 | 1.4 MB | 3.4% | 0.40 |
| Apr 20 12:00:00 - 12:59:59 | 687 | 4.7% | 0.19 | 1.5 MB | 3.7% | 0.44 |
| Apr 20 13:00:00 - 13:59:59 | 747 | 5.2% | 0.21 | 1.8 MB | 4.4% | 0.51 |
| Apr 20 14:00:00 - 14:59:59 | 799 | 5.5% | 0.22 | 2.2 MB | 5.5% | 0.64 |
| Apr 20 15:00:00 - 15:59:59 | 776 | 5.4% | 0.22 | 2.1 MB | 5.1% | 0.60 |
| Apr 20 16:00:00 - 16:59:59 | 832 | 5.7% | 0.23 | 2.3 MB | 5.7% | 0.66 |
| Apr 20 17:00:00 - 17:59:59 | 884 | 6.1% | 0.25 | 2.5 MB | 6.1% | 0.72 |
| Apr 20 18:00:00 - 18:59:59 | 952 | 6.6% | 0.26 | 3.4 MB | 8.1% | 0.95 |
| Apr 20 19:00:00 - 19:59:59 | 854 | 5.9% | 0.24 | 2.4 MB | 5.7% | 0.67 |
| Apr 20 20:00:00 - 20:59:59 | 762 | 5.3% | 0.21 | 2.5 MB | 6.1% | 0.72 |
| Apr 20 21:00:00 - 21:59:59 | 752 | 5.2% | 0.21 | 2.3 MB | 5.5% | 0.65 |
| Apr 20 22:00:00 - 22:59:59 | 606 | 4.2% | 0.17 | 1.7 MB | 4.2% | 0.49 |
| Apr 20 23:00:00 - 23:59:59 | 382 | 2.6% | 0.11 | 1.0 MB | 2.5% | 0.29 |
| Apr 21 00:00:00 - 00:59:59 | 410 | 2.8% | 0.11 | 1.4 MB | 3.5% | 0.41 |
| Apr 21 01:00:00 - 01:59:59 | 385 | 2.7% | 0.11 | 1.5 MB | 3.5% | 0.41 |
| Apr 21 02:00:00 - 02:59:59 | 271 | 1.9% | 0.08 | 951.9 KB | 2.3% | 0.26 |
| Apr 21 03:00:00 - 03:59:59 | 265 | 1.8% | 0.07 | 728.7 KB | 1.7% | 0.20 |
| Apr 21 04:00:00 - 04:15:01 | 79 | 0.5% | 0.09 | 244.6 KB | 0.6% | 0.27 |
| TOTAL: 24:00:00 | 14501 | 100.0% | 0.17 | 41.2 MB | 100.0% | 0.49 |
Sites sending bad articles:
| Server | Total | Group | Dist | Duplic | Unapp | TooOld | Site | Line | Other | |
|---|---|---|---|---|---|---|---|---|---|---|
| 1 | i2pn | 587 | 3 | 0 | 3 | 0 | 0 | 0 | 0 | 581 |
| TOTAL: 1 | 587 | 3 | 0 | 3 | 0 | 0 | 0 | 0 | 581 | |
Unwanted newsgroups [Top 20]:
| Newsgroup | Count |
|---|---|
| hk.politics | 2 |
| alt.2600 | 1 |
| TOTAL: 2 | 3 |
INND Perl filter [Top 20]:
| Reason | Count |
|---|---|
| Scoring filter (s5) | 123 |
| Scoring filter (s1) | 16 |
| Scoring filter (s6) | 7 |
| Scoring filter (s7) | 1 |
| TOTAL: 4 | 147 |
NoCeM on Spool:
| Id | Good | Bad | Unique | Total |
|---|---|---|---|---|
| bleachbot@httrack.com | 60 | 0 | 61 | 61 |
| TOTAL: 1 | 60 | 4 | 61 | 61 |
Miscellaneous innd statistics [Top 10]:
| Event | Server | Number |
|---|---|---|
| Including strange strings | ||
| i2pn | 434 | |
| TOTAL: 1 | 434 | |
| TOTAL: 1 | 434 | |
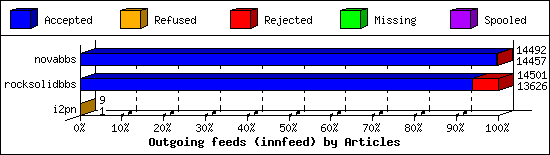
Outgoing Feeds (innfeed) by Articles:
| Server | Offered | Taken | Refused | Reject | Miss | Spool | %Took | Elapsed | |
|---|---|---|---|---|---|---|---|---|---|
| 1 | novabbs | 14499 | 14457 | 5 | 30 | 0 | 0 | 99% | 23:59:57 |
| 2 | rocksolidbbs | 14511 | 13626 | 6 | 869 | 0 | 0 | 93% | 23:59:58 |
| 3 | i2pn | 12 | 1 | 8 | 0 | 0 | 0 | 8% | 01:10:11 |
| TOTAL: 3 | 29022 | 28084 | 19 | 899 | 0 | 0 | 96% | 49:10:06 | |
Outgoing Feeds (innfeed) by Volume:
| Server | AcceptVol | RejectVol | TotalVol | Volume/sec | Vol/Art | Elapsed | |
|---|---|---|---|---|---|---|---|
| 1 | novabbs | 41.0 MB | 109.6 KB | 41.1 MB | 0.5 KB/s | 2.9 KB | 23:59:57 |
| 2 | rocksolidbbs | 38.5 MB | 2.8 MB | 41.2 MB | 0.5 KB/s | 2.9 KB | 23:59:58 |
| 3 | i2pn | 0.9 KB | 0.0 KB | 0.9 KB | 0.0 KB/s | 0.9 KB | 01:10:11 |
| TOTAL: 3 | 79.5 MB | 2.9 MB | 82.4 MB | 0.5 KB/s | 2.9 KB | 49:10:06 | |

NNRP readership statistics:
| System | Conn | Arts | Size | Groups | Post | Rej | Elapsed | |
|---|---|---|---|---|---|---|---|---|
| 1 | scan-141.security.ipip.net | 1 | 0 | 0.0 KB | 0 | 0 | 0 | 00:00:00 |
| 2 | 183.129.154.157 | 1 | 0 | 0.0 KB | 0 | 0 | 0 | 00:30:00 |
| 3 | 185.100.87.190 | 1 | 0 | 0.0 KB | 0 | 0 | 0 | 00:00:00 |
| TOTAL: 3 | 3 | 0 | 0.0 KB | 0 | 0 | 0 | 00:30:12 | |
NNRP readership statistics (by domain):
| System | Conn | Arts | Size | Groups | Post | Rej | Elapsed | |
|---|---|---|---|---|---|---|---|---|
| 1 | *.security.ipip.net | 1 | 0 | 0.0 KB | 0 | 0 | 0 | 00:00:00 |
| 2 | unresolved | 2 | 0 | 0.0 KB | 0 | 0 | 0 | 00:30:00 |
| TOTAL: 2 | 3 | 0 | 0.0 KB | 0 | 0 | 0 | 00:30:12 | |
NNRP total resource statistics [Top 20]:
| System | User(ms) | System(ms) | Idle(ms) | Elapsed |
|---|---|---|---|---|
| 183.129.154.157 | 0.056 | 0.012 | 0.000 | 00:30:00 |
| ? | 0.112 | 0.016 | 0.000 | 00:00:11 |
| scan-141.security.ipip.net | 0.040 | 0.004 | 0.000 | 00:00:00 |
| 185.100.87.190 | 0.048 | 0.004 | 0.000 | 00:00:00 |
| TOTAL: 4 | 0.256 | 0.036 | 0.000 | 00:30:12 |
NNRP unrecognized commands (by host):
| System | Conn |
|---|---|
| scan-141.security.ipip.net | 4 |
| 183.129.154.157 | 1 |
| TOTAL: 2 | 5 |
NNRP unrecognized commands (by command):
| Command | Count |
|---|---|
| GET / HTTP/1.0 | 1 |
| User-Agent: HTTP Banner Detection (https... | 1 |
| Connection: close | 1 |
| GET / HTTP/1.1 | 1 |
| Host: 157.230.63.40:119 | 1 |
| TOTAL: 5 | 5 |
NNRP client timeouts [Top 20]:
| System | Conn | Peer |
|---|---|---|
| 183.129.154.157 | 1 | 0 |
| TOTAL: 1 | 1 | 0 |
