Log entries by program:
| Program name | Lines | %Lines | Size | %Size |
|---|---|---|---|---|
| inn | 16508 | 86.8% | 1.6 MB | 82.2% |
| innd | 1292 | 6.8% | 188.9 KB | 9.7% |
| innfeed | 1049 | 5.5% | 138.3 KB | 7.1% |
| nocem | 130 | 0.7% | 15.7 KB | 0.8% |
| nnrpd | 39 | 0.2% | 3.9 KB | 0.2% |
| controlchan | 1 | 0.0% | 0.1 KB | 0.0% |
| TOTAL: 6 | 19019 | 100.0% | 1.9 MB | 100.0% |
History cache:
| Reason | Count | %Count |
|---|---|---|
| Do not exist | 15879 | 97.8% |
| Positive hits | 170 | 1.0% |
| Negative hits | 161 | 1.0% |
| Cache misses | 21 | 0.1% |
| TOTAL: 4 | 16231 | 100.0% |
INND timer:
| Code region | Time | Pct | Invoked | Min(ms) | Avg(ms) | Max(ms) |
|---|---|---|---|---|---|---|
| article cancel | 00:00:00.046 | 0.0% | 255 | 0.000 | 0.180 | 2.111 |
| article cleanup | 00:00:00.093 | 0.0% | 15826 | 0.000 | 0.006 | 0.032 |
| article logging | 00:00:00.401 | 0.0% | 16274 | 0.000 | 0.025 | 0.077 |
| article parse | 00:00:00.185 | 0.0% | 18091 | 0.000 | 0.010 | 0.041 |
| article write | 00:00:02.224 | 0.0% | 15667 | 0.045 | 0.142 | 0.923 |
| artlog/artcncl | 00:00:00.000 | 0.0% | 232 | 0.000 | 0.000 | 0.000 |
| artlog/artwrite | 00:00:00.000 | 0.0% | 0 | 0.000 | 0.000 | 0.000 |
| data move | 00:00:00.007 | 0.0% | 20321 | 0.000 | 0.000 | 0.019 |
| hisgrep/artcncl | 00:00:00.005 | 0.0% | 189 | 0.000 | 0.026 | 1.000 |
| hishave/artcncl | 00:00:00.002 | 0.0% | 255 | 0.000 | 0.008 | 0.333 |
| history grep | 00:00:00.000 | 0.0% | 0 | 0.000 | 0.000 | 0.000 |
| history lookup | 00:00:00.085 | 0.0% | 15998 | 0.000 | 0.005 | 0.053 |
| history sync | 00:00:00.008 | 0.0% | 307 | 0.000 | 0.026 | 0.500 |
| history write | 00:00:00.477 | 0.0% | 15824 | 0.000 | 0.030 | 0.103 |
| hiswrite/artcncl | 00:00:00.001 | 0.0% | 66 | 0.000 | 0.015 | 0.167 |
| idle | 24:00:02.071 | 100.0% | 18723 | 2597.121 | 4614.756 | 12247.918 |
| nntp read | 00:00:00.410 | 0.0% | 18473 | 0.000 | 0.022 | 0.064 |
| overview write | 00:00:02.230 | 0.0% | 15667 | 0.019 | 0.142 | 1.620 |
| perl filter | 00:00:09.112 | 0.0% | 15824 | 0.385 | 0.576 | 0.902 |
| python filter | 00:00:00.000 | 0.0% | 0 | 0.000 | 0.000 | 0.000 |
| site send | 00:00:00.164 | 0.0% | 15792 | 0.000 | 0.010 | 0.033 |
| TOTAL: 24:00:19.819 | 24:00:17.521 | 100.0% | - | - | - | - |
INNfeed timer:
| Code region | Time | Pct | Invoked | Min(ms) | Avg(ms) | Max(ms) |
|---|---|---|---|---|---|---|
| article new | 00:00:04.618 | 0.0% | 11149244 | 0.000 | 0.000 | 0.006 |
| article prepare | 00:00:00.008 | 0.0% | 62356 | 0.000 | 0.000 | 0.003 |
| article read | 00:00:00.571 | 0.0% | 15582 | 0.000 | 0.037 | 0.490 |
| backlog stats | 00:00:00.587 | 0.0% | 4498779 | 0.000 | 0.000 | 0.001 |
| callbacks | 00:00:00.000 | 0.0% | 0 | 0.000 | 0.000 | 0.000 |
| data read | 00:00:07.716 | 0.0% | 2767601 | 0.000 | 0.003 | 0.009 |
| data write | 00:00:08.363 | 0.0% | 2730088 | 0.002 | 0.003 | 0.040 |
| idle | 23:51:13.337 | 99.9% | 4498779 | 9.689 | 19.088 | 348.669 |
| status file | 00:00:00.203 | 0.0% | 331 | 0.000 | 0.613 | 8.250 |
| TOTAL: 23:52:17.083 | 23:51:35.403 | 100.0% | - | - | - | - |
nnrpd timer:
| Code region | Time | Pct | Invoked | Min(ms) | Avg(ms) | Max(ms) |
|---|---|---|---|---|---|---|
| idle | 00:00:10.369 | 86.9% | 11 | 10.500 | 942.636 | 9850.000 |
| newnews | 00:00:00.000 | 0.0% | 0 | 0.000 | 0.000 | 0.000 |
| nntpwrite | 00:00:00.000 | 0.0% | 29 | 0.000 | 0.000 | 0.000 |
| TOTAL: 00:00:11.930 | 00:00:10.369 | 86.9% | - | - | - | - |
Control commands to INND:
| Command | Number |
|---|---|
| L | 1 |
| flush | 3 |
| flushlogs | 2 |
| go | 2 |
| logmode | 2 |
| mode | 149 |
| name | 2 |
| pause | 2 |
| paused | 2 |
| reload | 2 |
| reserve | 2 |
| TOTAL: 11 | 169 |
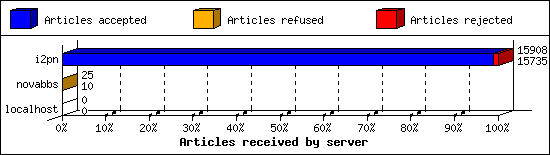
Incoming Feeds (INN):
| Server | Connects | Offered | Taken | Refused | Reject | %Accpt | Elapsed | |
|---|---|---|---|---|---|---|---|---|
| 1 | i2pn | 6 | 15908 | 15735 | 2 | 171 | 98% | 24:54:09 |
| 2 | novabbs | 11 | 25 | 10 | 15 | 0 | 40% | 02:36:18 |
| 3 | localhost | 30 | 0 | 0 | 0 | 0 | 0% | 00:00:00 |
| TOTAL: 3 | 47 | 15933 | 15745 | 17 | 171 | 98% | 27:30:27 | |
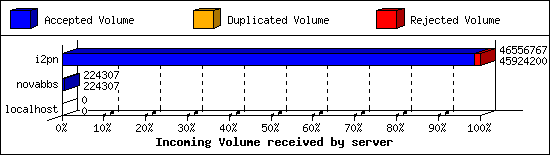
Incoming Volume (INN):
| Server | AcceptVol | DupVol | RejVol | TotalVol | %Acc | Vol/Art | |
|---|---|---|---|---|---|---|---|
| 1 | i2pn | 43.8 MB | 3.4 KB | 614.4 KB | 44.4 MB | 98% | 2.9 KB |
| 2 | novabbs | 219.0 KB | 0.0 KB | 0.0 KB | 219.0 KB | 100% | 21.9 KB |
| 3 | localhost | 0.0 KB | 0.0 KB | 0.0 KB | 0.0 KB | 0% | 0 |
| TOTAL: 3 | 44.0 MB | 3.4 KB | 614.4 KB | 44.6 MB | 98% | 2.9 KB | |
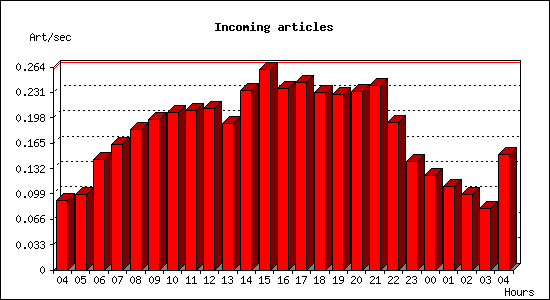
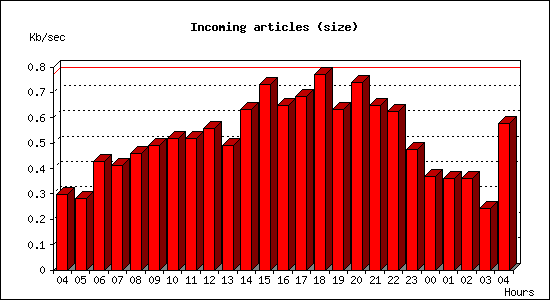
Incoming articles:
| Date | Articles | %Arts | Art/sec | Size | %Size | KB/sec |
|---|---|---|---|---|---|---|
| Apr 22 04:15:01 - 04:59:59 | 244 | 1.6% | 0.09 | 805.9 KB | 1.8% | 0.30 |
| Apr 22 05:00:00 - 05:59:59 | 353 | 2.3% | 0.10 | 1008.8 KB | 2.3% | 0.28 |
| Apr 22 06:00:00 - 06:59:59 | 516 | 3.3% | 0.14 | 1.5 MB | 3.4% | 0.43 |
| Apr 22 07:00:00 - 07:59:59 | 586 | 3.7% | 0.16 | 1.5 MB | 3.3% | 0.41 |
| Apr 22 08:00:00 - 08:59:59 | 660 | 4.2% | 0.18 | 1.6 MB | 3.7% | 0.46 |
| Apr 22 09:00:00 - 09:59:59 | 705 | 4.5% | 0.20 | 1.7 MB | 3.9% | 0.49 |
| Apr 22 10:00:00 - 10:59:59 | 739 | 4.7% | 0.21 | 1.8 MB | 4.2% | 0.52 |
| Apr 22 11:00:00 - 11:59:59 | 748 | 4.8% | 0.21 | 1.8 MB | 4.2% | 0.52 |
| Apr 22 12:00:00 - 12:59:59 | 758 | 4.8% | 0.21 | 2.0 MB | 4.5% | 0.56 |
| Apr 22 13:00:00 - 13:59:59 | 688 | 4.4% | 0.19 | 1.7 MB | 4.0% | 0.49 |
| Apr 22 14:00:00 - 14:59:59 | 841 | 5.4% | 0.23 | 2.2 MB | 5.1% | 0.63 |
| Apr 22 15:00:00 - 15:59:59 | 937 | 6.0% | 0.26 | 2.6 MB | 5.9% | 0.73 |
| Apr 22 16:00:00 - 16:59:59 | 852 | 5.4% | 0.24 | 2.3 MB | 5.2% | 0.65 |
| Apr 22 17:00:00 - 17:59:59 | 879 | 5.6% | 0.24 | 2.4 MB | 5.5% | 0.68 |
| Apr 22 18:00:00 - 18:59:59 | 831 | 5.3% | 0.23 | 2.7 MB | 6.2% | 0.77 |
| Apr 22 19:00:00 - 19:59:59 | 821 | 5.2% | 0.23 | 2.2 MB | 5.1% | 0.63 |
| Apr 22 20:00:00 - 20:59:59 | 836 | 5.3% | 0.23 | 2.6 MB | 5.9% | 0.74 |
| Apr 22 21:00:00 - 21:59:59 | 864 | 5.5% | 0.24 | 2.3 MB | 5.2% | 0.65 |
| Apr 22 22:00:00 - 22:59:59 | 691 | 4.4% | 0.19 | 2.2 MB | 5.0% | 0.62 |
| Apr 22 23:00:00 - 23:59:59 | 510 | 3.3% | 0.14 | 1.7 MB | 3.8% | 0.47 |
| Apr 23 00:00:00 - 00:59:59 | 444 | 2.8% | 0.12 | 1.3 MB | 3.0% | 0.37 |
| Apr 23 01:00:00 - 01:59:59 | 390 | 2.5% | 0.11 | 1.3 MB | 2.9% | 0.36 |
| Apr 23 02:00:00 - 02:59:59 | 354 | 2.3% | 0.10 | 1.3 MB | 2.9% | 0.36 |
| Apr 23 03:00:00 - 03:59:59 | 287 | 1.8% | 0.08 | 878.8 KB | 2.0% | 0.24 |
| Apr 23 04:00:00 - 04:15:01 | 135 | 0.9% | 0.15 | 521.1 KB | 1.2% | 0.58 |
| TOTAL: 24:00:00 | 15669 | 100.0% | 0.18 | 43.7 MB | 100.0% | 0.52 |
Sites sending bad articles:
| Server | Total | Group | Dist | Duplic | Unapp | TooOld | Site | Line | Other | |
|---|---|---|---|---|---|---|---|---|---|---|
| 1 | i2pn | 607 | 8 | 0 | 2 | 0 | 0 | 0 | 0 | 597 |
| TOTAL: 1 | 607 | 8 | 0 | 2 | 0 | 0 | 0 | 0 | 597 | |
Unwanted newsgroups [Top 20]:
| Newsgroup | Count |
|---|---|
| hk.politics | 5 |
| lada.politics | 1 |
| alt.sex.girl | 1 |
| alt.pl.nieruchomosci.gielda | 1 |
| TOTAL: 4 | 8 |
INND Perl filter [Top 20]:
| Reason | Count |
|---|---|
| Scoring filter (s5) | 98 |
| Scoring filter (s6) | 25 |
| Scoring filter (n6) | 16 |
| Scoring filter (s7) | 10 |
| TOTAL: 4 | 149 |
NoCeM on Spool:
| Id | Good | Bad | Unique | Total |
|---|---|---|---|---|
| bleachbot@httrack.com | 118 | 0 | 139 | 139 |
| TOTAL: 1 | 118 | 7 | 139 | 139 |
Miscellaneous innd statistics [Top 10]:
| Event | Server | Number |
|---|---|---|
| Including strange strings | ||
| i2pn | 448 | |
| TOTAL: 1 | 448 | |
| TOTAL: 1 | 448 | |
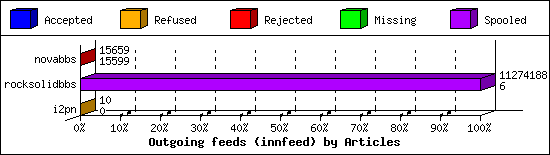
Outgoing Feeds (innfeed) by Articles:
| Server | Offered | Taken | Refused | Reject | Miss | Spool | %Took | Elapsed | |
|---|---|---|---|---|---|---|---|---|---|
| 1 | novabbs | 15661 | 15599 | 1 | 59 | 0 | 0 | 99% | 23:59:58 |
| 2 | rocksolidbbs | 11430296 | 6 | 1 | 1 | 0 | 11274180 | 0% | 23:59:58 |
| 3 | i2pn | 13 | 0 | 10 | 0 | 0 | 0 | 0% | 01:24:05 |
| TOTAL: 3 | 11445970 | 15605 | 12 | 60 | 0 | 11274180 | 0% | 49:24:01 | |
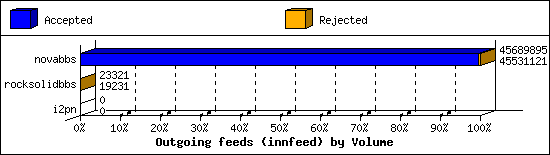
Outgoing Feeds (innfeed) by Volume:
| Server | AcceptVol | RejectVol | TotalVol | Volume/sec | Vol/Art | Elapsed | |
|---|---|---|---|---|---|---|---|
| 1 | novabbs | 43.4 MB | 155.1 KB | 43.6 MB | 0.5 KB/s | 2.8 KB | 23:59:58 |
| 2 | rocksolidbbs | 18.8 KB | 4.0 KB | 22.8 KB | 0.0 KB/s | 3.3 KB | 23:59:58 |
| 3 | i2pn | 0.0 KB | 0.0 KB | 0.0 KB | 0.0 KB/s | 0 | 01:24:05 |
| TOTAL: 3 | 43.4 MB | 159.0 KB | 43.6 MB | 0.3 KB/s | 2.8 KB | 49:24:01 | |
NNRP readership statistics:
| System | Conn | Arts | Size | Groups | Post | Rej | Elapsed | |
|---|---|---|---|---|---|---|---|---|
| 1 | 185.156.177.153 | 2 | 0 | 0.0 KB | 0 | 0 | 0 | 00:00:00 |
| 2 | pirate.census.shodan.io | 1 | 0 | 0.0 KB | 0 | 0 | 0 | 00:00:00 |
| 3 | worker-18.sfj.corp.censys.io | 1 | 0 | 0.0 KB | 0 | 0 | 0 | 00:00:00 |
| 4 | census4.shodan.io | 1 | 0 | 0.0 KB | 0 | 0 | 0 | 00:00:00 |
| 5 | 162.243.143.129 | 1 | 0 | 0.0 KB | 0 | 0 | 0 | 00:00:09 |
| 6 | scan-141.security.ipip.net | 1 | 0 | 0.0 KB | 0 | 0 | 0 | 00:00:00 |
| TOTAL: 6 | 7 | 0 | 0.0 KB | 0 | 0 | 0 | 00:00:11 | |
NNRP readership statistics (by domain):
| System | Conn | Arts | Size | Groups | Post | Rej | Elapsed | |
|---|---|---|---|---|---|---|---|---|
| 1 | *.census.shodan.io | 1 | 0 | 0.0 KB | 0 | 0 | 0 | 00:00:00 |
| 2 | *.sfj.corp.censys.io | 1 | 0 | 0.0 KB | 0 | 0 | 0 | 00:00:00 |
| 3 | *.security.ipip.net | 1 | 0 | 0.0 KB | 0 | 0 | 0 | 00:00:00 |
| 4 | *.shodan.io | 1 | 0 | 0.0 KB | 0 | 0 | 0 | 00:00:00 |
| 5 | unresolved | 3 | 0 | 0.0 KB | 0 | 0 | 0 | 00:00:10 |
| TOTAL: 5 | 7 | 0 | 0.0 KB | 0 | 0 | 0 | 00:00:11 | |
NNRP total resource statistics [Top 20]:
| System | User(ms) | System(ms) | Idle(ms) | Elapsed |
|---|---|---|---|---|
| 162.243.143.129 | 0.032 | 0.012 | 0.000 | 00:00:09 |
| scan-141.security.ipip.net | 0.036 | 0.008 | 0.000 | 00:00:00 |
| 185.156.177.153 | 0.076 | 0.012 | 0.000 | 00:00:00 |
| worker-18.sfj.corp.censys.io | 0.044 | 0.000 | 0.000 | 00:00:00 |
| census4.shodan.io | 0.052 | 0.000 | 0.000 | 00:00:00 |
| pirate.census.shodan.io | 0.044 | 0.000 | 0.000 | 00:00:00 |
| ? | 0.040 | 0.004 | 0.000 | 00:00:00 |
| TOTAL: 7 | 0.324 | 0.036 | 0.000 | 00:00:11 |
NNRP gethostbyaddr failures [Top 20]:
| System | Conn |
|---|---|
| ? (can't getpeername) | 1 |
| TOTAL: 1 | 1 |
NNRP unrecognized commands (by host):
| System | Conn |
|---|---|
| scan-141.security.ipip.net | 4 |
| 185.156.177.153 | 2 |
| TOTAL: 2 | 6 |
NNRP unrecognized commands (by command):
| Command | Count |
|---|---|
| #003 | 2 |
| Host: 157.230.63.40:119 | 1 |
| User-Agent: HTTP Banner Detection (https... | 1 |
| Connection: close | 1 |
| GET / HTTP/1.1 | 1 |
| TOTAL: 5 | 6 |
NNRP client timeouts [Top 20]:
| System | Conn | Peer |
|---|---|---|
| 185.156.177.153 | 2 | 2 |
| worker-18.sfj.corp.censys.io | 1 | 1 |
| TOTAL: 2 | 3 | 3 |
