
Log entries by program:
| Program name | Lines | %Lines | Size | %Size |
|---|---|---|---|---|
| inn | 17886 | 88.6% | 1.7 MB | 84.1% |
| innd | 1332 | 6.6% | 183.1 KB | 9.0% |
| innfeed | 895 | 4.4% | 130.8 KB | 6.4% |
| nocem | 74 | 0.4% | 8.4 KB | 0.4% |
| nnrpd | 7 | 0.0% | 0.7 KB | 0.0% |
| controlchan | 1 | 0.0% | 0.1 KB | 0.0% |
| TOTAL: 6 | 20195 | 100.0% | 2.0 MB | 100.0% |
History cache:
| Reason | Count | %Count |
|---|---|---|
| Do not exist | 17351 | 96.7% |
| Negative hits | 477 | 2.7% |
| Positive hits | 106 | 0.6% |
| Cache misses | 12 | 0.1% |
| TOTAL: 4 | 17946 | 100.0% |
INND timer:
| Code region | Time | Pct | Invoked | Min(ms) | Avg(ms) | Max(ms) |
|---|---|---|---|---|---|---|
| article cancel | 00:00:00.039 | 0.0% | 147 | 0.000 | 0.265 | 2.000 |
| article cleanup | 00:00:00.077 | 0.0% | 17386 | 0.000 | 0.004 | 0.063 |
| article logging | 00:00:00.428 | 0.0% | 17766 | 0.000 | 0.024 | 0.070 |
| article parse | 00:00:00.230 | 0.0% | 19649 | 0.000 | 0.012 | 0.040 |
| article write | 00:00:04.156 | 0.0% | 17214 | 0.046 | 0.241 | 4.855 |
| artlog/artcncl | 00:00:00.002 | 0.0% | 115 | 0.000 | 0.017 | 1.000 |
| artlog/artwrite | 00:00:00.000 | 0.0% | 0 | 0.000 | 0.000 | 0.000 |
| data move | 00:00:00.008 | 0.0% | 22294 | 0.000 | 0.000 | 0.008 |
| hisgrep/artcncl | 00:00:00.000 | 0.0% | 126 | 0.000 | 0.000 | 0.000 |
| hishave/artcncl | 00:00:00.000 | 0.0% | 147 | 0.000 | 0.000 | 0.000 |
| history grep | 00:00:00.000 | 0.0% | 0 | 0.000 | 0.000 | 0.000 |
| history lookup | 00:00:00.071 | 0.0% | 17884 | 0.000 | 0.004 | 0.027 |
| history sync | 00:00:00.016 | 0.0% | 413 | 0.000 | 0.039 | 1.000 |
| history write | 00:00:00.765 | 0.0% | 17386 | 0.000 | 0.044 | 0.127 |
| hiswrite/artcncl | 00:00:00.000 | 0.0% | 21 | 0.000 | 0.000 | 0.000 |
| idle | 24:00:41.134 | 100.0% | 20631 | 1649.701 | 4189.866 | 10912.818 |
| nntp read | 00:00:00.469 | 0.0% | 20290 | 0.000 | 0.023 | 0.062 |
| overview write | 00:00:02.817 | 0.0% | 17214 | 0.016 | 0.164 | 2.604 |
| perl filter | 00:00:10.021 | 0.0% | 17386 | 0.459 | 0.576 | 0.962 |
| python filter | 00:00:00.000 | 0.0% | 0 | 0.000 | 0.000 | 0.000 |
| site send | 00:00:00.742 | 0.0% | 17282 | 0.000 | 0.043 | 0.126 |
| TOTAL: 24:01:03.529 | 24:01:00.975 | 100.0% | - | - | - | - |
INNfeed timer:
| Code region | Time | Pct | Invoked | Min(ms) | Avg(ms) | Max(ms) |
|---|---|---|---|---|---|---|
| article new | 00:00:00.029 | 0.0% | 17211 | 0.000 | 0.002 | 0.022 |
| article prepare | 00:00:00.008 | 0.0% | 137628 | 0.000 | 0.000 | 0.002 |
| article read | 00:00:00.533 | 0.0% | 17209 | 0.000 | 0.031 | 0.415 |
| backlog stats | 00:00:00.023 | 0.0% | 79728 | 0.000 | 0.000 | 0.003 |
| callbacks | 00:00:00.000 | 0.0% | 0 | 0.000 | 0.000 | 0.000 |
| data read | 00:00:00.263 | 0.0% | 54953 | 0.000 | 0.005 | 0.021 |
| data write | 00:00:00.650 | 0.0% | 37764 | 0.000 | 0.017 | 0.045 |
| idle | 23:58:27.160 | 100.0% | 79728 | 550.949 | 1082.520 | 2928.234 |
| status file | 00:00:00.124 | 0.0% | 212 | 0.000 | 0.585 | 12.750 |
| TOTAL: 23:58:29.684 | 23:58:28.790 | 100.0% | - | - | - | - |
nnrpd timer:
| Code region | Time | Pct | Invoked | Min(ms) | Avg(ms) | Max(ms) |
|---|---|---|---|---|---|---|
| idle | 00:00:00.164 | 23.8% | 2 | 82.000 | 82.000 | 82.000 |
| newnews | 00:00:00.000 | 0.0% | 0 | 0.000 | 0.000 | 0.000 |
| nntpwrite | 00:00:00.000 | 0.0% | 11 | 0.000 | 0.000 | 0.000 |
| TOTAL: 00:00:00.689 | 00:00:00.164 | 23.8% | - | - | - | - |
Control commands to INND:
| Command | Number |
|---|---|
| L | 1 |
| flush | 3 |
| flushlogs | 2 |
| go | 2 |
| logmode | 2 |
| mode | 148 |
| name | 2 |
| pause | 2 |
| paused | 2 |
| reload | 2 |
| reserve | 2 |
| TOTAL: 11 | 168 |
Incoming Feeds (INN):
| Server | Connects | Offered | Taken | Refused | Reject | %Accpt | Elapsed | |
|---|---|---|---|---|---|---|---|---|
| 1 | i2pn | 6 | 17387 | 17211 | 3 | 173 | 98% | 24:31:53 |
| 2 | novabbs | 13 | 31 | 11 | 20 | 0 | 35% | 03:05:11 |
| 3 | localhost | 31 | 0 | 0 | 0 | 0 | 0% | 00:00:00 |
| TOTAL: 3 | 50 | 17418 | 17222 | 23 | 173 | 98% | 27:37:04 | |
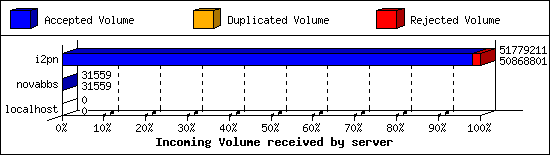
Incoming Volume (INN):
| Server | AcceptVol | DupVol | RejVol | TotalVol | %Acc | Vol/Art | |
|---|---|---|---|---|---|---|---|
| 1 | i2pn | 48.5 MB | 0.0 KB | 889.1 KB | 49.4 MB | 98% | 2.9 KB |
| 2 | novabbs | 30.8 KB | 0.0 KB | 0.0 KB | 30.8 KB | 100% | 2.8 KB |
| 3 | localhost | 0.0 KB | 0.0 KB | 0.0 KB | 0.0 KB | 0% | 0 |
| TOTAL: 3 | 48.5 MB | 0.0 KB | 889.1 KB | 49.4 MB | 98% | 2.9 KB | |
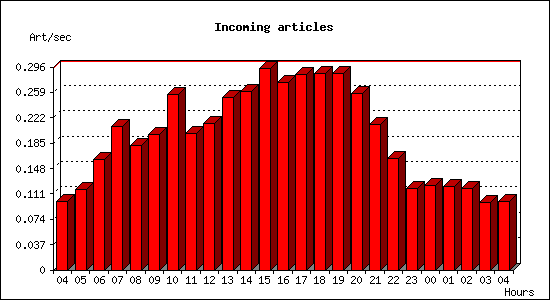
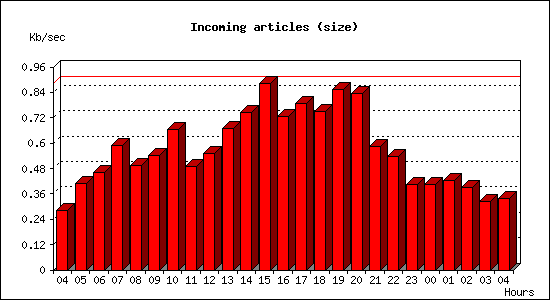
Incoming articles:
| Date | Articles | %Arts | Art/sec | Size | %Size | KB/sec |
|---|---|---|---|---|---|---|
| Apr 24 04:15:01 - 04:59:59 | 271 | 1.6% | 0.10 | 764.9 KB | 1.5% | 0.28 |
| Apr 24 05:00:00 - 05:59:59 | 422 | 2.5% | 0.12 | 1.4 MB | 3.0% | 0.41 |
| Apr 24 06:00:00 - 06:59:59 | 580 | 3.4% | 0.16 | 1.6 MB | 3.3% | 0.46 |
| Apr 24 07:00:00 - 07:59:59 | 752 | 4.4% | 0.21 | 2.1 MB | 4.3% | 0.59 |
| Apr 24 08:00:00 - 08:59:59 | 651 | 3.8% | 0.18 | 1.7 MB | 3.6% | 0.50 |
| Apr 24 09:00:00 - 09:59:59 | 709 | 4.1% | 0.20 | 1.9 MB | 3.9% | 0.54 |
| Apr 24 10:00:00 - 10:59:59 | 919 | 5.3% | 0.26 | 2.3 MB | 4.8% | 0.66 |
| Apr 24 11:00:00 - 11:59:59 | 716 | 4.2% | 0.20 | 1.7 MB | 3.6% | 0.49 |
| Apr 24 12:00:00 - 12:59:59 | 770 | 4.5% | 0.21 | 1.9 MB | 4.0% | 0.55 |
| Apr 24 13:00:00 - 13:59:59 | 905 | 5.3% | 0.25 | 2.4 MB | 4.8% | 0.67 |
| Apr 24 14:00:00 - 14:59:59 | 938 | 5.4% | 0.26 | 2.6 MB | 5.4% | 0.75 |
| Apr 24 15:00:00 - 15:59:59 | 1057 | 6.1% | 0.29 | 3.1 MB | 6.4% | 0.88 |
| Apr 24 16:00:00 - 16:59:59 | 986 | 5.7% | 0.27 | 2.6 MB | 5.3% | 0.73 |
| Apr 24 17:00:00 - 17:59:59 | 1026 | 6.0% | 0.28 | 2.8 MB | 5.7% | 0.79 |
| Apr 24 18:00:00 - 18:59:59 | 1033 | 6.0% | 0.29 | 2.6 MB | 5.4% | 0.75 |
| Apr 24 19:00:00 - 19:59:59 | 1031 | 6.0% | 0.29 | 3.0 MB | 6.2% | 0.86 |
| Apr 24 20:00:00 - 20:59:59 | 926 | 5.4% | 0.26 | 2.9 MB | 6.0% | 0.83 |
| Apr 24 21:00:00 - 21:59:59 | 763 | 4.4% | 0.21 | 2.1 MB | 4.2% | 0.59 |
| Apr 24 22:00:00 - 22:59:59 | 586 | 3.4% | 0.16 | 1.9 MB | 3.9% | 0.53 |
| Apr 24 23:00:00 - 23:59:59 | 429 | 2.5% | 0.12 | 1.4 MB | 2.9% | 0.40 |
| Apr 25 00:00:00 - 00:59:59 | 442 | 2.6% | 0.12 | 1.4 MB | 2.9% | 0.40 |
| Apr 25 01:00:00 - 01:59:59 | 437 | 2.5% | 0.12 | 1.5 MB | 3.1% | 0.42 |
| Apr 25 02:00:00 - 02:59:59 | 430 | 2.5% | 0.12 | 1.4 MB | 2.8% | 0.39 |
| Apr 25 03:00:00 - 03:59:59 | 353 | 2.0% | 0.10 | 1.1 MB | 2.3% | 0.32 |
| Apr 25 04:00:00 - 04:15:01 | 90 | 0.5% | 0.10 | 304.3 KB | 0.6% | 0.34 |
| TOTAL: 24:00:00 | 17222 | 100.0% | 0.20 | 48.5 MB | 100.0% | 0.58 |
Sites sending bad articles:
| Server | Total | Group | Dist | Duplic | Unapp | TooOld | Site | Line | Other | |
|---|---|---|---|---|---|---|---|---|---|---|
| 1 | i2pn | 550 | 3 | 0 | 0 | 0 | 0 | 0 | 0 | 547 |
| TOTAL: 1 | 550 | 3 | 0 | 0 | 0 | 0 | 0 | 0 | 547 | |
Unwanted newsgroups [Top 20]:
| Newsgroup | Count |
|---|---|
| alt.2600 | 1 |
| hk.politics | 1 |
| alt.sex.girl | 1 |
| TOTAL: 3 | 3 |
INND Perl filter [Top 20]:
| Reason | Count |
|---|---|
| Scoring filter (s5) | 119 |
| Scoring filter (s6) | 22 |
| Scoring filter (n6) | 13 |
| Scoring filter (s7) | 8 |
| Scoring filter (n4) | 6 |
| EMP (phl) | 2 |
| TOTAL: 6 | 170 |
NoCeM on Spool:
| Id | Good | Bad | Unique | Total |
|---|---|---|---|---|
| bleachbot@httrack.com | 60 | 0 | 64 | 64 |
| TOTAL: 1 | 60 | 8 | 64 | 64 |
Miscellaneous innd statistics [Top 10]:
| Event | Server | Number |
|---|---|---|
| Including strange strings | ||
| i2pn | 377 | |
| TOTAL: 1 | 377 | |
| TOTAL: 1 | 377 | |
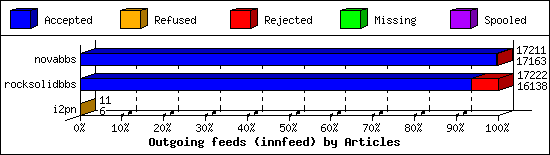
Outgoing Feeds (innfeed) by Articles:
| Server | Offered | Taken | Refused | Reject | Miss | Spool | %Took | Elapsed | |
|---|---|---|---|---|---|---|---|---|---|
| 1 | novabbs | 17214 | 17163 | 1 | 47 | 0 | 0 | 99% | 23:59:52 |
| 2 | rocksolidbbs | 17239 | 16138 | 9 | 1075 | 0 | 0 | 93% | 23:59:44 |
| 3 | i2pn | 12 | 6 | 5 | 0 | 0 | 0 | 50% | 01:32:53 |
| TOTAL: 3 | 34465 | 33307 | 15 | 1122 | 0 | 0 | 96% | 49:32:29 | |
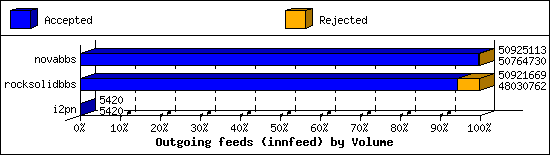
Outgoing Feeds (innfeed) by Volume:
| Server | AcceptVol | RejectVol | TotalVol | Volume/sec | Vol/Art | Elapsed | |
|---|---|---|---|---|---|---|---|
| 1 | novabbs | 48.4 MB | 156.6 KB | 48.6 MB | 0.6 KB/s | 2.9 KB | 23:59:52 |
| 2 | rocksolidbbs | 45.8 MB | 2.8 MB | 48.6 MB | 0.6 KB/s | 2.9 KB | 23:59:44 |
| 3 | i2pn | 5.3 KB | 0.0 KB | 5.3 KB | 0.0 KB/s | 0.9 KB | 01:32:53 |
| TOTAL: 3 | 94.2 MB | 2.9 MB | 97.1 MB | 0.6 KB/s | 2.9 KB | 49:32:29 | |
NNRP readership statistics:
| System | Conn | Arts | Size | Groups | Post | Rej | Elapsed | |
|---|---|---|---|---|---|---|---|---|
| 1 | scan-141.security.ipip.net | 1 | 0 | 0.0 KB | 0 | 0 | 0 | 00:00:00 |
| TOTAL: 1 | 1 | 0 | 0.0 KB | 0 | 0 | 0 | 00:00:00 | |
NNRP readership statistics (by domain):
| System | Conn | Arts | Size | Groups | Post | Rej | Elapsed | |
|---|---|---|---|---|---|---|---|---|
| 1 | *.security.ipip.net | 1 | 0 | 0.0 KB | 0 | 0 | 0 | 00:00:00 |
| TOTAL: 1 | 1 | 0 | 0.0 KB | 0 | 0 | 0 | 00:00:00 | |
NNRP total resource statistics [Top 20]:
| System | User(ms) | System(ms) | Idle(ms) | Elapsed |
|---|---|---|---|---|
| scan-141.security.ipip.net | 0.044 | 0.000 | 0.000 | 00:00:00 |
| TOTAL: 1 | 0.044 | 0.000 | 0.000 | 00:00:00 |
NNRP unrecognized commands (by host):
| System | Conn |
|---|---|
| scan-141.security.ipip.net | 4 |
| TOTAL: 1 | 4 |
NNRP unrecognized commands (by command):
| Command | Count |
|---|---|
| User-Agent: HTTP Banner Detection (https... | 1 |
| GET / HTTP/1.1 | 1 |
| Host: 157.230.63.40:119 | 1 |
| Connection: close | 1 |
| TOTAL: 4 | 4 |
