Log entries by program:
| Program name | Lines | %Lines | Size | %Size |
|---|---|---|---|---|
| inn | 16584 | 87.7% | 1.6 MB | 83.2% |
| innd | 1357 | 7.2% | 208.9 KB | 10.8% |
| innfeed | 873 | 4.6% | 103.7 KB | 5.4% |
| nocem | 88 | 0.5% | 10.3 KB | 0.5% |
| nnrpd | 5 | 0.0% | 0.4 KB | 0.0% |
| controlchan | 1 | 0.0% | 0.1 KB | 0.0% |
| TOTAL: 6 | 18908 | 100.0% | 1.9 MB | 100.0% |
History cache:
| Reason | Count | %Count |
|---|---|---|
| Do not exist | 16026 | 97.2% |
| Negative hits | 322 | 2.0% |
| Positive hits | 119 | 0.7% |
| Cache misses | 13 | 0.1% |
| TOTAL: 4 | 16480 | 100.0% |
INND timer:
| Code region | Time | Pct | Invoked | Min(ms) | Avg(ms) | Max(ms) |
|---|---|---|---|---|---|---|
| article cancel | 00:00:00.044 | 0.0% | 163 | 0.000 | 0.270 | 3.000 |
| article cleanup | 00:00:00.100 | 0.0% | 16036 | 0.000 | 0.006 | 0.033 |
| article logging | 00:00:00.414 | 0.0% | 16464 | 0.000 | 0.025 | 0.135 |
| article parse | 00:00:00.191 | 0.0% | 18364 | 0.000 | 0.010 | 0.051 |
| article write | 00:00:05.609 | 0.0% | 15796 | 0.100 | 0.355 | 5.089 |
| artlog/artcncl | 00:00:00.000 | 0.0% | 123 | 0.000 | 0.000 | 0.000 |
| artlog/artwrite | 00:00:00.000 | 0.0% | 0 | 0.000 | 0.000 | 0.000 |
| data move | 00:00:00.005 | 0.0% | 20922 | 0.000 | 0.000 | 0.009 |
| hisgrep/artcncl | 00:00:00.009 | 0.0% | 135 | 0.000 | 0.067 | 1.000 |
| hishave/artcncl | 00:00:00.002 | 0.0% | 163 | 0.000 | 0.012 | 0.133 |
| history grep | 00:00:00.000 | 0.0% | 0 | 0.000 | 0.000 | 0.000 |
| history lookup | 00:00:01.079 | 0.0% | 16369 | 0.000 | 0.066 | 4.015 |
| history sync | 00:00:00.013 | 0.0% | 418 | 0.000 | 0.031 | 0.500 |
| history write | 00:00:02.624 | 0.0% | 16036 | 0.000 | 0.164 | 1.000 |
| hiswrite/artcncl | 00:00:00.006 | 0.0% | 28 | 0.000 | 0.214 | 1.000 |
| idle | 24:00:52.745 | 100.0% | 19184 | 1907.073 | 4506.503 | 12773.681 |
| nntp read | 00:00:00.448 | 0.0% | 18838 | 0.000 | 0.024 | 0.068 |
| overview write | 00:00:02.510 | 0.0% | 15796 | 0.023 | 0.159 | 2.161 |
| perl filter | 00:00:09.160 | 0.0% | 16036 | 0.429 | 0.571 | 0.754 |
| python filter | 00:00:00.000 | 0.0% | 0 | 0.000 | 0.000 | 0.000 |
| site send | 00:00:00.561 | 0.0% | 15878 | 0.000 | 0.035 | 0.091 |
| TOTAL: 24:01:17.770 | 24:01:15.520 | 100.0% | - | - | - | - |
INNfeed timer:
| Code region | Time | Pct | Invoked | Min(ms) | Avg(ms) | Max(ms) |
|---|---|---|---|---|---|---|
| article new | 00:00:00.026 | 0.0% | 15784 | 0.000 | 0.002 | 0.017 |
| article prepare | 00:00:00.005 | 0.0% | 126212 | 0.000 | 0.000 | 0.001 |
| article read | 00:00:00.507 | 0.0% | 15780 | 0.000 | 0.032 | 0.533 |
| backlog stats | 00:00:00.014 | 0.0% | 71596 | 0.000 | 0.000 | 0.006 |
| callbacks | 00:00:00.000 | 0.0% | 0 | 0.000 | 0.000 | 0.000 |
| data read | 00:00:00.279 | 0.0% | 49438 | 0.000 | 0.006 | 0.020 |
| data write | 00:00:00.549 | 0.0% | 33696 | 0.000 | 0.016 | 0.038 |
| idle | 23:59:52.664 | 100.0% | 71596 | 512.234 | 1206.669 | 3637.624 |
| status file | 00:00:00.064 | 0.0% | 212 | 0.000 | 0.302 | 1.000 |
| TOTAL: 23:59:54.924 | 23:59:54.108 | 100.0% | - | - | - | - |
nnrpd timer:
| Code region | Time | Pct | Invoked | Min(ms) | Avg(ms) | Max(ms) |
|---|---|---|---|---|---|---|
| idle | 00:00:00.021 | 10.2% | 2 | 10.500 | 10.500 | 10.500 |
| newnews | 00:00:00.000 | 0.0% | 0 | 0.000 | 0.000 | 0.000 |
| nntpwrite | 00:00:00.000 | 0.0% | 3 | 0.000 | 0.000 | 0.000 |
| TOTAL: 00:00:00.206 | 00:00:00.021 | 10.2% | - | - | - | - |
Control commands to INND:
| Command | Number |
|---|---|
| L | 1 |
| flush | 3 |
| flushlogs | 2 |
| go | 2 |
| logmode | 2 |
| mode | 148 |
| name | 2 |
| pause | 2 |
| paused | 2 |
| reload | 2 |
| reserve | 2 |
| TOTAL: 11 | 168 |
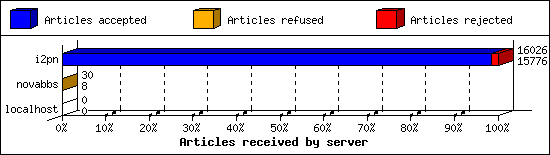
Incoming Feeds (INN):
| Server | Connects | Offered | Taken | Refused | Reject | %Accpt | Elapsed | |
|---|---|---|---|---|---|---|---|---|
| 1 | i2pn | 9 | 16026 | 15776 | 4 | 246 | 98% | 24:51:25 |
| 2 | novabbs | 11 | 30 | 8 | 22 | 0 | 26% | 02:37:45 |
| 3 | localhost | 30 | 0 | 0 | 0 | 0 | 0% | 00:00:00 |
| TOTAL: 3 | 50 | 16056 | 15784 | 26 | 246 | 98% | 27:29:10 | |
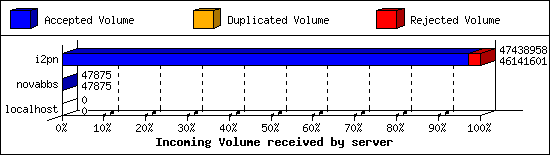
Incoming Volume (INN):
| Server | AcceptVol | DupVol | RejVol | TotalVol | %Acc | Vol/Art | |
|---|---|---|---|---|---|---|---|
| 1 | i2pn | 44.0 MB | 0.0 KB | 1.2 MB | 45.2 MB | 97% | 2.9 KB |
| 2 | novabbs | 46.8 KB | 0.0 KB | 0.0 KB | 46.8 KB | 100% | 5.8 KB |
| 3 | localhost | 0.0 KB | 0.0 KB | 0.0 KB | 0.0 KB | 0% | 0 |
| TOTAL: 3 | 44.0 MB | 0.0 KB | 1.2 MB | 45.3 MB | 97% | 2.9 KB | |
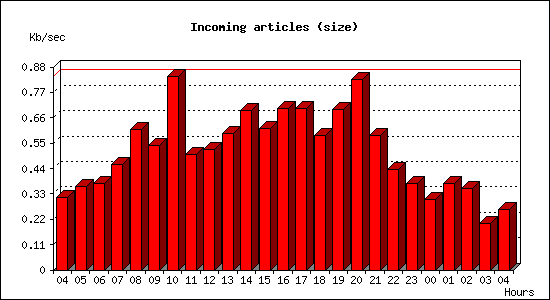
Incoming articles:
| Date | Articles | %Arts | Art/sec | Size | %Size | KB/sec |
|---|---|---|---|---|---|---|
| Apr 27 04:15:02 - 04:59:59 | 235 | 1.5% | 0.09 | 847.3 KB | 1.9% | 0.31 |
| Apr 27 05:00:00 - 05:59:59 | 429 | 2.7% | 0.12 | 1.3 MB | 2.9% | 0.36 |
| Apr 27 06:00:00 - 06:59:59 | 484 | 3.1% | 0.13 | 1.3 MB | 3.0% | 0.38 |
| Apr 27 07:00:00 - 07:59:59 | 638 | 4.0% | 0.18 | 1.6 MB | 3.6% | 0.46 |
| Apr 27 08:00:00 - 08:59:59 | 850 | 5.4% | 0.24 | 2.1 MB | 4.9% | 0.61 |
| Apr 27 09:00:00 - 09:59:59 | 729 | 4.6% | 0.20 | 1.9 MB | 4.3% | 0.54 |
| Apr 27 10:00:00 - 10:59:59 | 831 | 5.3% | 0.23 | 2.9 MB | 6.7% | 0.84 |
| Apr 27 11:00:00 - 11:59:59 | 739 | 4.7% | 0.21 | 1.8 MB | 4.0% | 0.50 |
| Apr 27 12:00:00 - 12:59:59 | 742 | 4.7% | 0.21 | 1.8 MB | 4.2% | 0.52 |
| Apr 27 13:00:00 - 13:59:59 | 808 | 5.1% | 0.22 | 2.1 MB | 4.7% | 0.59 |
| Apr 27 14:00:00 - 14:59:59 | 889 | 5.6% | 0.25 | 2.4 MB | 5.5% | 0.69 |
| Apr 27 15:00:00 - 15:59:59 | 768 | 4.9% | 0.21 | 2.2 MB | 4.9% | 0.61 |
| Apr 27 16:00:00 - 16:59:59 | 915 | 5.8% | 0.25 | 2.5 MB | 5.6% | 0.70 |
| Apr 27 17:00:00 - 17:59:59 | 919 | 5.8% | 0.26 | 2.5 MB | 5.6% | 0.70 |
| Apr 27 18:00:00 - 18:59:59 | 783 | 5.0% | 0.22 | 2.0 MB | 4.6% | 0.58 |
| Apr 27 19:00:00 - 19:59:59 | 807 | 5.1% | 0.22 | 2.4 MB | 5.6% | 0.70 |
| Apr 27 20:00:00 - 20:59:59 | 871 | 5.5% | 0.24 | 2.9 MB | 6.6% | 0.82 |
| Apr 27 21:00:00 - 21:59:59 | 765 | 4.8% | 0.21 | 2.1 MB | 4.7% | 0.59 |
| Apr 27 22:00:00 - 22:59:59 | 565 | 3.6% | 0.16 | 1.5 MB | 3.5% | 0.44 |
| Apr 27 23:00:00 - 23:59:59 | 495 | 3.1% | 0.14 | 1.3 MB | 3.0% | 0.37 |
| Apr 28 00:00:00 - 00:59:59 | 357 | 2.3% | 0.10 | 1.1 MB | 2.4% | 0.30 |
| Apr 28 01:00:00 - 01:59:59 | 440 | 2.8% | 0.12 | 1.3 MB | 3.0% | 0.37 |
| Apr 28 02:00:00 - 02:59:59 | 397 | 2.5% | 0.11 | 1.2 MB | 2.8% | 0.35 |
| Apr 28 03:00:00 - 03:59:59 | 252 | 1.6% | 0.07 | 727.6 KB | 1.6% | 0.20 |
| Apr 28 04:00:00 - 04:15:02 | 76 | 0.5% | 0.08 | 235.8 KB | 0.5% | 0.26 |
| TOTAL: 24:00:00 | 15784 | 100.0% | 0.18 | 44.0 MB | 100.0% | 0.52 |

Sites sending bad articles:
| Server | Total | Group | Dist | Duplic | Unapp | TooOld | Site | Line | Other | |
|---|---|---|---|---|---|---|---|---|---|---|
| 1 | i2pn | 675 | 10 | 0 | 0 | 0 | 0 | 0 | 0 | 665 |
| TOTAL: 1 | 675 | 10 | 0 | 0 | 0 | 0 | 0 | 0 | 665 | |
Unwanted newsgroups [Top 20]:
| Newsgroup | Count |
|---|---|
| hk.politics | 6 |
| alt.sex.girl | 1 |
| lada.music | 1 |
| 24hoursupport.helpdesk | 1 |
| alt.social-security-disability | 1 |
| TOTAL: 5 | 10 |
INND Perl filter [Top 20]:
| Reason | Count |
|---|---|
| Scoring filter (s5) | 112 |
| Scoring filter (s1) | 70 |
| Scoring filter (s6) | 27 |
| Scoring filter (n4) | 14 |
| Scoring filter (n6) | 13 |
| TOTAL: 5 | 236 |
NoCeM on Spool:
| Id | Good | Bad | Unique | Total |
|---|---|---|---|---|
| bleachbot@httrack.com | 74 | 0 | 74 | 74 |
| TOTAL: 1 | 74 | 9 | 74 | 74 |
Miscellaneous innd statistics [Top 10]:
| Event | Server | Number |
|---|---|---|
| Including strange strings | ||
| i2pn | 429 | |
| TOTAL: 1 | 429 | |
| TOTAL: 1 | 429 | |
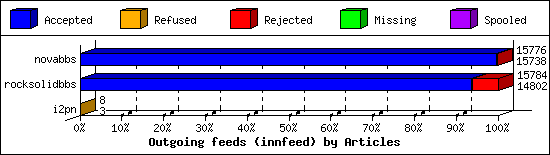
Outgoing Feeds (innfeed) by Articles:
| Server | Offered | Taken | Refused | Reject | Miss | Spool | %Took | Elapsed | |
|---|---|---|---|---|---|---|---|---|---|
| 1 | novabbs | 15777 | 15738 | 0 | 38 | 0 | 0 | 99% | 23:59:58 |
| 2 | rocksolidbbs | 15798 | 14802 | 10 | 972 | 0 | 0 | 93% | 23:59:58 |
| 3 | i2pn | 8 | 3 | 5 | 0 | 0 | 0 | 37% | 00:50:00 |
| TOTAL: 3 | 31583 | 30543 | 15 | 1010 | 0 | 0 | 96% | 48:49:56 | |
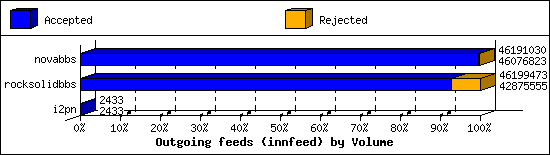
Outgoing Feeds (innfeed) by Volume:
| Server | AcceptVol | RejectVol | TotalVol | Volume/sec | Vol/Art | Elapsed | |
|---|---|---|---|---|---|---|---|
| 1 | novabbs | 43.9 MB | 111.5 KB | 44.1 MB | 0.5 KB/s | 2.9 KB | 23:59:58 |
| 2 | rocksolidbbs | 40.9 MB | 3.2 MB | 44.1 MB | 0.5 KB/s | 2.9 KB | 23:59:58 |
| 3 | i2pn | 2.4 KB | 0.0 KB | 2.4 KB | 0.0 KB/s | 0.8 KB | 00:50:00 |
| TOTAL: 3 | 84.8 MB | 3.3 MB | 88.1 MB | 0.5 KB/s | 2.9 KB | 48:49:56 | |
NNRP readership statistics:
| System | Conn | Arts | Size | Groups | Post | Rej | Elapsed | |
|---|---|---|---|---|---|---|---|---|
| 1 | worker-18.sfj.corp.censys.io | 1 | 0 | 0.0 KB | 0 | 0 | 0 | 00:00:00 |
| TOTAL: 1 | 1 | 0 | 0.0 KB | 0 | 0 | 0 | 00:00:00 | |
NNRP readership statistics (by domain):
| System | Conn | Arts | Size | Groups | Post | Rej | Elapsed | |
|---|---|---|---|---|---|---|---|---|
| 1 | *.sfj.corp.censys.io | 1 | 0 | 0.0 KB | 0 | 0 | 0 | 00:00:00 |
| TOTAL: 1 | 1 | 0 | 0.0 KB | 0 | 0 | 0 | 00:00:00 | |
NNRP total resource statistics [Top 20]:
| System | User(ms) | System(ms) | Idle(ms) | Elapsed |
|---|---|---|---|---|
| worker-18.sfj.corp.censys.io | 0.044 | 0.004 | 0.000 | 00:00:00 |
| TOTAL: 1 | 0.044 | 0.004 | 0.000 | 00:00:00 |
NNRP client timeouts [Top 20]:
| System | Conn | Peer |
|---|---|---|
| worker-18.sfj.corp.censys.io | 1 | 1 |
| TOTAL: 1 | 1 | 1 |
