Log entries by program:
| Program name | Lines | %Lines | Size | %Size |
|---|---|---|---|---|
| inn | 17461 | 88.2% | 1.6 MB | 83.8% |
| innd | 1365 | 6.9% | 210.2 KB | 10.5% |
| innfeed | 876 | 4.4% | 102.1 KB | 5.1% |
| nocem | 93 | 0.5% | 11.3 KB | 0.6% |
| nnrpd | 4 | 0.0% | 0.5 KB | 0.0% |
| controlchan | 1 | 0.0% | 0.1 KB | 0.0% |
| TOTAL: 6 | 19800 | 100.0% | 2.0 MB | 100.0% |
History cache:
| Reason | Count | %Count |
|---|---|---|
| Do not exist | 16771 | 98.0% |
| Negative hits | 167 | 1.0% |
| Positive hits | 151 | 0.9% |
| Cache misses | 26 | 0.2% |
| TOTAL: 4 | 17115 | 100.0% |
INND timer:
| Code region | Time | Pct | Invoked | Min(ms) | Avg(ms) | Max(ms) |
|---|---|---|---|---|---|---|
| article cancel | 00:00:00.040 | 0.0% | 186 | 0.000 | 0.215 | 2.000 |
| article cleanup | 00:00:00.084 | 0.0% | 16772 | 0.000 | 0.005 | 0.046 |
| article logging | 00:00:00.399 | 0.0% | 17226 | 0.000 | 0.023 | 0.096 |
| article parse | 00:00:00.227 | 0.0% | 18720 | 0.000 | 0.012 | 0.062 |
| article write | 00:00:02.930 | 0.0% | 16579 | 0.086 | 0.177 | 0.614 |
| artlog/artcncl | 00:00:00.001 | 0.0% | 142 | 0.000 | 0.007 | 0.077 |
| artlog/artwrite | 00:00:00.000 | 0.0% | 0 | 0.000 | 0.000 | 0.000 |
| data move | 00:00:00.007 | 0.0% | 20611 | 0.000 | 0.000 | 0.011 |
| hisgrep/artcncl | 00:00:00.006 | 0.0% | 177 | 0.000 | 0.034 | 1.000 |
| hishave/artcncl | 00:00:00.000 | 0.0% | 186 | 0.000 | 0.000 | 0.000 |
| history grep | 00:00:00.000 | 0.0% | 0 | 0.000 | 0.000 | 0.000 |
| history lookup | 00:00:00.073 | 0.0% | 16950 | 0.000 | 0.004 | 0.023 |
| history sync | 00:00:00.019 | 0.0% | 419 | 0.000 | 0.045 | 0.500 |
| history write | 00:00:00.734 | 0.0% | 16771 | 0.000 | 0.044 | 0.437 |
| hiswrite/artcncl | 00:00:00.000 | 0.0% | 9 | 0.000 | 0.000 | 0.000 |
| idle | 23:50:49.217 | 100.0% | 19416 | 2564.573 | 4421.571 | 11549.481 |
| nntp read | 00:00:00.446 | 0.0% | 19063 | 0.000 | 0.023 | 0.074 |
| overview write | 00:00:03.002 | 0.0% | 16579 | 0.031 | 0.181 | 9.682 |
| perl filter | 00:00:09.454 | 0.0% | 16771 | 0.419 | 0.564 | 0.911 |
| python filter | 00:00:00.000 | 0.0% | 0 | 0.000 | 0.000 | 0.000 |
| site send | 00:00:00.236 | 0.0% | 16663 | 0.000 | 0.014 | 0.055 |
| TOTAL: 23:51:09.268 | 23:51:06.875 | 100.0% | - | - | - | - |
INNfeed timer:
| Code region | Time | Pct | Invoked | Min(ms) | Avg(ms) | Max(ms) |
|---|---|---|---|---|---|---|
| article new | 00:00:00.021 | 0.0% | 16621 | 0.000 | 0.001 | 0.018 |
| article prepare | 00:00:00.014 | 0.0% | 132908 | 0.000 | 0.000 | 0.003 |
| article read | 00:00:00.571 | 0.0% | 16618 | 0.000 | 0.034 | 0.533 |
| backlog stats | 00:00:00.019 | 0.0% | 74417 | 0.000 | 0.000 | 0.004 |
| callbacks | 00:00:00.000 | 0.0% | 0 | 0.000 | 0.000 | 0.000 |
| data read | 00:00:00.254 | 0.0% | 51702 | 0.000 | 0.005 | 0.026 |
| data write | 00:00:00.562 | 0.0% | 35102 | 0.000 | 0.016 | 0.051 |
| idle | 23:57:40.962 | 100.0% | 74417 | 625.682 | 1159.157 | 3179.471 |
| status file | 00:00:00.077 | 0.0% | 205 | 0.000 | 0.376 | 27.000 |
| TOTAL: 23:57:43.331 | 23:57:42.480 | 100.0% | - | - | - | - |
nnrpd timer:
| Code region | Time | Pct | Invoked | Min(ms) | Avg(ms) | Max(ms) |
|---|---|---|---|---|---|---|
| idle | 00:00:00.267 | 33.1% | 1 | 267.000 | 267.000 | 267.000 |
| newnews | 00:00:00.000 | 0.0% | 0 | 0.000 | 0.000 | 0.000 |
| nntpwrite | 00:00:00.000 | 0.0% | 2 | 0.000 | 0.000 | 0.000 |
| TOTAL: 00:00:00.807 | 00:00:00.267 | 33.1% | - | - | - | - |
Control commands to INND:
| Command | Number |
|---|---|
| L | 1 |
| flush | 3 |
| flushlogs | 2 |
| go | 2 |
| logmode | 2 |
| mode | 149 |
| name | 2 |
| pause | 2 |
| paused | 2 |
| reload | 2 |
| reserve | 2 |
| TOTAL: 11 | 169 |
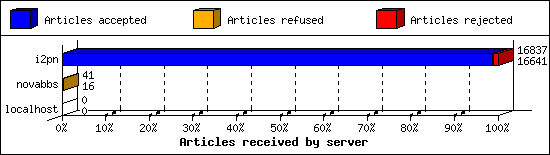
Incoming Feeds (INN):
| Server | Connects | Offered | Taken | Refused | Reject | %Accpt | Elapsed | |
|---|---|---|---|---|---|---|---|---|
| 1 | i2pn | 6 | 16837 | 16641 | 3 | 193 | 98% | 24:39:19 |
| 2 | novabbs | 16 | 41 | 16 | 25 | 0 | 39% | 03:29:04 |
| 3 | localhost | 34 | 0 | 0 | 0 | 0 | 0% | 00:00:00 |
| TOTAL: 3 | 56 | 16878 | 16657 | 28 | 193 | 98% | 28:08:23 | |
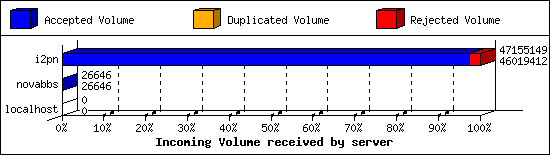
Incoming Volume (INN):
| Server | AcceptVol | DupVol | RejVol | TotalVol | %Acc | Vol/Art | |
|---|---|---|---|---|---|---|---|
| 1 | i2pn | 43.9 MB | 2.5 KB | 1.1 MB | 45.0 MB | 97% | 2.7 KB |
| 2 | novabbs | 26.0 KB | 0.0 KB | 0.0 KB | 26.0 KB | 100% | 1.6 KB |
| 3 | localhost | 0.0 KB | 0.0 KB | 0.0 KB | 0.0 KB | 0% | 0 |
| TOTAL: 3 | 43.9 MB | 2.5 KB | 1.1 MB | 45.0 MB | 97% | 2.7 KB | |
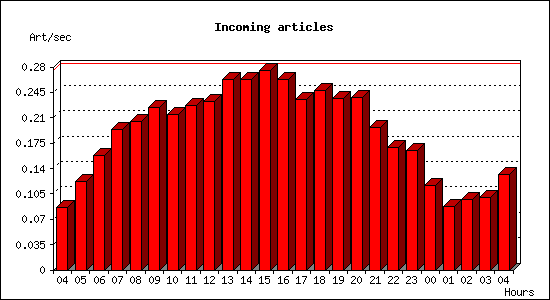
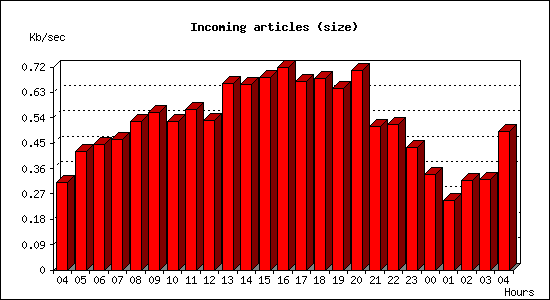
Incoming articles:
| Date | Articles | %Arts | Art/sec | Size | %Size | KB/sec |
|---|---|---|---|---|---|---|
| May 2 04:15:01 - 04:59:59 | 232 | 1.4% | 0.09 | 839.9 KB | 1.9% | 0.31 |
| May 2 05:00:00 - 05:59:59 | 438 | 2.6% | 0.12 | 1.5 MB | 3.4% | 0.42 |
| May 2 06:00:00 - 06:59:59 | 567 | 3.4% | 0.16 | 1.6 MB | 3.6% | 0.44 |
| May 2 07:00:00 - 07:59:59 | 696 | 4.2% | 0.19 | 1.6 MB | 3.7% | 0.46 |
| May 2 08:00:00 - 08:59:59 | 739 | 4.4% | 0.21 | 1.8 MB | 4.2% | 0.52 |
| May 2 09:00:00 - 09:59:59 | 808 | 4.8% | 0.22 | 2.0 MB | 4.5% | 0.56 |
| May 2 10:00:00 - 10:59:59 | 771 | 4.6% | 0.21 | 1.8 MB | 4.2% | 0.53 |
| May 2 11:00:00 - 11:59:59 | 818 | 4.9% | 0.23 | 2.0 MB | 4.6% | 0.57 |
| May 2 12:00:00 - 12:59:59 | 839 | 5.0% | 0.23 | 1.9 MB | 4.2% | 0.53 |
| May 2 13:00:00 - 13:59:59 | 948 | 5.7% | 0.26 | 2.3 MB | 5.3% | 0.66 |
| May 2 14:00:00 - 14:59:59 | 946 | 5.7% | 0.26 | 2.3 MB | 5.3% | 0.66 |
| May 2 15:00:00 - 15:59:59 | 990 | 5.9% | 0.28 | 2.4 MB | 5.5% | 0.68 |
| May 2 16:00:00 - 16:59:59 | 947 | 5.7% | 0.26 | 2.5 MB | 5.7% | 0.72 |
| May 2 17:00:00 - 17:59:59 | 849 | 5.1% | 0.24 | 2.4 MB | 5.4% | 0.67 |
| May 2 18:00:00 - 18:59:59 | 892 | 5.4% | 0.25 | 2.4 MB | 5.4% | 0.68 |
| May 2 19:00:00 - 19:59:59 | 853 | 5.1% | 0.24 | 2.3 MB | 5.1% | 0.64 |
| May 2 20:00:00 - 20:59:59 | 855 | 5.1% | 0.24 | 2.5 MB | 5.7% | 0.71 |
| May 2 21:00:00 - 21:59:59 | 707 | 4.2% | 0.20 | 1.8 MB | 4.1% | 0.51 |
| May 2 22:00:00 - 22:59:59 | 610 | 3.7% | 0.17 | 1.8 MB | 4.1% | 0.52 |
| May 2 23:00:00 - 23:59:59 | 594 | 3.6% | 0.17 | 1.5 MB | 3.5% | 0.43 |
| May 3 00:00:00 - 00:59:59 | 420 | 2.5% | 0.12 | 1.2 MB | 2.7% | 0.34 |
| May 3 01:00:00 - 01:59:59 | 314 | 1.9% | 0.09 | 892.5 KB | 2.0% | 0.25 |
| May 3 02:00:00 - 02:59:59 | 350 | 2.1% | 0.10 | 1.1 MB | 2.5% | 0.32 |
| May 3 03:00:00 - 03:59:59 | 360 | 2.2% | 0.10 | 1.1 MB | 2.6% | 0.32 |
| May 3 04:00:00 - 04:15:01 | 119 | 0.7% | 0.13 | 442.5 KB | 1.0% | 0.49 |
| TOTAL: 24:00:00 | 16662 | 100.0% | 0.19 | 43.9 MB | 100.0% | 0.52 |
Sites sending bad articles:
| Server | Total | Group | Dist | Duplic | Unapp | TooOld | Site | Line | Other | |
|---|---|---|---|---|---|---|---|---|---|---|
| 1 | i2pn | 649 | 5 | 0 | 1 | 0 | 0 | 0 | 0 | 643 |
| TOTAL: 1 | 649 | 5 | 0 | 1 | 0 | 0 | 0 | 0 | 643 | |
Unwanted newsgroups [Top 20]:
| Newsgroup | Count |
|---|---|
| hk.politics | 4 |
| alt.sex.girl | 1 |
| TOTAL: 2 | 5 |
INND Perl filter [Top 20]:
| Reason | Count |
|---|---|
| Scoring filter (s5) | 126 |
| Scoring filter (s6) | 37 |
| Scoring filter (n6) | 19 |
| Scoring filter (s1) | 5 |
| TOTAL: 4 | 187 |
NoCeM on Spool:
| Id | Good | Bad | Unique | Total |
|---|---|---|---|---|
| bleachbot@httrack.com | 68 | 0 | 71 | 71 |
| TOTAL: 1 | 68 | 16 | 71 | 71 |
Miscellaneous innd statistics [Top 10]:
| Event | Server | Number |
|---|---|---|
| Including strange strings | ||
| i2pn | 456 | |
| TOTAL: 1 | 456 | |
| TOTAL: 1 | 456 | |
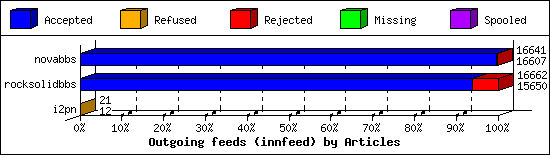
Outgoing Feeds (innfeed) by Articles:
| Server | Offered | Taken | Refused | Reject | Miss | Spool | %Took | Elapsed | |
|---|---|---|---|---|---|---|---|---|---|
| 1 | novabbs | 16642 | 16607 | 0 | 34 | 0 | 0 | 99% | 23:59:57 |
| 2 | rocksolidbbs | 16673 | 15650 | 8 | 1004 | 0 | 0 | 93% | 23:59:57 |
| 3 | i2pn | 22 | 12 | 9 | 0 | 0 | 0 | 54% | 01:33:12 |
| TOTAL: 3 | 33337 | 32269 | 17 | 1038 | 0 | 0 | 96% | 49:33:06 | |
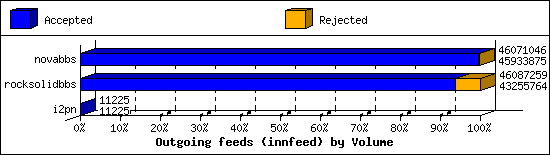
Outgoing Feeds (innfeed) by Volume:
| Server | AcceptVol | RejectVol | TotalVol | Volume/sec | Vol/Art | Elapsed | |
|---|---|---|---|---|---|---|---|
| 1 | novabbs | 43.8 MB | 134.0 KB | 43.9 MB | 0.5 KB/s | 2.7 KB | 23:59:57 |
| 2 | rocksolidbbs | 41.3 MB | 2.7 MB | 44.0 MB | 0.5 KB/s | 2.7 KB | 23:59:57 |
| 3 | i2pn | 11.0 KB | 0.0 KB | 11.0 KB | 0.0 KB/s | 0.9 KB | 01:33:12 |
| TOTAL: 3 | 85.1 MB | 2.8 MB | 87.9 MB | 0.5 KB/s | 2.7 KB | 49:33:06 | |
NNRP readership statistics:
| System | Conn | Arts | Size | Groups | Post | Rej | Elapsed | |
|---|---|---|---|---|---|---|---|---|
| 1 | 106.75.3.52 | 1 | 0 | 0.0 KB | 0 | 0 | 0 | 00:00:00 |
| TOTAL: 1 | 1 | 0 | 0.0 KB | 0 | 0 | 0 | 00:00:00 | |
NNRP readership statistics (by domain):
| System | Conn | Arts | Size | Groups | Post | Rej | Elapsed | |
|---|---|---|---|---|---|---|---|---|
| 1 | unresolved | 1 | 0 | 0.0 KB | 0 | 0 | 0 | 00:00:00 |
| TOTAL: 1 | 1 | 0 | 0.0 KB | 0 | 0 | 0 | 00:00:00 | |
NNRP total resource statistics [Top 20]:
| System | User(ms) | System(ms) | Idle(ms) | Elapsed |
|---|---|---|---|---|
| 106.75.3.52 | 0.048 | 0.004 | 0.000 | 00:00:00 |
| TOTAL: 1 | 0.048 | 0.004 | 0.000 | 00:00:00 |
