Log entries by program:
| Program name | Lines | %Lines | Size | %Size |
|---|---|---|---|---|
| inn | 16197 | 87.7% | 1.5 MB | 83.1% |
| innd | 1309 | 7.1% | 204.4 KB | 10.9% |
| innfeed | 845 | 4.6% | 99.1 KB | 5.3% |
| nocem | 91 | 0.5% | 10.2 KB | 0.5% |
| nnrpd | 12 | 0.1% | 1.3 KB | 0.1% |
| controlchan | 12 | 0.1% | 2.3 KB | 0.1% |
| pgpverify | 1 | 0.0% | 0.0 KB | 0.0% |
| TOTAL: 7 | 18467 | 100.0% | 1.8 MB | 100.0% |
History cache:
| Reason | Count | %Count |
|---|---|---|
| Do not exist | 15617 | 97.3% |
| Negative hits | 281 | 1.8% |
| Positive hits | 134 | 0.8% |
| Cache misses | 15 | 0.1% |
| TOTAL: 4 | 16047 | 100.0% |
INND timer:
| Code region | Time | Pct | Invoked | Min(ms) | Avg(ms) | Max(ms) |
|---|---|---|---|---|---|---|
| article cancel | 00:00:00.065 | 0.0% | 162 | 0.000 | 0.401 | 32.000 |
| article cleanup | 00:00:00.087 | 0.0% | 15696 | 0.000 | 0.006 | 0.075 |
| article logging | 00:00:00.383 | 0.0% | 16110 | 0.000 | 0.024 | 0.073 |
| article parse | 00:00:00.218 | 0.0% | 17663 | 0.000 | 0.012 | 0.047 |
| article write | 00:00:03.021 | 0.0% | 15555 | 0.060 | 0.194 | 1.827 |
| artlog/artcncl | 00:00:00.001 | 0.0% | 131 | 0.000 | 0.008 | 1.000 |
| artlog/artwrite | 00:00:00.000 | 0.0% | 0 | 0.000 | 0.000 | 0.000 |
| data move | 00:00:00.011 | 0.0% | 19670 | 0.000 | 0.001 | 0.009 |
| hisgrep/artcncl | 00:00:00.010 | 0.0% | 154 | 0.000 | 0.065 | 7.000 |
| hishave/artcncl | 00:00:00.000 | 0.0% | 162 | 0.000 | 0.000 | 0.000 |
| history grep | 00:00:00.000 | 0.0% | 0 | 0.000 | 0.000 | 0.000 |
| history lookup | 00:00:00.063 | 0.0% | 15989 | 0.000 | 0.004 | 0.027 |
| history sync | 00:00:00.017 | 0.0% | 420 | 0.000 | 0.040 | 0.500 |
| history write | 00:00:00.873 | 0.0% | 15696 | 0.000 | 0.056 | 0.500 |
| hiswrite/artcncl | 00:00:00.001 | 0.0% | 8 | 0.000 | 0.125 | 1.000 |
| idle | 24:00:51.679 | 100.0% | 18476 | 2755.780 | 4679.134 | 13343.933 |
| nntp read | 00:00:00.402 | 0.0% | 18118 | 0.000 | 0.022 | 0.067 |
| overview write | 00:00:02.173 | 0.0% | 15555 | 0.017 | 0.140 | 1.700 |
| perl filter | 00:00:08.991 | 0.0% | 15696 | 0.430 | 0.573 | 0.774 |
| python filter | 00:00:00.000 | 0.0% | 0 | 0.000 | 0.000 | 0.000 |
| site send | 00:00:00.173 | 0.0% | 15639 | 0.000 | 0.011 | 0.057 |
| TOTAL: 24:01:10.441 | 24:01:08.168 | 100.0% | - | - | - | - |
INNfeed timer:
| Code region | Time | Pct | Invoked | Min(ms) | Avg(ms) | Max(ms) |
|---|---|---|---|---|---|---|
| article new | 00:00:00.019 | 0.0% | 15511 | 0.000 | 0.001 | 0.012 |
| article prepare | 00:00:00.008 | 0.0% | 124044 | 0.000 | 0.000 | 0.003 |
| article read | 00:00:00.514 | 0.0% | 15508 | 0.000 | 0.033 | 0.436 |
| backlog stats | 00:00:00.019 | 0.0% | 69172 | 0.000 | 0.000 | 0.005 |
| callbacks | 00:00:00.000 | 0.0% | 0 | 0.000 | 0.000 | 0.000 |
| data read | 00:00:00.229 | 0.0% | 48056 | 0.000 | 0.005 | 0.022 |
| data write | 00:00:00.484 | 0.0% | 32560 | 0.000 | 0.015 | 0.060 |
| idle | 23:59:09.261 | 100.0% | 69172 | 644.229 | 1248.327 | 3764.881 |
| status file | 00:00:00.055 | 0.0% | 193 | 0.000 | 0.285 | 1.000 |
| TOTAL: 23:59:16.520 | 23:59:10.589 | 100.0% | - | - | - | - |
nnrpd timer:
| Code region | Time | Pct | Invoked | Min(ms) | Avg(ms) | Max(ms) |
|---|---|---|---|---|---|---|
| idle | 00:00:00.793 | 66.8% | 4 | 151.000 | 198.250 | 247.000 |
| newnews | 00:00:00.000 | 0.0% | 0 | 0.000 | 0.000 | 0.000 |
| nntpwrite | 00:00:00.000 | 0.0% | 6 | 0.000 | 0.000 | 0.000 |
| TOTAL: 00:00:01.187 | 00:00:00.793 | 66.8% | - | - | - | - |
Control commands to INND:
| Command | Number |
|---|---|
| L | 1 |
| flush | 3 |
| flushlogs | 2 |
| go | 2 |
| logmode | 2 |
| mode | 149 |
| name | 2 |
| pause | 2 |
| paused | 2 |
| reload | 2 |
| reserve | 2 |
| TOTAL: 11 | 169 |
Control Channel:
| Sender | newgroup | rmgroup | Other | Bad PGP | DoIt | OK |
|---|---|---|---|---|---|---|
| moderator@dana.de | 0 | 0 | 1 | 1 | 0 | 1 |
| TOTAL | 0 | 0 | 1 | 1 | 0 | 1 |
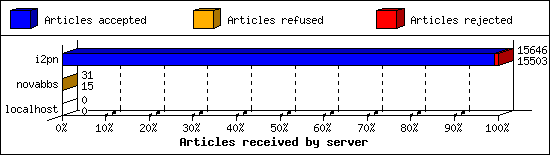
Incoming Feeds (INN):
| Server | Connects | Offered | Taken | Refused | Reject | %Accpt | Elapsed | |
|---|---|---|---|---|---|---|---|---|
| 1 | i2pn | 8 | 15646 | 15503 | 2 | 141 | 99% | 24:39:56 |
| 2 | novabbs | 13 | 31 | 15 | 16 | 0 | 48% | 02:43:01 |
| 3 | localhost | 33 | 0 | 0 | 0 | 0 | 0% | 00:00:00 |
| TOTAL: 3 | 54 | 15677 | 15518 | 18 | 141 | 98% | 27:22:57 | |
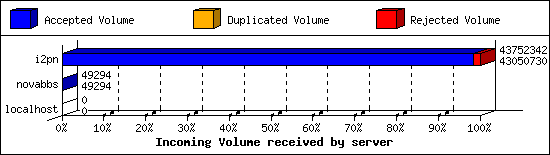
Incoming Volume (INN):
| Server | AcceptVol | DupVol | RejVol | TotalVol | %Acc | Vol/Art | |
|---|---|---|---|---|---|---|---|
| 1 | i2pn | 41.1 MB | 0.0 KB | 685.2 KB | 41.7 MB | 98% | 2.7 KB |
| 2 | novabbs | 48.1 KB | 0.0 KB | 0.0 KB | 48.1 KB | 100% | 3.2 KB |
| 3 | localhost | 0.0 KB | 0.0 KB | 0.0 KB | 0.0 KB | 0% | 0 |
| TOTAL: 3 | 41.1 MB | 0.0 KB | 685.2 KB | 41.8 MB | 98% | 2.7 KB | |
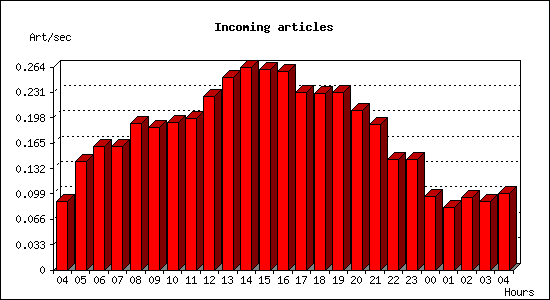
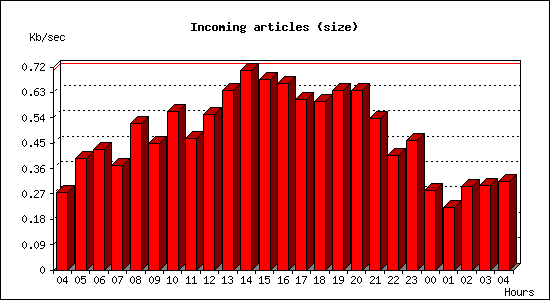
Incoming articles:
| Date | Articles | %Arts | Art/sec | Size | %Size | KB/sec |
|---|---|---|---|---|---|---|
| May 3 04:15:01 - 04:59:59 | 239 | 1.5% | 0.09 | 745.8 KB | 1.8% | 0.28 |
| May 3 05:00:00 - 05:59:59 | 508 | 3.3% | 0.14 | 1.4 MB | 3.4% | 0.40 |
| May 3 06:00:00 - 06:59:59 | 579 | 3.7% | 0.16 | 1.5 MB | 3.7% | 0.43 |
| May 3 07:00:00 - 07:59:59 | 576 | 3.7% | 0.16 | 1.3 MB | 3.2% | 0.37 |
| May 3 08:00:00 - 08:59:59 | 685 | 4.4% | 0.19 | 1.8 MB | 4.5% | 0.52 |
| May 3 09:00:00 - 09:59:59 | 669 | 4.3% | 0.19 | 1.6 MB | 3.8% | 0.45 |
| May 3 10:00:00 - 10:59:59 | 692 | 4.5% | 0.19 | 2.0 MB | 4.8% | 0.56 |
| May 3 11:00:00 - 11:59:59 | 708 | 4.6% | 0.20 | 1.6 MB | 4.0% | 0.47 |
| May 3 12:00:00 - 12:59:59 | 810 | 5.2% | 0.23 | 1.9 MB | 4.7% | 0.55 |
| May 3 13:00:00 - 13:59:59 | 899 | 5.8% | 0.25 | 2.2 MB | 5.5% | 0.64 |
| May 3 14:00:00 - 14:59:59 | 948 | 6.1% | 0.26 | 2.5 MB | 6.0% | 0.71 |
| May 3 15:00:00 - 15:59:59 | 938 | 6.0% | 0.26 | 2.4 MB | 5.8% | 0.67 |
| May 3 16:00:00 - 16:59:59 | 931 | 6.0% | 0.26 | 2.3 MB | 5.7% | 0.66 |
| May 3 17:00:00 - 17:59:59 | 829 | 5.3% | 0.23 | 2.1 MB | 5.2% | 0.60 |
| May 3 18:00:00 - 18:59:59 | 824 | 5.3% | 0.23 | 2.1 MB | 5.1% | 0.60 |
| May 3 19:00:00 - 19:59:59 | 831 | 5.4% | 0.23 | 2.2 MB | 5.5% | 0.64 |
| May 3 20:00:00 - 20:59:59 | 746 | 4.8% | 0.21 | 2.2 MB | 5.4% | 0.63 |
| May 3 21:00:00 - 21:59:59 | 679 | 4.4% | 0.19 | 1.9 MB | 4.6% | 0.54 |
| May 3 22:00:00 - 22:59:59 | 518 | 3.3% | 0.14 | 1.4 MB | 3.5% | 0.41 |
| May 3 23:00:00 - 23:59:59 | 518 | 3.3% | 0.14 | 1.6 MB | 3.9% | 0.46 |
| May 4 00:00:00 - 00:59:59 | 344 | 2.2% | 0.10 | 1020.7 KB | 2.4% | 0.28 |
| May 4 01:00:00 - 01:59:59 | 291 | 1.9% | 0.08 | 804.1 KB | 1.9% | 0.22 |
| May 4 02:00:00 - 02:59:59 | 341 | 2.2% | 0.09 | 1.0 MB | 2.5% | 0.30 |
| May 4 03:00:00 - 03:59:59 | 320 | 2.1% | 0.09 | 1.1 MB | 2.6% | 0.30 |
| May 4 04:00:00 - 04:15:01 | 90 | 0.6% | 0.10 | 282.5 KB | 0.7% | 0.31 |
| TOTAL: 24:00:00 | 15513 | 100.0% | 0.18 | 41.1 MB | 100.0% | 0.49 |
Sites sending bad articles:
| Server | Total | Group | Dist | Duplic | Unapp | TooOld | Site | Line | Other | |
|---|---|---|---|---|---|---|---|---|---|---|
| 1 | i2pn | 554 | 2 | 0 | 0 | 0 | 0 | 0 | 0 | 552 |
| TOTAL: 1 | 554 | 2 | 0 | 0 | 0 | 0 | 0 | 0 | 552 | |
Unwanted newsgroups [Top 20]:
| Newsgroup | Count |
|---|---|
| alt.social-security-disability | 1 |
| 24hoursupport.helpdesk | 1 |
| TOTAL: 2 | 2 |
INND Perl filter [Top 20]:
| Reason | Count |
|---|---|
| Scoring filter (s5) | 88 |
| Scoring filter (n6) | 23 |
| Scoring filter (s6) | 23 |
| Scoring filter (n4) | 4 |
| Cancel for rejected article | 1 |
| TOTAL: 5 | 139 |
NoCeM on Spool:
| Id | Good | Bad | Unique | Total |
|---|---|---|---|---|
| bleachbot@httrack.com | 75 | 0 | 76 | 76 |
| TOTAL: 1 | 75 | 8 | 76 | 76 |
Miscellaneous innd statistics [Top 10]:
| Event | Server | Number |
|---|---|---|
| Including strange strings | ||
| i2pn | 413 | |
| TOTAL: 1 | 413 | |
| TOTAL: 1 | 413 | |
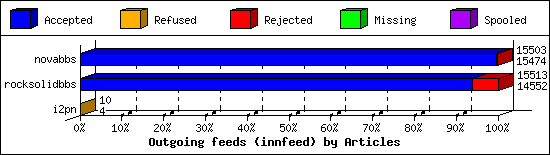
Outgoing Feeds (innfeed) by Articles:
| Server | Offered | Taken | Refused | Reject | Miss | Spool | %Took | Elapsed | |
|---|---|---|---|---|---|---|---|---|---|
| 1 | novabbs | 15506 | 15474 | 2 | 27 | 0 | 0 | 99% | 23:59:53 |
| 2 | rocksolidbbs | 15519 | 14552 | 3 | 958 | 0 | 0 | 93% | 23:59:53 |
| 3 | i2pn | 10 | 4 | 6 | 0 | 0 | 0 | 40% | 01:02:05 |
| TOTAL: 3 | 31035 | 30030 | 11 | 985 | 0 | 0 | 96% | 49:01:51 | |
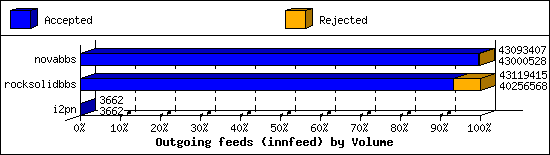
Outgoing Feeds (innfeed) by Volume:
| Server | AcceptVol | RejectVol | TotalVol | Volume/sec | Vol/Art | Elapsed | |
|---|---|---|---|---|---|---|---|
| 1 | novabbs | 41.0 MB | 90.7 KB | 41.1 MB | 0.5 KB/s | 2.7 KB | 23:59:53 |
| 2 | rocksolidbbs | 38.4 MB | 2.7 MB | 41.1 MB | 0.5 KB/s | 2.7 KB | 23:59:53 |
| 3 | i2pn | 3.6 KB | 0.0 KB | 3.6 KB | 0.0 KB/s | 0.9 KB | 01:02:05 |
| TOTAL: 3 | 79.4 MB | 2.8 MB | 82.2 MB | 0.5 KB/s | 2.7 KB | 49:01:51 | |
NNRP readership statistics:
| System | Conn | Arts | Size | Groups | Post | Rej | Elapsed | |
|---|---|---|---|---|---|---|---|---|
| 1 | 119.18.195.200 | 1 | 0 | 0.0 KB | 0 | 0 | 0 | 00:00:00 |
| 2 | 39.98.236.118 | 2 | 0 | 0.0 KB | 0 | 0 | 0 | 00:00:00 |
| TOTAL: 2 | 3 | 0 | 0.0 KB | 0 | 0 | 0 | 00:00:01 | |
NNRP readership statistics (by domain):
| System | Conn | Arts | Size | Groups | Post | Rej | Elapsed | |
|---|---|---|---|---|---|---|---|---|
| 1 | unresolved | 3 | 0 | 0.0 KB | 0 | 0 | 0 | 00:00:01 |
| TOTAL: 1 | 3 | 0 | 0.0 KB | 0 | 0 | 0 | 00:00:01 | |
NNRP total resource statistics [Top 20]:
| System | User(ms) | System(ms) | Idle(ms) | Elapsed |
|---|---|---|---|---|
| 39.98.236.118 | 0.084 | 0.000 | 0.000 | 00:00:00 |
| 119.18.195.200 | 0.040 | 0.004 | 0.000 | 00:00:00 |
| TOTAL: 2 | 0.124 | 0.004 | 0.000 | 00:00:01 |
