Log entries by program:
| Program name | Lines | %Lines | Size | %Size |
|---|---|---|---|---|
| inn | 15906 | 87.4% | 1.5 MB | 82.6% |
| innd | 1341 | 7.4% | 188.7 KB | 10.2% |
| innfeed | 888 | 4.9% | 125.0 KB | 6.8% |
| nocem | 58 | 0.3% | 6.2 KB | 0.3% |
| nnrpd | 11 | 0.1% | 1.2 KB | 0.1% |
| controlchan | 1 | 0.0% | 0.0 KB | 0.0% |
| TOTAL: 6 | 18205 | 100.0% | 1.8 MB | 100.0% |
History cache:
| Reason | Count | %Count |
|---|---|---|
| Do not exist | 15406 | 97.5% |
| Negative hits | 302 | 1.9% |
| Positive hits | 79 | 0.5% |
| Cache misses | 6 | 0.0% |
| TOTAL: 4 | 15793 | 100.0% |
INND timer:
| Code region | Time | Pct | Invoked | Min(ms) | Avg(ms) | Max(ms) |
|---|---|---|---|---|---|---|
| article cancel | 00:00:00.020 | 0.0% | 97 | 0.000 | 0.206 | 2.000 |
| article cleanup | 00:00:00.064 | 0.0% | 15456 | 0.000 | 0.004 | 0.037 |
| article logging | 00:00:00.336 | 0.0% | 15857 | 0.000 | 0.021 | 0.078 |
| article parse | 00:00:00.229 | 0.0% | 17423 | 0.000 | 0.013 | 0.062 |
| article write | 00:00:04.351 | 0.0% | 15293 | 0.064 | 0.285 | 1.102 |
| artlog/artcncl | 00:00:00.001 | 0.0% | 65 | 0.000 | 0.015 | 0.500 |
| artlog/artwrite | 00:00:00.000 | 0.0% | 0 | 0.000 | 0.000 | 0.000 |
| data move | 00:00:00.009 | 0.0% | 19332 | 0.000 | 0.000 | 0.027 |
| hisgrep/artcncl | 00:00:00.002 | 0.0% | 90 | 0.000 | 0.022 | 0.333 |
| hishave/artcncl | 00:00:00.002 | 0.0% | 97 | 0.000 | 0.021 | 0.333 |
| history grep | 00:00:00.000 | 0.0% | 0 | 0.000 | 0.000 | 0.000 |
| history lookup | 00:00:01.138 | 0.0% | 15813 | 0.000 | 0.072 | 0.808 |
| history sync | 00:00:00.012 | 0.0% | 413 | 0.000 | 0.029 | 0.500 |
| history write | 00:00:01.850 | 0.0% | 15454 | 0.000 | 0.120 | 0.483 |
| hiswrite/artcncl | 00:00:00.001 | 0.0% | 7 | 0.000 | 0.143 | 1.000 |
| idle | 24:00:43.203 | 100.0% | 18239 | 2564.440 | 4739.471 | 12257.878 |
| nntp read | 00:00:00.420 | 0.0% | 17885 | 0.000 | 0.023 | 0.069 |
| overview write | 00:00:03.073 | 0.0% | 15293 | 0.000 | 0.201 | 1.278 |
| perl filter | 00:00:08.779 | 0.0% | 15454 | 0.389 | 0.568 | 1.071 |
| python filter | 00:00:00.000 | 0.0% | 0 | 0.000 | 0.000 | 0.000 |
| site send | 00:00:00.193 | 0.0% | 15345 | 0.000 | 0.013 | 0.074 |
| TOTAL: 24:01:05.726 | 24:01:03.683 | 100.0% | - | - | - | - |
INNfeed timer:
| Code region | Time | Pct | Invoked | Min(ms) | Avg(ms) | Max(ms) |
|---|---|---|---|---|---|---|
| article new | 00:00:00.021 | 0.0% | 15333 | 0.000 | 0.001 | 0.017 |
| article prepare | 00:00:00.009 | 0.0% | 121804 | 0.000 | 0.000 | 0.003 |
| article read | 00:00:00.541 | 0.0% | 15268 | 0.000 | 0.035 | 0.592 |
| backlog stats | 00:00:00.013 | 0.0% | 68569 | 0.000 | 0.000 | 0.003 |
| callbacks | 00:00:00.000 | 0.0% | 0 | 0.000 | 0.000 | 0.000 |
| data read | 00:00:00.235 | 0.0% | 47358 | 0.000 | 0.005 | 0.019 |
| data write | 00:00:00.497 | 0.0% | 32169 | 0.000 | 0.015 | 0.045 |
| idle | 23:58:41.245 | 100.0% | 68569 | 578.281 | 1258.896 | 3063.642 |
| status file | 00:00:00.104 | 0.0% | 221 | 0.000 | 0.471 | 5.250 |
| TOTAL: 23:58:43.460 | 23:58:42.665 | 100.0% | - | - | - | - |
nnrpd timer:
| Code region | Time | Pct | Invoked | Min(ms) | Avg(ms) | Max(ms) |
|---|---|---|---|---|---|---|
| idle | 00:00:09.994 | 95.7% | 3 | 77.500 | 3331.333 | 9839.000 |
| newnews | 00:00:00.000 | 0.0% | 0 | 0.000 | 0.000 | 0.000 |
| nntpwrite | 00:00:00.000 | 0.0% | 13 | 0.000 | 0.000 | 0.000 |
| TOTAL: 00:00:10.445 | 00:00:09.994 | 95.7% | - | - | - | - |
Control commands to INND:
| Command | Number |
|---|---|
| L | 1 |
| flush | 3 |
| flushlogs | 2 |
| go | 2 |
| logmode | 2 |
| mode | 149 |
| name | 2 |
| pause | 2 |
| paused | 2 |
| reload | 2 |
| reserve | 2 |
| TOTAL: 11 | 169 |
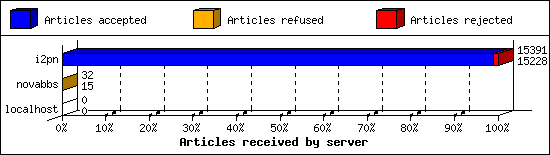
Incoming Feeds (INN):
| Server | Connects | Offered | Taken | Refused | Reject | %Accpt | Elapsed | |
|---|---|---|---|---|---|---|---|---|
| 1 | i2pn | 6 | 15391 | 15228 | 0 | 163 | 98% | 24:21:12 |
| 2 | novabbs | 23 | 32 | 15 | 17 | 0 | 46% | 04:24:33 |
| 3 | localhost | 31 | 0 | 0 | 0 | 0 | 0% | 00:00:00 |
| TOTAL: 3 | 60 | 15423 | 15243 | 17 | 163 | 98% | 28:45:45 | |
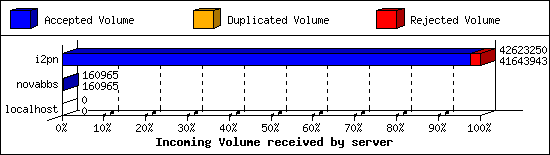
Incoming Volume (INN):
| Server | AcceptVol | DupVol | RejVol | TotalVol | %Acc | Vol/Art | |
|---|---|---|---|---|---|---|---|
| 1 | i2pn | 39.7 MB | 3.5 KB | 952.9 KB | 40.6 MB | 97% | 2.7 KB |
| 2 | novabbs | 157.2 KB | 0.0 KB | 0.0 KB | 157.2 KB | 100% | 10.5 KB |
| 3 | localhost | 0.0 KB | 0.0 KB | 0.0 KB | 0.0 KB | 0% | 0 |
| TOTAL: 3 | 39.9 MB | 3.5 KB | 952.9 KB | 40.8 MB | 97% | 2.7 KB | |
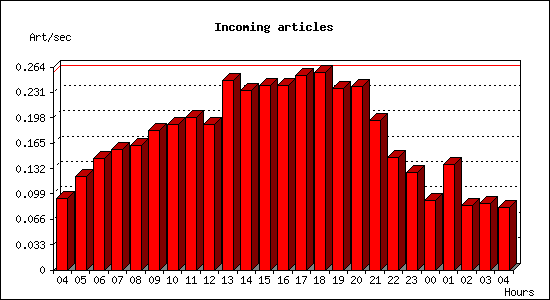
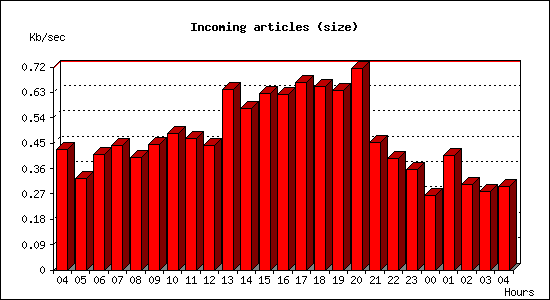
Incoming articles:
| Date | Articles | %Arts | Art/sec | Size | %Size | KB/sec |
|---|---|---|---|---|---|---|
| May 4 04:15:01 - 04:59:59 | 252 | 1.6% | 0.09 | 1.1 MB | 2.8% | 0.43 |
| May 4 05:00:00 - 05:59:59 | 440 | 2.9% | 0.12 | 1.1 MB | 2.8% | 0.32 |
| May 4 06:00:00 - 06:59:59 | 524 | 3.4% | 0.15 | 1.4 MB | 3.6% | 0.41 |
| May 4 07:00:00 - 07:59:59 | 565 | 3.7% | 0.16 | 1.5 MB | 3.9% | 0.44 |
| May 4 08:00:00 - 08:59:59 | 583 | 3.8% | 0.16 | 1.4 MB | 3.5% | 0.40 |
| May 4 09:00:00 - 09:59:59 | 651 | 4.3% | 0.18 | 1.6 MB | 3.9% | 0.45 |
| May 4 10:00:00 - 10:59:59 | 679 | 4.4% | 0.19 | 1.7 MB | 4.2% | 0.48 |
| May 4 11:00:00 - 11:59:59 | 712 | 4.7% | 0.20 | 1.6 MB | 4.1% | 0.47 |
| May 4 12:00:00 - 12:59:59 | 682 | 4.5% | 0.19 | 1.6 MB | 3.9% | 0.44 |
| May 4 13:00:00 - 13:59:59 | 887 | 5.8% | 0.25 | 2.3 MB | 5.6% | 0.64 |
| May 4 14:00:00 - 14:59:59 | 839 | 5.5% | 0.23 | 2.0 MB | 5.0% | 0.57 |
| May 4 15:00:00 - 15:59:59 | 864 | 5.7% | 0.24 | 2.2 MB | 5.5% | 0.62 |
| May 4 16:00:00 - 16:59:59 | 862 | 5.6% | 0.24 | 2.2 MB | 5.5% | 0.62 |
| May 4 17:00:00 - 17:59:59 | 912 | 6.0% | 0.25 | 2.3 MB | 5.8% | 0.66 |
| May 4 18:00:00 - 18:59:59 | 924 | 6.0% | 0.26 | 2.3 MB | 5.7% | 0.65 |
| May 4 19:00:00 - 19:59:59 | 852 | 5.6% | 0.24 | 2.2 MB | 5.6% | 0.64 |
| May 4 20:00:00 - 20:59:59 | 861 | 5.6% | 0.24 | 2.5 MB | 6.3% | 0.72 |
| May 4 21:00:00 - 21:59:59 | 701 | 4.6% | 0.19 | 1.6 MB | 4.0% | 0.45 |
| May 4 22:00:00 - 22:59:59 | 529 | 3.5% | 0.15 | 1.4 MB | 3.5% | 0.39 |
| May 4 23:00:00 - 23:59:59 | 457 | 3.0% | 0.13 | 1.3 MB | 3.1% | 0.36 |
| May 5 00:00:00 - 00:59:59 | 326 | 2.1% | 0.09 | 956.0 KB | 2.3% | 0.27 |
| May 5 01:00:00 - 01:59:59 | 494 | 3.2% | 0.14 | 1.4 MB | 3.6% | 0.41 |
| May 5 02:00:00 - 02:59:59 | 301 | 2.0% | 0.08 | 1.1 MB | 2.7% | 0.30 |
| May 5 03:00:00 - 03:59:59 | 309 | 2.0% | 0.09 | 1001.8 KB | 2.4% | 0.28 |
| May 5 04:00:00 - 04:15:01 | 73 | 0.5% | 0.08 | 266.4 KB | 0.6% | 0.30 |
| TOTAL: 24:00:00 | 15279 | 100.0% | 0.18 | 40.0 MB | 100.0% | 0.47 |
Sites sending bad articles:
| Server | Total | Group | Dist | Duplic | Unapp | TooOld | Site | Line | Other | |
|---|---|---|---|---|---|---|---|---|---|---|
| 1 | i2pn | 564 | 2 | 0 | 2 | 0 | 0 | 0 | 0 | 560 |
| TOTAL: 1 | 564 | 2 | 0 | 2 | 0 | 0 | 0 | 0 | 560 | |
Unwanted newsgroups [Top 20]:
| Newsgroup | Count |
|---|---|
| 24hoursupport.helpdesk | 1 |
| hk.politics | 1 |
| TOTAL: 2 | 2 |
INND Perl filter [Top 20]:
| Reason | Count |
|---|---|
| Scoring filter (s5) | 96 |
| Scoring filter (n6) | 28 |
| Scoring filter (s6) | 28 |
| Scoring filter (n4) | 8 |
| TOTAL: 4 | 160 |
NoCeM on Spool:
| Id | Good | Bad | Unique | Total |
|---|---|---|---|---|
| bleachbot@httrack.com | 46 | 0 | 49 | 49 |
| TOTAL: 1 | 46 | 6 | 49 | 49 |
Miscellaneous innd statistics [Top 10]:
| Event | Server | Number |
|---|---|---|
| Including strange strings | ||
| i2pn | 400 | |
| TOTAL: 1 | 400 | |
| TOTAL: 1 | 400 | |
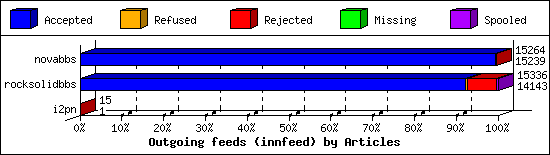
Outgoing Feeds (innfeed) by Articles:
| Server | Offered | Taken | Refused | Reject | Miss | Spool | %Took | Elapsed | |
|---|---|---|---|---|---|---|---|---|---|
| 1 | novabbs | 15267 | 15239 | 2 | 23 | 0 | 0 | 99% | 23:59:58 |
| 2 | rocksolidbbs | 15319 | 14143 | 88 | 1048 | 0 | 57 | 92% | 23:59:56 |
| 3 | i2pn | 17 | 1 | 11 | 3 | 0 | 0 | 5% | 01:54:48 |
| TOTAL: 3 | 30603 | 29383 | 101 | 1074 | 0 | 57 | 96% | 49:54:42 | |
Outgoing Feeds (innfeed) by Volume:
| Server | AcceptVol | RejectVol | TotalVol | Volume/sec | Vol/Art | Elapsed | |
|---|---|---|---|---|---|---|---|
| 1 | novabbs | 39.9 MB | 68.5 KB | 39.9 MB | 0.5 KB/s | 2.7 KB | 23:59:58 |
| 2 | rocksolidbbs | 36.9 MB | 2.8 MB | 39.7 MB | 0.5 KB/s | 2.7 KB | 23:59:56 |
| 3 | i2pn | 1.5 KB | 9.3 KB | 10.8 KB | 0.0 KB/s | 2.7 KB | 01:54:48 |
| TOTAL: 3 | 76.8 MB | 2.9 MB | 79.7 MB | 0.5 KB/s | 2.7 KB | 49:54:42 | |

NNRP readership statistics:
| System | Conn | Arts | Size | Groups | Post | Rej | Elapsed | |
|---|---|---|---|---|---|---|---|---|
| 1 | 107.170.198.205 | 1 | 0 | 0.0 KB | 0 | 0 | 0 | 00:00:09 |
| 2 | scan-141.security.ipip.net | 1 | 0 | 0.0 KB | 0 | 0 | 0 | 00:00:00 |
| TOTAL: 2 | 2 | 0 | 0.0 KB | 0 | 0 | 0 | 00:00:10 | |
NNRP readership statistics (by domain):
| System | Conn | Arts | Size | Groups | Post | Rej | Elapsed | |
|---|---|---|---|---|---|---|---|---|
| 1 | *.security.ipip.net | 1 | 0 | 0.0 KB | 0 | 0 | 0 | 00:00:00 |
| 2 | unresolved | 1 | 0 | 0.0 KB | 0 | 0 | 0 | 00:00:09 |
| TOTAL: 2 | 2 | 0 | 0.0 KB | 0 | 0 | 0 | 00:00:10 | |
NNRP total resource statistics [Top 20]:
| System | User(ms) | System(ms) | Idle(ms) | Elapsed |
|---|---|---|---|---|
| 107.170.198.205 | 0.044 | 0.004 | 0.000 | 00:00:09 |
| scan-141.security.ipip.net | 0.040 | 0.004 | 0.000 | 00:00:00 |
| TOTAL: 2 | 0.084 | 0.008 | 0.000 | 00:00:10 |
NNRP unrecognized commands (by host):
| System | Conn |
|---|---|
| scan-141.security.ipip.net | 4 |
| TOTAL: 1 | 4 |
NNRP unrecognized commands (by command):
| Command | Count |
|---|---|
| Connection: close | 1 |
| User-Agent: HTTP Banner Detection (https... | 1 |
| Host: 157.230.63.40:119 | 1 |
| GET / HTTP/1.1 | 1 |
| TOTAL: 4 | 4 |
