Log entries by program:
| Program name | Lines | %Lines | Size | %Size |
|---|---|---|---|---|
| inn | 17350 | 88.0% | 1.6 MB | 83.5% |
| innd | 1342 | 6.8% | 199.9 KB | 10.1% |
| innfeed | 907 | 4.6% | 112.6 KB | 5.7% |
| nocem | 118 | 0.6% | 15.2 KB | 0.8% |
| nnrpd | 8 | 0.0% | 1.1 KB | 0.1% |
| controlchan | 1 | 0.0% | 0.1 KB | 0.0% |
| TOTAL: 6 | 19726 | 100.0% | 1.9 MB | 100.0% |
History cache:
| Reason | Count | %Count |
|---|---|---|
| Do not exist | 16856 | 97.2% |
| Negative hits | 304 | 1.8% |
| Positive hits | 160 | 0.9% |
| Cache misses | 29 | 0.2% |
| TOTAL: 4 | 17349 | 100.0% |
INND timer:
| Code region | Time | Pct | Invoked | Min(ms) | Avg(ms) | Max(ms) |
|---|---|---|---|---|---|---|
| article cancel | 00:00:00.098 | 0.0% | 217 | 0.000 | 0.452 | 10.500 |
| article cleanup | 00:00:00.071 | 0.0% | 16886 | 0.000 | 0.004 | 0.024 |
| article logging | 00:00:00.432 | 0.0% | 17201 | 0.000 | 0.025 | 0.071 |
| article parse | 00:00:00.224 | 0.0% | 19178 | 0.000 | 0.012 | 0.049 |
| article write | 00:00:08.000 | 0.0% | 16748 | 0.114 | 0.478 | 1.354 |
| artlog/artcncl | 00:00:00.001 | 0.0% | 157 | 0.000 | 0.006 | 0.091 |
| artlog/artwrite | 00:00:00.000 | 0.0% | 0 | 0.000 | 0.000 | 0.000 |
| data move | 00:00:00.006 | 0.0% | 21453 | 0.000 | 0.000 | 0.014 |
| hisgrep/artcncl | 00:00:00.007 | 0.0% | 196 | 0.000 | 0.036 | 1.000 |
| hishave/artcncl | 00:00:00.004 | 0.0% | 217 | 0.000 | 0.018 | 1.000 |
| history grep | 00:00:00.000 | 0.0% | 0 | 0.000 | 0.000 | 0.000 |
| history lookup | 00:00:03.107 | 0.0% | 17207 | 0.000 | 0.181 | 1.331 |
| history sync | 00:00:00.011 | 0.0% | 301 | 0.000 | 0.037 | 0.500 |
| history write | 00:00:03.605 | 0.0% | 16885 | 0.020 | 0.214 | 0.873 |
| hiswrite/artcncl | 00:00:00.002 | 0.0% | 21 | 0.000 | 0.095 | 0.500 |
| idle | 23:59:48.378 | 100.0% | 19922 | 2418.460 | 4336.331 | 12001.500 |
| nntp read | 00:00:00.452 | 0.0% | 19681 | 0.000 | 0.023 | 0.079 |
| overview write | 00:00:03.112 | 0.0% | 16748 | 0.020 | 0.186 | 1.578 |
| perl filter | 00:00:09.717 | 0.0% | 16885 | 0.392 | 0.575 | 1.299 |
| python filter | 00:00:00.000 | 0.0% | 0 | 0.000 | 0.000 | 0.000 |
| site send | 00:00:00.301 | 0.0% | 16857 | 0.000 | 0.018 | 0.062 |
| TOTAL: 24:00:19.814 | 24:00:17.528 | 100.0% | - | - | - | - |
INNfeed timer:
| Code region | Time | Pct | Invoked | Min(ms) | Avg(ms) | Max(ms) |
|---|---|---|---|---|---|---|
| article new | 00:00:00.028 | 0.0% | 16738 | 0.000 | 0.002 | 0.021 |
| article prepare | 00:00:00.006 | 0.0% | 133800 | 0.000 | 0.000 | 0.003 |
| article read | 00:00:00.584 | 0.0% | 16733 | 0.000 | 0.035 | 0.533 |
| backlog stats | 00:00:00.022 | 0.0% | 72989 | 0.000 | 0.000 | 0.005 |
| callbacks | 00:00:00.000 | 0.0% | 0 | 0.000 | 0.000 | 0.000 |
| data read | 00:00:00.256 | 0.0% | 51126 | 0.000 | 0.005 | 0.018 |
| data write | 00:00:00.505 | 0.0% | 34402 | 0.000 | 0.015 | 0.051 |
| idle | 23:59:17.062 | 100.0% | 72989 | 646.315 | 1183.152 | 3322.243 |
| status file | 00:00:00.069 | 0.0% | 227 | 0.000 | 0.304 | 2.000 |
| TOTAL: 23:59:19.423 | 23:59:18.532 | 100.0% | - | - | - | - |
nnrpd timer:
| Code region | Time | Pct | Invoked | Min(ms) | Avg(ms) | Max(ms) |
|---|---|---|---|---|---|---|
| idle | 00:00:10.142 | 96.2% | 2 | 286.000 | 5071.000 | 9856.000 |
| newnews | 00:00:00.000 | 0.0% | 0 | 0.000 | 0.000 | 0.000 |
| nntpwrite | 00:00:00.000 | 0.0% | 4 | 0.000 | 0.000 | 0.000 |
| TOTAL: 00:00:10.538 | 00:00:10.142 | 96.2% | - | - | - | - |
Control commands to INND:
| Command | Number |
|---|---|
| L | 1 |
| flush | 3 |
| flushlogs | 2 |
| go | 2 |
| logmode | 2 |
| mode | 149 |
| name | 2 |
| pause | 2 |
| paused | 2 |
| reload | 2 |
| reserve | 2 |
| TOTAL: 11 | 169 |
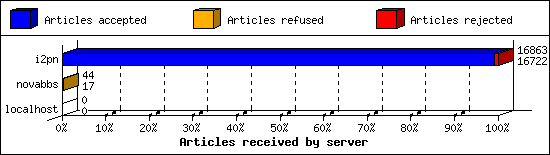
Incoming Feeds (INN):
| Server | Connects | Offered | Taken | Refused | Reject | %Accpt | Elapsed | |
|---|---|---|---|---|---|---|---|---|
| 1 | i2pn | 8 | 16863 | 16722 | 2 | 139 | 99% | 24:46:24 |
| 2 | novabbs | 16 | 44 | 17 | 27 | 0 | 38% | 03:46:48 |
| 3 | localhost | 34 | 0 | 0 | 0 | 0 | 0% | 00:00:00 |
| TOTAL: 3 | 58 | 16907 | 16739 | 29 | 139 | 99% | 28:33:12 | |
Incoming Volume (INN):
| Server | AcceptVol | DupVol | RejVol | TotalVol | %Acc | Vol/Art | |
|---|---|---|---|---|---|---|---|
| 1 | i2pn | 45.3 MB | 2.8 KB | 1.3 MB | 46.6 MB | 97% | 2.8 KB |
| 2 | novabbs | 39.5 KB | 0.0 KB | 0.0 KB | 39.5 KB | 100% | 2.3 KB |
| 3 | localhost | 0.0 KB | 0.0 KB | 0.0 KB | 0.0 KB | 0% | 0 |
| TOTAL: 3 | 45.4 MB | 2.8 KB | 1.3 MB | 46.7 MB | 97% | 2.8 KB | |

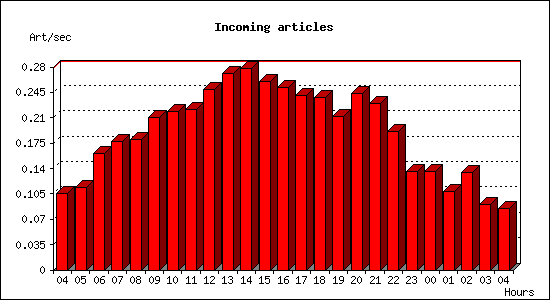
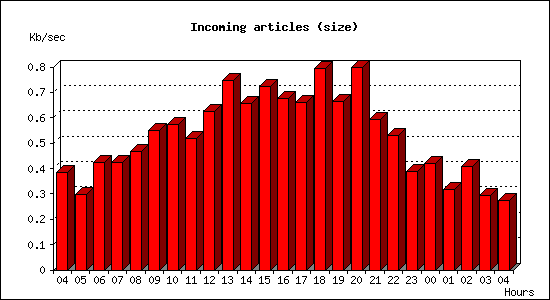
Incoming articles:
| Date | Articles | %Arts | Art/sec | Size | %Size | KB/sec |
|---|---|---|---|---|---|---|
| May 7 04:15:02 - 04:59:59 | 284 | 1.7% | 0.11 | 1.0 MB | 2.2% | 0.39 |
| May 7 05:00:00 - 05:59:59 | 410 | 2.4% | 0.11 | 1.0 MB | 2.3% | 0.30 |
| May 7 06:00:00 - 06:59:59 | 579 | 3.5% | 0.16 | 1.5 MB | 3.3% | 0.42 |
| May 7 07:00:00 - 07:59:59 | 636 | 3.8% | 0.18 | 1.5 MB | 3.3% | 0.42 |
| May 7 08:00:00 - 08:59:59 | 650 | 3.9% | 0.18 | 1.6 MB | 3.6% | 0.47 |
| May 7 09:00:00 - 09:59:59 | 757 | 4.5% | 0.21 | 1.9 MB | 4.3% | 0.55 |
| May 7 10:00:00 - 10:59:59 | 785 | 4.7% | 0.22 | 2.0 MB | 4.4% | 0.57 |
| May 7 11:00:00 - 11:59:59 | 799 | 4.8% | 0.22 | 1.8 MB | 4.0% | 0.52 |
| May 7 12:00:00 - 12:59:59 | 898 | 5.4% | 0.25 | 2.2 MB | 4.9% | 0.63 |
| May 7 13:00:00 - 13:59:59 | 974 | 5.8% | 0.27 | 2.6 MB | 5.8% | 0.75 |
| May 7 14:00:00 - 14:59:59 | 1000 | 6.0% | 0.28 | 2.3 MB | 5.1% | 0.66 |
| May 7 15:00:00 - 15:59:59 | 936 | 5.6% | 0.26 | 2.5 MB | 5.6% | 0.72 |
| May 7 16:00:00 - 16:59:59 | 904 | 5.4% | 0.25 | 2.4 MB | 5.3% | 0.68 |
| May 7 17:00:00 - 17:59:59 | 865 | 5.2% | 0.24 | 2.3 MB | 5.1% | 0.66 |
| May 7 18:00:00 - 18:59:59 | 858 | 5.1% | 0.24 | 2.8 MB | 6.1% | 0.79 |
| May 7 19:00:00 - 19:59:59 | 761 | 4.5% | 0.21 | 2.3 MB | 5.2% | 0.67 |
| May 7 20:00:00 - 20:59:59 | 875 | 5.2% | 0.24 | 2.8 MB | 6.2% | 0.80 |
| May 7 21:00:00 - 21:59:59 | 828 | 4.9% | 0.23 | 2.1 MB | 4.6% | 0.59 |
| May 7 22:00:00 - 22:59:59 | 686 | 4.1% | 0.19 | 1.9 MB | 4.1% | 0.53 |
| May 7 23:00:00 - 23:59:59 | 490 | 2.9% | 0.14 | 1.4 MB | 3.0% | 0.39 |
| May 8 00:00:00 - 00:59:59 | 489 | 2.9% | 0.14 | 1.5 MB | 3.3% | 0.42 |
| May 8 01:00:00 - 01:59:59 | 392 | 2.3% | 0.11 | 1.1 MB | 2.4% | 0.32 |
| May 8 02:00:00 - 02:59:59 | 482 | 2.9% | 0.13 | 1.4 MB | 3.1% | 0.41 |
| May 8 03:00:00 - 03:59:59 | 324 | 1.9% | 0.09 | 1.0 MB | 2.3% | 0.29 |
| May 8 04:00:00 - 04:15:01 | 77 | 0.5% | 0.09 | 246.8 KB | 0.5% | 0.27 |
| TOTAL: 23:59:59 | 16739 | 100.0% | 0.19 | 45.4 MB | 100.0% | 0.54 |
Sites sending bad articles:
| Server | Total | Group | Dist | Duplic | Unapp | TooOld | Site | Line | Other | |
|---|---|---|---|---|---|---|---|---|---|---|
| 1 | i2pn | 454 | 2 | 0 | 1 | 0 | 0 | 0 | 0 | 451 |
| TOTAL: 1 | 454 | 2 | 0 | 1 | 0 | 0 | 0 | 0 | 451 | |
Unwanted newsgroups [Top 20]:
| Newsgroup | Count |
|---|---|
| hk.politics | 2 |
| TOTAL: 1 | 2 |
INND Perl filter [Top 20]:
| Reason | Count |
|---|---|
| Scoring filter (s5) | 94 |
| Scoring filter (s6) | 41 |
| Scoring filter (s7) | 1 |
| TOTAL: 3 | 136 |
NoCeM on Spool:
| Id | Good | Bad | Unique | Total |
|---|---|---|---|---|
| bleachbot@httrack.com | 85 | 0 | 94 | 94 |
| TOTAL: 1 | 85 | 24 | 94 | 94 |
Miscellaneous innd statistics [Top 10]:
| Event | Server | Number |
|---|---|---|
| Including strange strings | ||
| i2pn | 315 | |
| TOTAL: 1 | 315 | |
| TOTAL: 1 | 315 | |
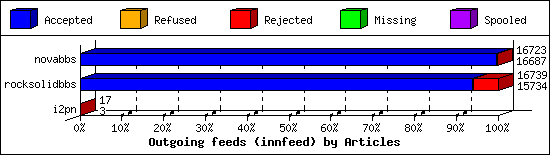
Outgoing Feeds (innfeed) by Articles:
| Server | Offered | Taken | Refused | Reject | Miss | Spool | %Took | Elapsed | |
|---|---|---|---|---|---|---|---|---|---|
| 1 | novabbs | 16731 | 16687 | 6 | 30 | 0 | 0 | 99% | 23:59:50 |
| 2 | rocksolidbbs | 16745 | 15734 | 7 | 998 | 0 | 0 | 93% | 23:59:55 |
| 3 | i2pn | 18 | 3 | 12 | 2 | 0 | 0 | 16% | 01:56:48 |
| TOTAL: 3 | 33494 | 32424 | 25 | 1030 | 0 | 0 | 96% | 49:56:33 | |
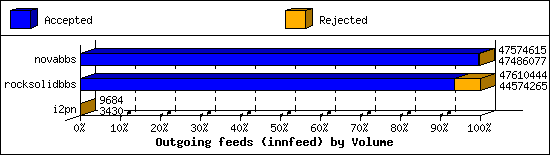
Outgoing Feeds (innfeed) by Volume:
| Server | AcceptVol | RejectVol | TotalVol | Volume/sec | Vol/Art | Elapsed | |
|---|---|---|---|---|---|---|---|
| 1 | novabbs | 45.3 MB | 86.5 KB | 45.4 MB | 0.5 KB/s | 2.8 KB | 23:59:50 |
| 2 | rocksolidbbs | 42.5 MB | 2.9 MB | 45.4 MB | 0.5 KB/s | 2.8 KB | 23:59:55 |
| 3 | i2pn | 3.3 KB | 6.1 KB | 9.5 KB | 0.0 KB/s | 1.9 KB | 01:56:48 |
| TOTAL: 3 | 87.8 MB | 3.0 MB | 90.8 MB | 0.5 KB/s | 2.8 KB | 49:56:33 | |
NNRP readership statistics:
| System | Conn | Arts | Size | Groups | Post | Rej | Elapsed | |
|---|---|---|---|---|---|---|---|---|
| 1 | 106.75.63.218 | 1 | 0 | 0.0 KB | 0 | 0 | 0 | 00:00:00 |
| 2 | 162.243.143.129 | 1 | 0 | 0.0 KB | 0 | 0 | 0 | 00:00:09 |
| TOTAL: 2 | 2 | 0 | 0.0 KB | 0 | 0 | 0 | 00:00:10 | |
NNRP readership statistics (by domain):
| System | Conn | Arts | Size | Groups | Post | Rej | Elapsed | |
|---|---|---|---|---|---|---|---|---|
| 1 | unresolved | 2 | 0 | 0.0 KB | 0 | 0 | 0 | 00:00:10 |
| TOTAL: 1 | 2 | 0 | 0.0 KB | 0 | 0 | 0 | 00:00:10 | |
NNRP total resource statistics [Top 20]:
| System | User(ms) | System(ms) | Idle(ms) | Elapsed |
|---|---|---|---|---|
| 162.243.143.129 | 0.040 | 0.004 | 0.000 | 00:00:09 |
| 106.75.63.218 | 0.048 | 0.000 | 0.000 | 00:00:00 |
| TOTAL: 2 | 0.088 | 0.004 | 0.000 | 00:00:10 |
